
Model of Leadership Style on Job Satisfaction in Internal Audit Team
at Regional Inspectorates with Locus of Control and Cognitive Style
as Moderated Variable
Nurzaimah, Firman Syarif
Faculty of Economics, Universitas Sumatera Utara, Indonesia
Keywords: Leadership Style, Locus of Control, Cognitive Style, Job Satisfaction.
Abstract: Purpose: The purpose of this study is the identification and development of good practices in governance of
the Regional Inspectorate, to obtain empirical evidence of how much leadership style in the Regional
Inspectorate audit team, how big is the model of leadership style interaction with the Locus of control in the
Regional Inspectorate audit team, how large model of leadership style interaction with cognitive style in the
Regional Inspectorate audit team affect job satisfaction.
Findings: With its leadership, the team leader is also expected to be able to create cooperative interactions
between team members in achieving the stated assignment goals and can also encourage the awareness and
responsibility of members of the Regional Inspectorate (Internal Audit) team in conducting audits.
Practical Implications: The success of an audit assignment depends very much on the personnel
incorporated in an audit team. To optimize the work of the audit team, the role of the team leader is needed.
Originality/Value: The virtue of this research is the input and consideration in carrying out the preparation
of the Regional Inspectorate audit team, and as the role of researchers in developing theories in the field of
accounting and auditing especially relating to the behavior of the Regional Inspectorate.
1 INTRODUCTION
The success of an audit assignment is highly
dependent on the personnel who are members of an
audit team. To optimize the work of the audit team,
the role of the team leader is needed. With his
leadership, the team leader is expected to create
cooperative interactions between team members in
achieving the stated assignment goals and can also
encourage the awareness and responsibility of the
members of the Regional Inspectorate (Internal
Auditor) team in conducting audits.
Effective leadership must be able to provide
direction to the efforts of team members in achieving
the objectives of the assignment. As is known, the
audit team consists of personnel who each have
different individual goals. Without leadership, the
relationship between individual goals and assignment
goals may become out of harmony. As a result, team
members work to achieve their personal goals.
Meanwhile, the purpose of the assignment was
neglected.
Leadership is a process with various ways of
influencing people or groups of people to achieve
common goals. Leadership is closely related to the
work to be completed (task function) and the
cohesiveness of the people they lead (Suwandi,
1999). Thus in an audit assignment, the influence of
team leaders can be seen from the attitude of team
members to the work they do. One such attitude is
the job satisfaction of team members.
Regional autonomy (Law No.22 of 1999) means
that it has transferred most of the authority that was
in the central government to be handed over to the
autonomous region, so that the autonomous regional
government can more quickly respond to the
demands of local communities by following their
capabilities. Because the authority to make policies
(Perda) is fully the authority of autonomous regions,
with regional autonomy the implementation of
general tasks of government and development will be
able to run faster and be of higher quality. The
success of the implementation of regional autonomy
is highly dependent on the ability of regional finance
(PAD), human resources owned by the region, and
the ability of the region to develop all the potential
that exists in the autonomous region. Problems Faced
The implementation of the decentralization and
Nurzaimah, . and Syarif, F.
Model of Leadership Style on Job Satisfaction in Internal Audit Team at Regional Inspectorates with Locus of Control and Cognitive Style as Moderated Variable.
DOI: 10.5220/0009205303690385
In Proceedings of the 2nd Economics and Business International Conference (EBIC 2019) - Economics and Business in Industrial Revolution 4.0, pages 369-385
ISBN: 978-989-758-498-5
Copyright
c
2021 by SCITEPRESS – Science and Technology Publications, Lda. All rights reserved
369

regional autonomy policies which have been running
for nine years, have experienced much progress.
However, it was realized that the journey to achieve
the objectives of the implementation of
decentralization and regional autonomy was still
experiencing many problems. Some of the main
problems felt by the government are, among others,
the aspects of structuring the laws and regulations,
structuring regional government institutions,
enhancing the quality and capacity of local
government officials, processing regional finances,
implementing inter-regional cooperation, structuring
new autonomous (DOB).
Cognitive style is an interesting topic because
common sense can be understood that cognitive style
or personality type is an important factor in
responding to one's leadership style, but research on
that topic is still limited. Some research has been
done, but not directly related to his leadership, such
as Blaylock and Rees (Kinicki, 2001) and Cheng et.
Al (2003).
2 LITERATURE REVIEW
2.1 Regional Autonomy and
Decentralization
The development of public sector accounting,
especially in Indonesia, has been accelerating with a
new era in the implementation of regional autonomy
and fiscal decentralization. One of the MPR Decrees
is MPR Decree Number XV / MPR / 1998
concerning "Implementation of Regional Autonomy;
Regulation, Distribution, and Utilization of
Equitable National Resources and Central and
Regional Financial Balances within the framework
of the Unitary State of the Republic of Indonesia,
constituting the legal basis for the issuance of Law
No. 22 of 1999 concerning Fiscal Balance between
Central and Regional Governments as a basis for the
implementation of regional autonomy.
The second main mission of the law is
decentralization. Decentralization means not only
the transfer of authority from the central government
to the lower government but also the transfer of
some government authority to the private sector in
the form of privatization.
Theoretically, decentralization is expected to
produce two tangible benefits, namely:
1. Encourage increased participation, initiative, and
creativity of the community in development, and
encourage the distribution of development
outcomes (justice) in all regions by utilizing the
resources and potential available in each region.
2. Second, improving the allocation of productive
resources by shifting the role of public decision
making to the lowest level of government that
has the most complete information (Mardiasmo,
2005).
The results of Hutler and Shah's research (1998)
in Mardiasmo (2005) in 80 countries show that
decentralization has a positive correlation with the
quality of government. Since the enactment of
regional autonomy on January 1, 2001, the State of
Indonesia has experienced many significant changes.
The enactment of regional autonomy in 2001 caused
the bureaucracy to spearhead the implementation of
government and the key to the success of regional
development (Erika Revida, 2007). This is stated in
Law No.22/1999 concerning Regional Government
and Law No.25/1999 concerning Financial Balance
between Central and Regional Governments.
However, the implementation of regional autonomy
has entered a new development in 2004. This is
evidenced by the issuance of a new law on regional
autonomy, namely Law No.32/2004 concerning
Regional Government and Law No.33/2004
concerning Financial Balance between the Central
Government and Local Government. With the
passage of these two laws, the two previous laws
namely Law No.22/1999 and Law No.25/1999 have
been deleted.
With the enactment of regional autonomy in
2001, hopes of the government and all levels of
society are greater, that is, they want better
government performance. Because, with the
enactment of regional autonomy, the implementation
of government activities no longer has to be based on
the central government, but rather by each region.
According to Law No.32/2004 (2004: 4), "Regional
autonomy is the right, authority and obligation of
autonomous regions to regulate and manage their
government affairs and the interests of local
communities by statutory regulations". This means
that the regional government has the right to make
decisions and policies according to what is happening
in the region. Thus, the regional government will get
closer to the community because in this case, the
local government will deal directly with the
community as an extension of the government (Erika
Revida, 2007).
Besides, the implementation of regional
autonomy gives rise to decentralization. According to
Law No.32/004 (2004: 5), "Decentralization is the
transfer of governmental authority by the
Government to autonomous regions to regulate and
EBIC 2019 - Economics and Business International Conference 2019
370

administer government affairs within the Unitary
State of the Republic of Indonesia" system. This
transfer of authority results in responsibilities that are
centered on regional government.
But in its implementation still found many
deficiencies. Theories and laws concerning regional
autonomy are not by their implementation. This is
indicated by the existence of cases of corruption,
collusion and nepotism, also known as KKN and
other cases. Even after the implementation of
regional autonomy, the number of cases found has
even increased. This shows the low quality of public
services that causes a decrease in public trust in
government performance.
Research conducted by Dwiyanto, et al (2002)
concluded that the performance of public
bureaucratic services in the region is still low, the
practice of KKN in government and public services
is still ongoing, even with an ever-expanding scale
and actors, people's desire to enjoy efficient,
responsive, accountable public services is far from
reality. Regional autonomy is synonymous with
demands for accountability, good governance, and so
on. A good government is a government that can be
honestly responsible for the trust of its people
(Roesyanto, 2007 1). So that a good Audit Team
Leadership Style Model is needed to improve the
Government's performance.
2.2 Leadership Style
Leadership is one of the most popular topics and can
be seen from any angle it will be watched. From
time to time leadership is a concern for humans.
Some argue that leadership is as old as human
history. Human leadership is needed, because of
certain limitations and advantages in humans. On the
one hand, humans have limited ability to lead, on the
other hand, some people have an excess of ability to
lead. This is where the need for leaders and
leadership arises.
According to Robin (1951) in Toha (2007)
leadership can be interpreted as the exercise of
authority and decision making. Meanwhile,
according to acting, Kemphill (1954) interpreted an
initiative to produce a consistent pattern to find a
solution from a common problem. Furthermore,
George R. Terry formulated that leadership is an
activity to influence people to be directed towards
achieving organizational goals.
The concepts of leadership and power translation
from power have generated an interesting interest to
be discussed throughout the evolutionary growth of
management thinking. The concept of power is very
close to the concept of leadership. Power is a means
for management to influence the behavior of
followers (Stogdill, 1982).
Some leadership styles that influence the
behavior of many of his followers. At any time if
someone is trying to influence the behavior of
others, it has been explained in advance that such an
activity has involved someone in leadership
activities If the leadership occurs in a particular
organization, and the person needs to develop staff
and build a motivational climate that results in a
level of productivity high, then the person is
displaced need to think about his leadership style.
According to Toha (2007) leadership style is the
norm of behavior used by someone when the person
is trying to influence the behavior of others as he
sees it. In this case, the attempt to harmonize
perceptions among people that will influence
behavior with those whose behavior will be
influenced becomes very important.
From the above definition, leadership can be
concluded as the ability possessed by someone to
influence others to work to achieve goals. According
to Maridjo (2001), there are five implications of the
definition of leadership. First, leadership involves
other people, namely subordinates or followers.
With the willingness of subordinates or followers to
receive direction from superiors, group members
have helped strengthen the position of leader and
allow the leadership process to run well, without
people being led, the overall quality of the leader
becomes irrelevant. Second, leadership involves the
distribution of power between leaders and
subordinates or followers. The leader becomes more
powerful than subordinates or followers. Third,
leaders can easily influence subordinates or
followers but subordinates or followers find it
difficult to influence their leaders. Fourth, leaders
can instill values to subordinates, but subordinates
do not easily do the same to their leaders. Fifth,
leadership is the art or process of influencing others.
Because leadership is an art, its effectiveness cannot
be formulated but depends on the situation. In the
audit context, leadership can be practiced at different
levels, reflecting the hierarchical structure in the
audit organization or institution.
2.3 Job Satisfaction
Job satisfaction shows how much subordinates like
their work. Locke (176) in Greenberg and Baron,
2003) defines job satisfaction as an individual's
positive or negative attitude toward work. By
definition, job satisfaction reflects a person's feelings
Model of Leadership Style on Job Satisfaction in Internal Audit Team at Regional Inspectorates with Locus of Control and Cognitive Style
as Moderated Variable
371
towards his job. This can be seen in the subordinate's
positive attitude towards work and everything
encountered in the work environment.
Organizational factors and job satisfaction. One
of the most important aspects of job satisfaction in
organizations is the reward system. Job satisfaction
will increase if subordinates perceive a fair and
appropriate reward system. Further aspects of
organizational policies will increase innate
satisfaction if subordinates participate in
determining policies regarding responsibility and
authority. With this involvement, subordinates will
truly carry out their duties because the policy is a
joint decision. Finally, the quality of supervision.
Subordinates who expect supervision to act fairly
and competently because this will increase their job
satisfaction.
Job factors, spatial planning, and job satisfaction.
Job satisfaction will increase if subordinates are
given mentally challenging jobs, varied jobs, and
pleasant social interactions. Another specific aspect
of the job is the job characteristic model which
includes diverse expertise, job identity, level of
importance of a job, autonomy, and feedback.
Related to workspace layout, aspects that affect job
satisfaction include the number of subordinates in
one room, room lighting, distance between tables,
temperature, noise, and water quality. Finally, the
social environment includes coworkers. Job
satisfaction will increase if co-workers are mutually
helpful and friendly.
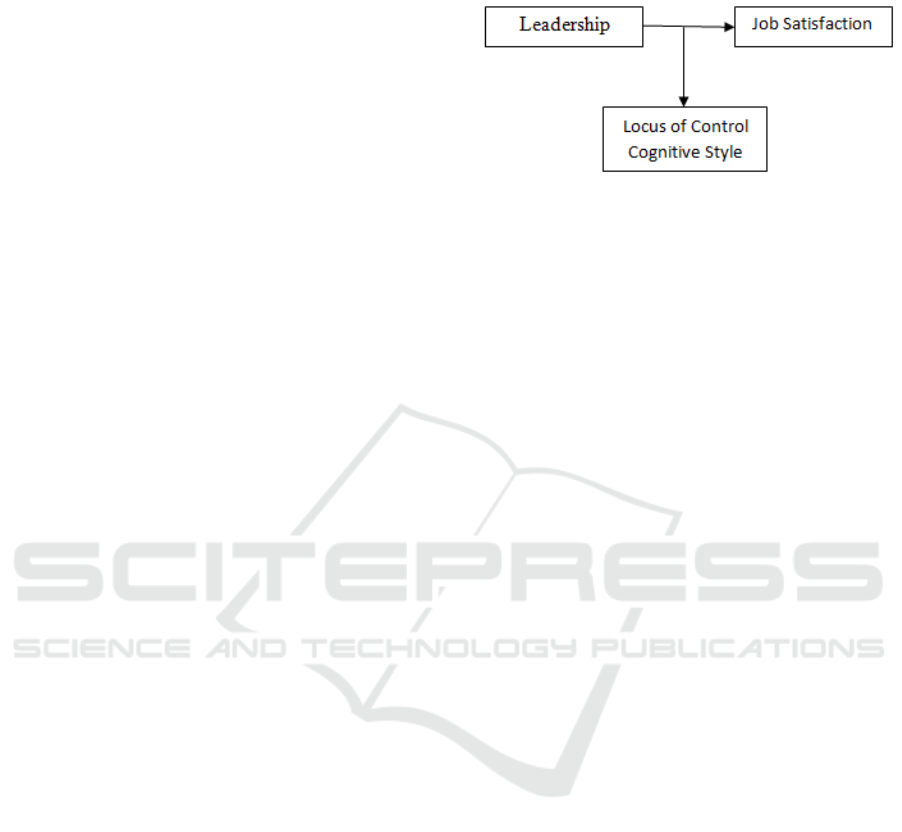
2.4 Framework for Thinking
The proposed research framework is to use the
framework proposed by Evans (1970) and House
(1971). The framework shows that the leadership
style interacts with some optional variables such as
the ability and personality of subordinates, the
structure of tasks and the authorization system in the
organization. Situational variables that the
researchers propose are locus of control and
cognitive style variables. The research framework in
this study is presented in figure 1.
3 RESEARCH MODEL
Figure 1.
3.1 Hypothesis Development
This study aims to examine how leadership styles
and individual characteristics affect job satisfaction
in audit teams. For this reason, the researcher
proposes the following hypotheses:
3.1.1 Effect of Leadership Style on Job
Satisfaction
An effective leader can influence group
performance, satisfaction, and motivation
(Anonymous, 2005). In the Path-Goal model, leaders
are categorized into 4 leadership styles, namely
directives. supportive participative, and oriented
orientation. Several previous studies have shown
that leadership style influences job satisfaction, such
as Filley, et. Al (1976); Schriesheim and DeNisi
(1981, in Luthans 1995); Weed, et al (1976, in Pratt
and Jiambalvo 1982), Pratt and Jiambalvo (1982),
and Keller (1989) Filley et al. (1979) put forward
several studies as follows: first, a study of 7
organizations and found that directive leadership
style interacts positively with job satisfaction and
expectations of subordinates who work on
ambiguous tasks and interacts negatively with job
satisfaction and expectations of subordinates who
work in the clear task; second, a study of 10
different employee samples and found that
supportive leadership styles interact positively with
job satisfaction in subordinates who are in a state of
work pressure, frustration, or unsatisfactory work;
third, research in the manufacturing industry shows
that in jobs that are unstructured and involve
selfishness, employees achieves high satisfaction
with participative leadership style; fourth, a study of
3 different organizations found that subordinates
who carry out unstructured and ambiguous tasks,
will achieve high satisfaction with achievement
leadership style.
Schriesheim and DeNisi (1981) found that the
higher the structure of work carried out by
EBIC 2019 - Economics and Business International Conference 2019
372

subordinates, the higher the relationship between
supportive leadership style and job satisfaction.
Furthermore, the higher the job structure, the lower
the relationship between directive leadership style
and job satisfaction. Weed, et. al (1976) uses task
structure, task ambiguity, and subordinate
authoritarianism as moderating variables. This
research proves that subordinates will achieve higher
job satisfaction with leadership behavior oriented to
social relations.
Jiambalvo and Pratt (1982) examined the
relationship between partner manager behavior with
job satisfaction and the motivation of assistant staff
with the Path-Goal model of consideration and
initiating leadership styles. This research was
conducted on 61 assistant staff from 37 audit teams
on two Big Eight KAPs and hypothesis testing was
performed with ANOVA. The results showed that is
a significant interaction effect between consideration
behavior and task complexity. The consideration
leadership style satisfies the assistant in low task
complexity. While the interaction between initiating
structure behavior and task complexity is not
significant, because initiating structure behavior can
be used in high task complexity.
Research conducted by Keller (1989) uses the
Path-Goal model and the need for clarity of
information as a moderating variable for 477
professional employees from four organizations
which are engaged in research and development.
This study shows that the need for clarity of
information accounts has a moderate effect on the
relationship of initiating structure with job
satisfaction so that the higher the need for clarity
between subordinates, the stronger the relationship
between initiating structure and job satisfaction
Based on literature review and the results of several
previous studies.
This research will try to analyze the influence of
leadership style on job satisfaction in a more specific
scope, namely in the audit team. Therefore, the
satisfaction proposed is as follows:
H1: The leadership model of the audit team
leader significantly influences the job satisfaction
of team members.
3.1.2 The Effect of Leadership Model on Job
Satisfaction with Locus of Control as
Moderating Variables
Locus of control tends to be an internal or external
direction, when internal tend to feel things are more
controlled by the environment outside of themselves.
Several studies have tried to see how the locus of
control interacts with leadership styles in influencing
job satisfaction, such as Janto (1994) and Nugroho
(1996) in Koemiati (1998); Mitchell et al (1975) in
Hughes et al, 199: Hening (1998) and Basri (2000).
Janto (1994) conducted a study to look at locus
of control with a contingency approach to job
satisfaction. This research was conducted at the
banking industry in Yogyakarta using a sample of
middle and line managers. The results of this study
indicate that a participative leadership style will
increase subordinate work extinction when
compared with directive and locus of control
leadership styles do not moderate the influence of
leader behavior with job satisfaction. While
Nugroho (1996) examined the influence of
leadership roles on subordinate satisfaction at PT.
Semen Cibinong by taking a sample of employees at
the level of the Division Head and employees up to
three levels below the Division Head The results of
the study indicate that the role of the leader who
tends to be more participatory will increase
subordinate job satisfaction compared to the
directive level. Besides, this research did not
succeed in proving the influence between the
interaction of leadership roles and locus of control
with subordinate job satisfaction.
Mitchell et. al (1975) found that subordinates
with internal locus of control would feel more job
satisfaction with participative leadership style while
external locus of control with directive leadership
style. Basri (2000) examines the relationship
between leaders and subordinates in service and
manufacturing companies with the Otley and Pierce
(1995) model, namely consideration and initiating
structure as well as locus of control and need
achievement as moderating variables. The results of
his study indicate that there are differences in the
influence of the inclusion of dimensions,
considerations as moderating variables. Influence
between leadership styles. Besides, the structure of
the initiative for job satisfaction has not changed.
Likewise, the locus of control does not affect the
relationship between leadership style and job
satisfaction. However, need achievement influences
the relationship between leadership style and job
satisfaction. At the time of high consideration, there
was no effect on job satisfaction, while at the time of
low consideration job satisfaction differed between
the need for high and low achievement.
Simultaneous locus of control and need achievement
do not influence the influence of leadership style on
job satisfaction.
Several other studies on locus of control
conducted by Hyatt and Prawit (2001) examine the
Model of Leadership Style on Job Satisfaction in Internal Audit Team at Regional Inspectorates with Locus of Control and Cognitive Style
as Moderated Variable
373

suitability between the use of structured audit
technology and locus of control on performance in
Big-six public accounting firms. The results show
that auditors with internal locus of control achieve
high performance in unstructured KAP’s.
Tsui examines the effect of economic pressure
and locus of control on ethical auditors in auditing
conflict situations. This research was conducted on
80 auditors in KAP Big Six and Non-Big Six. The
results showed that the auditor with locus of control
(convinced that the impact was a consequence of
fate) would respond more ethically and
independently if the audit fees received were very
significant related to the microeconomic
consequences of losing clients and lawsuits. While
Brownell (1982) examines the relationship between
budgetary participation and job satisfaction and
performance that is moderated by the locus of
control. This research was conducted on 48 managers
in manufacturing companies. The results show that
the interaction between participation in budgeting
and job satisfaction at the research stage and locus of
control significantly influences performance and job
satisfaction in research and surveys.
Based on the theoretical basis and the various
results of previous studies, the proposed hypothesis
is as follows:
H2: The interaction of leadership style with locus
of control has a significant effect on job
satisfaction of team members.
3.1.3 The Effect of Leadership Style on Job
Satisfaction with Cognitive Style as
Moderating Variables
Cognitive Style is a personality in gathering
information and then making decisions. Jung (192)
in Kreitner and Kinicki, 2001) divides cognitive
style into four categories, namely sensation/thinking
(ST), intuition/thinking (IT), sensation/feeling (SF),
and intuition/feeling (IF). Some research on
cognitive style has been done by Blaylock and Rees,
1984; Gul, 1984 in Kiniciki (2001), Mills (1996);
Cheng et. Al (2003); and Hough and Ogilvie (2005).
Blaylock and Rees (1984) asked cognitive style
for 50 MBA students and the results showed that
different cognitive styles influence the use of
information in strategic planning issues. Besides,
people who have different cognitive styles prefer
certain types of work, such as those who emphasize
intuition prefer a career in psychology, advertising,
teaching, and the arts. Research conducted by Gul
(1984) shows that individuals who make decisions
using the thinking approach have greater motivation
and quality of work than the feeding approach.
Besides, people with sensations will have a higher
level of job satisfaction compared to intuition.
Cheng et. Al. (2003) conducted an experiment
using the MBTI instrument. This study examines
differences in cognitive style on the quality of
performance of dyads decisions for complex
decision making. The results show that decision
quality significantly increases cognitive dyads that
differ beyond sensor dyads homogeneous. Different
quality differences are not observed between
homogeneous intuitive dyads. Mills (1996)
examined the effect of cognitive style on decision
making on the function of internal auditors. This
research was conducted on 51 auditors from two Big
Six Public Accountant Firms using FI-Fixed,
Fimobile, FD-fixed, FD-mobile. The results showed
that FD / FI had no significant effect.
Flowchart to achieve that goal. The leadership
team will have one of the most prominent styles of
the four styles of Path-goal model leadership that is
directive, participative, supportive, and
achievement-oriented. To measure leadership style,
the instrument used is a questionnaire developed by
Timpe (1987).
This questionnaire aims to assess trends in
leadership style on the audit team so it can be seen
whether the team leader is inclined directive,
participative, supportive, or achievement-oriented.
This model has also been used by previous research
Hening (1998), which in his research at the batik
maker company added factor locus of control as a
moderating variable.The Questionnaire used in this
study consisted of 24 questions by using a four-point
Likert scale, those who strongly disagree are given 1
point to strongly agree with 4 points.
Based on the theoretical basis and the various
results of previous studies, the proposed hypothesis
is as follows:
H3: The interaction of leadership style with
cognitive style has a significant effect on job
satisfaction of team members.
3.2 Locus of Control
Locus of control is the tendency of each team
member towards internal or external. If it’s an
internal tendency, a team member relies more on
personal abilities. Therefore, success obtained is the
result of his ability while failure is a result of his
inability. If someone tends to be external, he will
more consider the environment around him is too
difficult to change and everything is more controlled
by the environment outside himself. To measure the
EBIC 2019 - Economics and Business International Conference 2019
374
locus of control, the instrument used in this study is
the Work Locus of Control Scale (WLCS) scale
developed by Spector (1988), taking into account the
WLCS has advantages in terms of measurements
that are more specific to the lotus of control. This
WLCS has also been used by Basri (2000) in his
research which examines the relationship between
superiors and subordinates in service and
manufacturing companies using locus of control as
one of the moderating variables. WLCS consists of
16 questions using a four-point Likert scale.
3.3 Cognitive Style
Cognitive style is the personality of team members
in gathering information and then making decisions.
Team members will have one of the most prominent
personalities of the four personality types, namely
sensation/thinking (ST), intuition/thinking (IT),
sensation/feeling (SF) and intuition/feeling (IF).
To measure cognitive style, the instrument used
was the Myer-Briggs Type Indicator (MBTI) model
developed by Bringgs (1980). Currently, MBTI has
been widely used for various personality studies in
the education and business environment (Kreitner
and Kinicki, 2001). The MBT questionnaire
consisted of 16 questions using the answer choices.
3.4 Job Satisfaction
Job satisfaction is a condition where team members
get a level of satisfaction in the implementation of
the assignment, such as the existence of awards,
relationships among team members, and supervision.
To measure work satisfaction, the instrument
used was the Minnesota Satisfaction Questionnaire
(MSQ) model developed by Weiss et. al (1967). The
Questionnaire material covers 7 aspects, namely
aspects of the cost of assignment, self-development
for a career, leadership style, leader policy,
relationships with colleagues, work environment and
loyalty. The questionnaire consisted of 21 questions
using a four-point Likert scale.
4 DATA ANALYSIS AND
DISCUSSION
4.1 General Description of the
Respondent
The data collection process was carried out from the
end of July to the beginning of August 2010. Data
collection can be done by distributing questionnaires
to respondents directly or collected through certain
people.
The questionnaire was distributed to Regional
Inspectorates (Internal Auditors) to be filled out and
returned directly. Questionnaires were distributed to
the Inspectorate District. Langkat, Deli Serdang, and
Serdang Bedagai were 100 questionnaires.
Questionnaires were distributed to Kab. A total of 30
questionnaires, Deli Serdang 35, and Serdang
Bedagai as many as 35 questionnaires. Of the 100
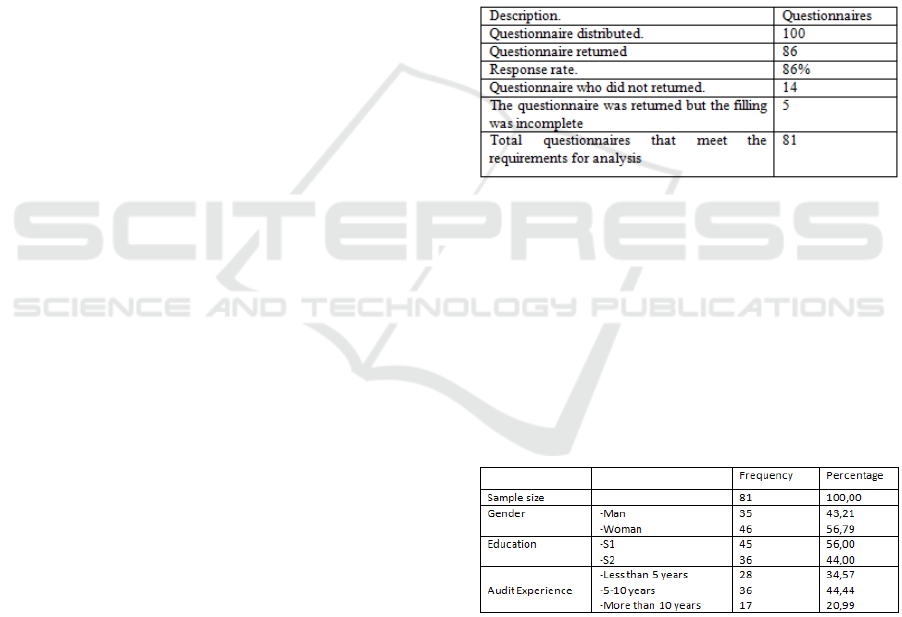
questionnaires distributed, 86 were returned (86%),
and only 81 questionnaires could be processed.
The following are the results of the assessment
of questionnaire distribution.
Table 4.1. Questionnaire distribution results
Source: primary data processed
Table 4.2. Review the general description of
respondents who are the subjects in this study.
Profile of respondents consisted of gender,
education, position, auditor functional, and audit
experience. In general, respondents were dominated
by women (56.79%) with S1 (56%) and S2
education (44%), and audit experience ranged from
5-10 years to 44.44%.
Table 4.2. Review the General Description of Respondents
4.2 Validity Test and Reliability
This research use 4 questionnaire which has been
standardized. the composition questionnaire is :
1. Questionnaire of leadership style (Timple) *24
question
2. Locus of control questionnaire (Spector) *16
question
Model of Leadership Style on Job Satisfaction in Internal Audit Team at Regional Inspectorates with Locus of Control and Cognitive Style
as Moderated Variable
375
3. Questionnaier of cognitive style (Myers briggs
type indicator) *16 question
4. Questionnaire of job satisfaction (Minnesota
satisfaction questionnaire) *20 question
Testing the validity of the question items is done
using the Pearson Product Moment correlation
method. Processing is done by correlating the scores
obtained for each question item with the item scores.
The total item score is the value obtained from the
sum of the question items. Based on SPSS output
version 15 the value of the correlation coefficient (r)
can be seen from each item against the total score.
To test whether the correlation is significant or not,
the results of the r count test can be compared r table
with a significance level of at least 95% From the r
table data, N = 81 with a level of 95%, then the r
table is 0.2159. Or it can be seen from the SPSS
output which automatically gives a two-star (**) if
the correlation coefficient is significant at the 1%
level and one star (*) if the correlation coefficient is
significant at the 5% level.
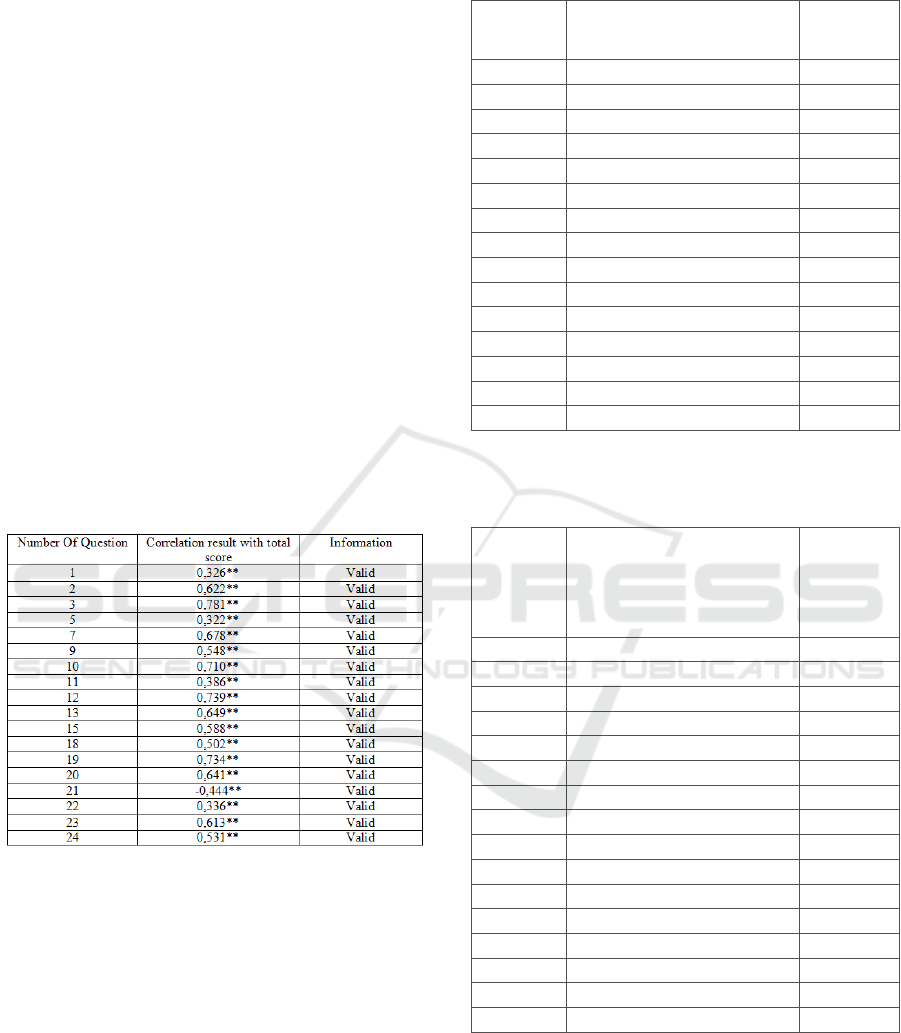
Table 4.3. Validity Leadership Style Test Result
The results of testing of leadership style items
indicate that there are 19 significant items
(considered valid), while 5 items (item number 6, 8,
14, 16, and17) are not significant (invalid) The five
invalid items are excluded from the original data and
then the correlation test is recalculated. The results
show that the question items are valid, but there is
still 1 item Invalid questions, initemnumber 4. After
being recalculated by issuingitemnumber 4, the
remaining question items all become valid. The test
results for the leadership style items are presented in
Table 4.3.
Table 4.4. Validity test results – Locus of Control
No.
Question
Correlation results with total
scores
Information
1 0,332** Vali
d
2 0,252** Vali
d
3 0,221** Vali
d
4 0,240** Vali
d
5 0,286** Vali
d
6 0,427** Vali
d
7 0,518** Vali
d
8 0,574** Vali
d
9 0,355** Vali
d
10 0,586** Vali
d
11 0,439** Vali
d
12 0,501** Vali
d
13 0,269** Vali
d
14 0,489** Vali
d
16 0,481** Vali
d
Source of data processed in 2010
**Significant correlation at the level of 1% (2- tailed)
Table 4.5. Validity test results - Work Decisions
No.
Question
Correlation results with total
scores
Information
1 0,392** Vali
d
2 0,309** Vali
d
3 0,403** Vali
d
4 0,592** Vali
d
6 0,666** Vali
d
7 0,574** Vali
d
8 0,573** Vali
d
9 0,641** Vali
d
12 0,375** Vali
d
13 0,719** Vali
d
14 0,644** Vali
d
15 0,627** Vali
d
16 0,605** Vali
d
17 0,321** Vali
d
18 0,659** Vali
d
20 0,496** Vali
d
The results of tests on work satisfaction items
indicate that there are 16 significant items (which
are considered valid) and the remaining 4 items
(items number 5, 10, 11, and 19) not significant
(invalid). The invalid items are excluded from the
original data and then the correlation test is
recalculated. The result is the rest of the items all
EBIC 2019 - Economics and Business International Conference 2019
376
become valid. The test results for the job satisfaction
items are presented in Table 4.5.
Table 4.6. Summary of Reliability Test Results
Variable name Cronbach Alpha Criteria
Leadership Style 0,8221 Good
Locus of Control 0,6182 Acceptable
Job satisfaction 0,8294 Good
Data source: Data processed (2010)
After the questionnaire as a measuring
instrument proved to be valid, testing was then
carried out on the reliability of the question items
using the Cronbach alpha technique. The results of
the calculation of the reliability performed on item
questions in each variable are job satisfaction (Y),
leadership style (x9 and locus of control (X2)), with
the help of the SPSS version 15 program obtained
the following results: Cronbach alpha for leadership
style questionnaire for 0, 8221, locus of control was
0.6182 and job satisfaction was 0.8294. Referring to
Sckaran (2003), leadership style reliability was
categorized as good, locus of control reliability was
categorized as acceptable and job satisfaction
reliability was categorized well Based on the results
of the reliability test, it could be explained that the
questionnaire used to measure all the variables used
in this study is reliable even though it has different
reliability criteria Summary of reliability testing is
presented in table 4.6.
The results of the questionnaire about cognitive
style were not tested for data quality. The
questionnaire was adopted directly from Kreitner
and Kinicki (2001) without developing questions.
The questionnaire was designed not on a Likert
scale, but each number consisted of 2 question items
A or B, with a score of 1 and 0, so that it was not
possible to conduct a data quality test as was done in
the leadership style. locus of control, and job
satisfaction. Full test results can be seen in Appendix
2 for the validity test and Attachment 3 for the
reliability test.
4.3 Multicollinearity
Interpretation of the multiple regression equation
implicitly depends on the assumption that the
independent variables in the equation are not
correlated with each other. Regression coefficients
are usually interpreted as a measure of changes in
the dependent variable if one of the independent
variables rises by one unit and all other independent
variables are considered fixed. However, this
interpretation is incorrect if there is
multicollinearity, i.e.
Linear relationship between independent
variables (Chatterjee and Price, 1977). To detect
multicollinearity, this study uses correlation matrix
analysis. Regression models are declared free of
multicollinearity if there is no correlation value
above 0.90.
Table 4.7. Coefficient Correlations (a)
ACH DIR SUPP PART
Correlations ACH
DIR
SUPP
PART
1,000
-,262
-,388
-,299
-,262
1,000
-,316
-,288
-,388
-,316
1,000
-,538
-,299
-,288
-,538
1,000
a. Dependent Variable: SATISFIED
The test results show that only supporting
variables that have a high enough correlation with
participatory with a correlation level of -0,538 or
around 53.80%. Because this correlation is still
below 95%, this means there is no multicollinearity
between variables in the Regression Model I.
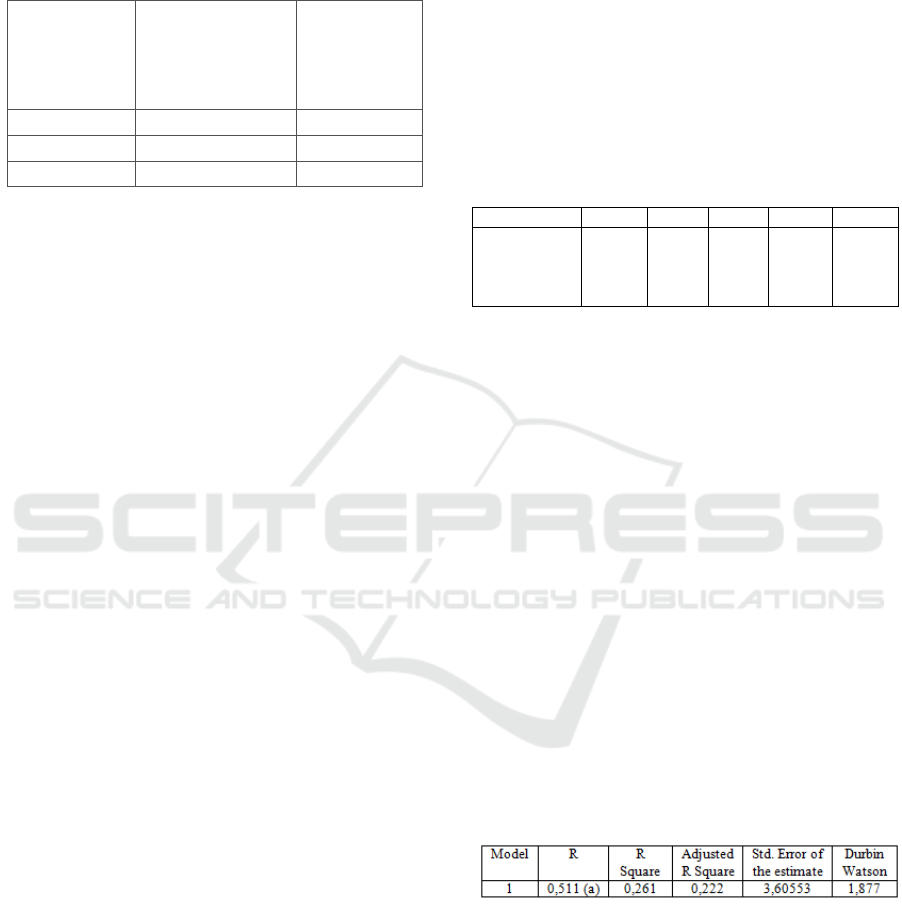
4.4 Autocorrelation
An autocorrelation test is performed to find out
whether the regression model was found a
correlation between residuals (confounding errors) at
different observations of time or individuals.
Generally, many cases of autocorrelation occur in
time series. To detect the presence of
autocorrelation, this study used the Durbin-Watson
(DW) test. The regression model is declared free
from autocorrelation if the DW number is between
(du) and (4-du) in the Durbin-Watson table.
Table 4.8. Model Summary (b)
a. Predictors: (Constant), ACH, DIR, SUPP, PART
b. Dependent Variable: SATISFIED
With the number of samples = 81 and the
number of variables = 4, the values of du and dl in
each table are du = 1,743 and dl = 1,534, so 4-dl =
2,466 and 4-du = 2m257. The test results show the
Durbin-Watson (DW) rate of 1.877. The number is
between 1,743 (du) and 2,257 (4-du). This means
that there is no autocorrelation in the Regression
Model I.
Model of Leadership Style on Job Satisfaction in Internal Audit Team at Regional Inspectorates with Locus of Control and Cognitive Style
as Moderated Variable
377
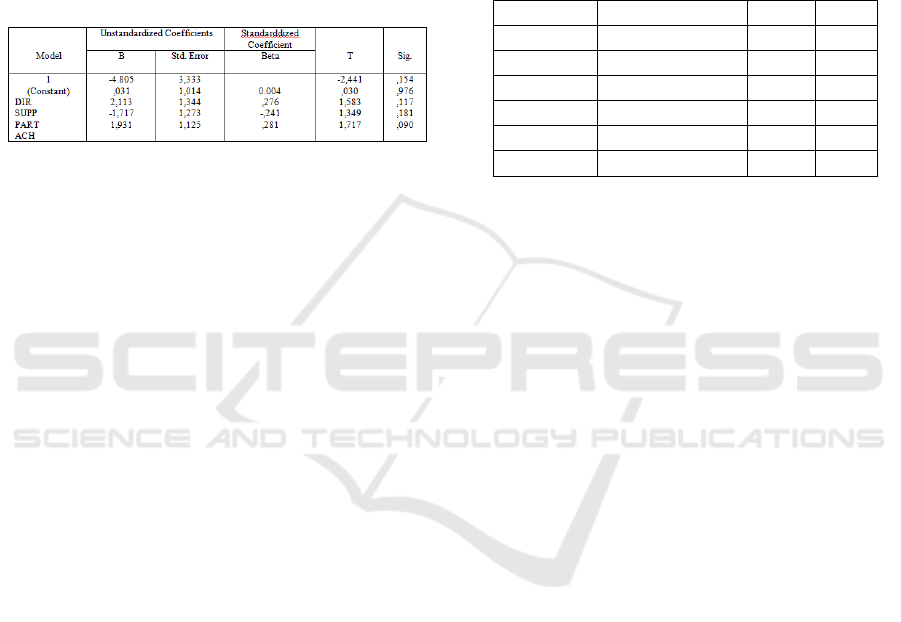
4.5 Heteroscedasticity
Heteroscedasticity test is performed to find out
whether absolute residual variation is the same or
not the same for all observations. To detect
heteroscedasticity, this study tests the Glejster test.
The regression model is declared free of
heteroscedasticity if the independent variable is not
statistically significant affecting the dependent
variable.
Table 4.9. Coefficients
a
The test results show that there are no
statistically significant independent variables that
affect the dependent variable absolute value. This
can be seen from the significance level above 0.50.
This means that the regression model does not
contain heteroscedasticity.
4.6 Normality Test
Normality test is done to test whether the residuals
in the regression model have a normal distribution.
To test normality, this study uses the Kolmogorov-
Smirnov (K-S) non-parametric statistical test. If the
significant value in the one-sample K-S test table is
above 0.05, this shows that the residual data has a
normal distribution.
The test results show the value of Kolmogorov-
Smirnov is equal to 0.828 at the significant 0.499.
This is good enough to estimate variations in team
member satisfaction caused by the leadership style
of the team leader in an audit team.
5 HYPOTHESIS TESTING
This research will test the four hypotheses that have
been proposed in Chapter II previously by using the
regression model that was compiled in Chapter III.
Testing this hypothesis using SPSS version 15.
5.1 Hypothesis Testing 1
The first hypothesis aims to test whether the
leadership style of the regional inspectorate team
leader significantly influences the job satisfaction of
team members. The data used in testing the first
hypothesis are Leadership Style and Job Satisfaction
data, as presented in Appendix 4. Leadership styles
in Path-Goal theory, namely directive, supportive,
participative, and achievement-oriented. It aims to
examine the effect of each type of leadership style
on job satisfaction. Thus, the regression model I
compiled in Chapter II. The following has
accommodated the objectives of testing.
Table 5.1. SPSS Output-Regression Model 1
Variable Coefficient Value T Sig.
(1) (2) (3) (4)
A Constant 23,951 4,525 0,000
GP direct 0,560 -0,348 0,729
GP support -0,181 -0,085 0,932
GP particip 3,031 1,499 0,138
GP achieve 3,596 2,014 0,048
Based on the SPSS output in the table above,
Regression Model I is as follows:
PUAS = 23,915 + 0.560GP Direct + 0.181GP
Supported + 3.031GP Particip + 3,596GP
Achievement + E
5.1.1 Goodness of Fit Test
1) Determination coefficient
The value of r2 = 0.261 indicates that all four style
type variables leadership can explain 26.1% of the
variations in job satisfaction, while the rest is equal
73.90% is explained by other factors outside the
model.
2) Overall Parameter Significance Test
The F test shows that the F value of 6.719 is
significant at p = 0,000,means the influence of the
four leadership styles together on job satisfaction
was statistically significant at a = 5% (0,000 <0.05).
3) Significant Parameters Individually Test
The t-test showed that only the GPachieve variable
had a statistically significant effect at a = 5% (0.024
<0.05), while the other leadership style variables,
namely GPdirect, GPparticip, and GPachieve, had
no statistically significant effect at a = 5%. Positive
signs (+) in GPdirect, GP support and GP participle
indicate that the three types of leadership styles are
has a positive effect on job satisfaction, even though
only GPachieve has a significant effect, while
GPdirect and GPparticip have no significant effect.
The negative sign (-) in GP support shows that this
type of leadership style has a negative influence on
job satisfaction.
EBIC 2019 - Economics and Business International Conference 2019
378
Based on the description above, it can be
concluded that overall, the style leadership
influences job satisfaction, but individually, only the
type of achievement-oriented leadership style
(GPachieve) is an influential significant effect on job
satisfaction of team members. Accordingly, this test
empirically reject the null hypothesis and accept the
alternative hypothesis (H1).
5.2 Hypothesis Testing 2
The second hypothesis aims to test whether the
interaction between leadership styles with Locus
control has a significant effect on job satisfaction.
The data used in testing the second hypothesis are
Leadership Style data, locus of control, Interaction
between Leadership Style with locus of control, and
job satisfaction, and in Appendix 5. Leadership
styles are classified into directive, supportive,
participative, and achievement-oriented leadership
styles, while the locus of control classified into 3
categories, namely external locus of control,
balanced external and internal locus of control, and
internal locus of control. It aims to examine the
effect of the interaction of the four types of
leadership styles with each locus of control category
on job satisfaction. Accordingly, the Regression
Model II which has been prepared in the following
Chapter IIl has accommodated the objectives of
testing.
PUAS = a+ B1.1Gpdirect + B1.2GPsupport +
B1.3Gpparticip + B14Gpachieve + B2LOC + B3.1
GPdirectLOC + B3.2GPsupportLOC +
B3.4GPparticipLOC + B3.4GPachieveLOC
A summary of the output is presented in table 4.1,
below:
Table 5.2. Summary of SPSS Output-Regression Model II
Variabel Coefisient Value T Si
g
(
1
)
(
2
)
(
3
)
(
4
)
A Constant 69,315 2,450 0,013
GP
direct
-19,519 -2,405 0,019
GP
support
-7,160 -0,666 0,507
GP
particip
4,017 0,384 0,702
GP
achieve
11,258 1,239 0,220
LOC -17,840 -1,628 0,108
GP
direct
LOC 8,476 2,494 0,015
GP
suppor
tLOC 2,438 0,556 0,580
GP
particip
LOC -0,207 -0,050 0,960
4GP
archieve
LOC -3,350 -0,923 0,359
R
2
= 0,338 F = 4,027
Adj. R
2
= 0,258 p = 0,000
PUAS = 69,315-19,519GPdireect –
7,160GPsupport+ 4,017GPparticip +
11,258GParchieve – 17,840LOC +
8,476GP(direct_LOC) + 2,438GP(support_LOC)
– 0,207GP(particip_LOC) – 3,350GP(achv_LOC)
+ £
5.2.1 Goodness of Fit Test
1) Coefficient of Determination
The difference with the regression model I, in this
regression model II added locus of control variables
and leadership style interaction variables with locus
of control. it can be seen that the R2 value of the
regression model II shows a figure of 0.338, which
means that the leadership style, locus of control, and
interaction between leadership style and locus of
control can explain 33.80% of the variations in job
satisfaction, while the rest is 66, 20% is explained by
other factors outside the model. When compared
with R2 of the regression model I of 0.261, it
appears that the value of R2 of regression model II is
greater. This shows that the addition of locus of
control and leadership style interaction with locus of
control can increase R2, which means that these
variables are also factors that influence job
satisfaction.
To see whether the addition of these variables
has a significant effect or not, R2 must be compared
with adjusted R2. If the addition of the independent
variable is a good predictor, it will cause a good
variant and in turn adjusted R2 increases (Kuncoro,
2001). It can be seen that the adjusted R2 of the
regression model II shows the number 0.254. This
figure increased compared to the Regression I model
which only showed an adjusted R2 of 0.222. This
increase in adjusted R2 shows that of the
independent variables added some variables have a
significant effect on job satisfaction. Which
variables that have a significant effect will be shown
through the t-test.
2) Test the overall significance of the parameters
The F test shows that the F value of 4.027 is
significant at 0,000, meaning that the influence of
the four leadership styles, locus of control, and
interaction between the four types of leadership style
with locus of control together on job satisfaction was
stated to be statistically significant at α = 5% (0,000
<0.05).
3) Test the parameter significance individually
The t-test showed that all coefficients of the
independent variable had a statistically significant
Model of Leadership Style on Job Satisfaction in Internal Audit Team at Regional Inspectorates with Locus of Control and Cognitive Style
as Moderated Variable
379
effect on α = 5% (0.024 <0.05), namely the GP
direct variable (Gpdirect leadership style directive
leadership style) GpdirectLOC (interaction of
directive leadership style with locus of control).
Other leadership style variables namely, Gpsuport,
GPparticip, GPachieve with locus of control, and
interactions between Gpsuport, GPparticip, and
GPachieve with locus of control have no statistically
significant effect at α = 5%, although the Gpdirect
and GpdirectLOC variables have a significant effect,
but both These variables have different directions,
GPdirect variable which has a sign (-) means that
directive leadership style has a negative effect on job
satisfaction, while GPdirectLOC variable which has
a sign (+) means the interaction between directive
leadership style and locus of control has a positive
effect on job satisfaction.
If an interaction variables have coefficients that
have a significant effect, then these variables are
moderating variables (Ghozali, 2005) GPdirectLOC
variables are interactions between leadership style
directory with locus of control and t-test shows that
the variable has a statistically significant effect. This
means that the locus of control variable is a
moderating variable. Thus the locus of control can
moderate the directive leadership style in
influencing job satisfaction. Based on testing the
goodness of fit as described above, it can be
concluded that overall leadership style, locus of
control, and interaction between leadership style and
locus of control have an influence on job
satisfaction, but individually, only the type of
directive leadership style with locus of control which
has a significant effect on job satisfaction of team
members. The GPaeaLOC variable coefficient is
statistically significant, this means that locus of
control can moderate the directive leadership style in
influencing job satisfaction. Thus, this test
empirically rejects the null hypothesis and accepts
an alternative hypothesis (H2).
5.3 Testing Hypothesis 3
The third hypothesis aims to examine whether the
interaction between leadership style and cognitive
style significantly influences job satisfaction. The
data used in testing the third hypothesis is leadership
style data. Cognitive Style, the interaction between
leadership style and cognitive style, and job
satisfaction, as presented in Appendix 6. Leadership
style data are classified into directive, supportive,
participative, and achievement-oriented leadership
style, while cognitive style data are classified into 4
categoriesthat is sensation thinking, ignition
thinking, sensation feeling and intuition feeling. This
aims to examine the effect of the interaction of the
four types of leadership styles with each category of
cognitive style on job satisfaction.
Table 5.3. Summary of SPSS Output-Regression Model
III
Variable Value Coefficient T Sig.
(
1
)
(
2
)
(
3
)
(
4
)
20,879 1,644 0,105
-3,488 -0,987 0,327
1,484 0,311 0,757
4,908 1,119 0,267
4,167 1,097 0,276
0,270 0,045 0,965
2,839 1,416 0,161
-0,720 -0,350 0,728
-0,850 -0,374 0,710
-0,759 -0,339 0,736
R² = 0,319 F= 3,689
Adj. R² = 0,232 p = 0,001
Based on the output in the table above, the
Regression Model III becomes as follows:
SATISFIED= A review of the regression model
based on table 5.3 shows the following things.
5.3.1 Goodness of Fit Test
1) Difference Determination
Coefficient with Regression Model I, in this
Regression Model II I added a variable cognitive
style and leadership style interaction variables with
cognitive style. It appears that the R2 value of the III
Regression Model shows a figure of 0.319, which
means the variable type of leadership style,
cognitive style, and interaction between types of
leadership style with cognitive style can explain as
much as 31.90% of the variations in satisfaction
work, while the remaining 68.10% is explained by
factors that are other outside the model. When
compared with R Regression Model I of 0.261, it
appears that the value of R2 Model Regression II is
greater. This shows that the addition of cognitive
style variables and leadership style interaction
variables with cognitive style can increase the
number R, which means these variables are also
factors that influence job satisfaction.
It can also be seen that the adjusted R 2
Regression Model III shows the number 0,232. This
figure is increasing compared to Regression Model I
which only shows the adjusted R number of 0.222.
Increased adjusted number This R shows that the
added variables are present variables that have a
EBIC 2019 - Economics and Business International Conference 2019
380

significant effect on job satisfaction. Any variable
which has a significant effect will be shown through
t-test.
2) Overall Parameter Significance
The F test shows that the F value of 3.689 is
significant at p-0.001, meaning the influence of the
four leadership styles, cognitive styles, and
interactions between the four types of leadership
style with cognitive style together on job satisfaction
was statistically significant at a-5% (0,000 <0.05).
3) Test the Significance of Parameters
Individually
Test shows that all coefficients of independent
variables do not statistically significant effect at a-
5% (0.024 <0.05). And GP (LOC _support) shows
that the three independent variables have a positive
effect on job satisfaction, but the effect is not
statistically significant. As for the negative sign (-)
in GPdirect, GP (supp_COG), GP (Part_ Cog) and
GP (Achv_coG) have a negative effect on
satisfaction employment, although the effect is not
statistically significant.
Based on testing the goodness of fit as described
above, it can be concluded that overall leadership
style, cognitive style, and interaction between
leadership style with cognitive style has an influence
significant on job satisfaction, but individually there
are no variables significant. Thus, this test was
empirically unsuccessful reject the null hypothesis.
This means the interaction between leadership styles
with cognitive style possessed by team members has
no significant effect on job satisfaction of team
members.
6 DISCUSSION OF HYPOTHESIS
TESTING RESULTS
6.1 The Effect of Leadership Style on
Job Satisfaction
The results of the regression test showed that
leadership style had an effect on job satisfaction
with an R2 of 0.261. This means style leadership can
explain 26.10% of variations in job satisfaction. This
test results support the first hypothesis which states
that the force leadership effect on job satisfaction.
The results of the regression test also showed
that of the four leadership styles in the Path-Goal
model, only the achievement-oriented leadership
style significantly influence job satisfaction. The
results of this test can be interpreted that team
members will feel job satisfaction if team leaders
apply an achievement-oriented leadership style in
the team an audit.
Compared to the other three types of leadership
styles, achievement-oriented leadership styles are
more flexible to various situational factors.
According to Wofford and Srinivasan (1983),
achievement-oriented leadership style is suitable
applied to the conditions: (1) the characteristics of
the task structured and unstructured ; (2)
subordinates who practice or are not trained; (3P
broad or limited formal authority; and (4) work
teams with networks Strong social and achievement-
oriented organizational culture. In something, an
audit team characterizes these conditions, for
example in a division of tasks. The division of tasks
is adjusted to the audit objectives.
Each team member is expected to complete the
work for which they are responsible. the role of the
team leader here is to provide challenges in
achieving goals to team members and show
confidence that they can achieve that. Team leaders
can trust that they can achieve these goals. team
leaders can delegate tasks and allow team members
to work and make their own decisions. in completing
work, the team leader encourages independence and
expects team members to like the work for which
they are responsible. team leaders can help solve
work problems by providing examples of solutions.
Auditing requires flexibility, adapted to
conditions, so that what is needed by team members
is clear goals, clear goals, discussions and inputs that
can help solve an achievable oriented problem that
positively influences team member job satisfaction.
thus, the results of this study consistently support the
results of previous studies which stated that
leadership style has an influence on work, led by
Filley, et. al. (1976); Schriesheim and Denisi (1981);
weed, et.al. (1976); Pratt and Jiambalvo (1982); and
Keller (1989).
6.2 The Influence of the Interaction of
Leadership Style with Locus of
Control on Job Satisfaction
Regression test results showed that the interaction
between leadership style and locus of control had a
significant positive effect on job satisfaction with a
coefficient of R2 of 0.254. this means that the
interaction of leadership style with locus of control
can explain 25.40% of job satisfaction variations. the
results of this test support the second hypothesis
which states that the interaction between leadership
Model of Leadership Style on Job Satisfaction in Internal Audit Team at Regional Inspectorates with Locus of Control and Cognitive Style
as Moderated Variable
381

style and locus of control affects job satisfaction
Regression test results also showed that the
interaction variables between directive leadership
style and locus of control had a significant effect on
job satisfaction. this means that the locus of control
attribute is a moderating variable so that by entering
the locus of control attribute will strengthen the
influence of the directive leadership style on job
satisfaction.
The directive leadership style in the Path-Goal
model is best applied to situations: (1) (2) unclear
task objectives; (3) limited formal authority; (4)
work teams with strong social networks; and (5) the
characteristics of subordinates who do not have
adequate expertise (Wofford and Srinivasan, 1983).
The characteristics of the audit team and the
personnel in the audit team characterize some of
these studies, so it is reasonable that the interaction
of directive leadership styles with locus of control
has a significant effect on job satisfaction of team
members. During an audit assignment, team
members are faced with unstructured and complex
work, audits programs that are not all applicable in
the field, and the different expertise and experience
of team members. While team members provide
space to do creativity within a framework of
deepening and overcoming problems that occur, but
because of such problems, it is very possible if the
team members do not discuss how to do effective
work. Supporting, they only have low expectations
for the success of the audit. At times like this, team
members ask for directions and clear directions. The
direction of the leader with the leadership style by
the existing situation. The team leader can help
improve the work requested by providing
instructions and explanations for the job.
In this case, the team leader makes clear the path
to achieving the assignment goals carried out by
team members will achieve the achievements
expected by team members (goal path). Thus, team
members will increase their expectations and
subsequently increase their efforts at work. With the
locus of control's characteristics, the behavior of
team members who have an internal locus of control
will be different from the external in addressing
situational factors with a directive leadership style.
Team Members with internal locus of control will
tend to behave proactively because they have
confidence that audit assignments are a
responsibility answer. They will immediately follow
the path given by the team leader. Whereas team
members with external locus of control will tend to
be passive because they believe that the assignment
is luck or chance. Therefore, the team leader with
style directive leadership will encourage team
members who have a locus of external control by
giving them more specific instructions can easily run
a job.
6.3 Effects of Leadership Style
Interaction with Cognitive Style on
Job Satisfaction
Regression test results indicate that the interaction
between leadership styles and cognitive style does
not affect job satisfaction. Significance test The
individual also shows that the interaction variable is
not significant statistically. This means cognitive
style is not a variable moderating, so cognitive style
cannot strengthen the influence of style leadership
on job satisfaction. Thus, this study does not
managed to support the third hypothesis which states
that the interaction between leadership style and
cognitive style affect job satisfaction.
Other studies as a comparison of these results are
difficult to obtain, because indeed research on
cognitive style in responding to leadership style
someone is still very limited. Some research on
cognitive style has been done, but not directly
related to leadership, as research conducted by
Hough and Ogilvie (2005). These studies link more
between cognitive style with the process of
gathering information for decision making.
6.4 Things That Need Attention
In addition to the results of the partial regression test
as stated in point 5.1. to 5.3, a thorough analysis of
the four results of the regression test shows some
things that need attention, namely; (1) value R ^ 2 of
the regression equation relatively low; (2) leadership
style is only able to explain 20% of variations in
satisfaction, and (3) cognitive style is not a variable
individual moderating, but must be together with the
locus of control.
First, the four regression models show relatively
low R values. Tatas how the 20% competition ends.
Statistically, 'R' wears a relatively low mask. The
bigchange in the data in-some studies show that this
study collects, that is, circular data. Dangerous level
investigation commands for variables analyzed in
the shortcoming the data obtaine is data minimum.
It's relatively low, but it's either large or rather low
depending on the variety of server data attention.
The decline in this study is relatively low
because of the change in sizeone's appearance. Field
survey of variables being investigated. There are
most differences.There's an auditor on the conveyor.
EBIC 2019 - Economics and Business International Conference 2019
382
Different educational and audit experiences are also
different. And there's a look order as a predictor
dynamic. We replaced the audit team instead of the
leader team. I think the situation is hulk because of
the Change in Leadership20s. There is a significant
difference in the level of satisfaction of the team
members.
Second, with R? only with a 20% price change
in Leadership Potential and Interaction Adjustment
in their 20s.Cognitive style can only explain about
20% of the variation in job satisfaction of team
members, while the remaining 80% is explained by
other factors outside the model. This is because
leadership style is not the only factor affecting job
satisfaction of team members in the inspectorate
team. Many other factors influence job satisfaction
of team members in the inspectorate team, but have
not been included in the model, such as a fair reward
system in accordance with team members, the
quality of implementation of supervision carried out
by the person in charge, and supporting facilities in
assignments (such as space work and computer).
These factors are not included in the model because
this study does not aim to identify the factors that
influence job satisfaction of inspectorate team
members. The focus of this research is to analyze the
extent of leadership style and its interaction with
individual characteristics (locus of control and
cognitive style) that affect the satisfaction of team
members.
Third, the results of regression tests in
Regression Model II show that locus of control is a
moderating variable, while the results of regression
tests in Model l show that cognitive style is not a
moderating variable, but the results of regression
tests in Regression Model IV show that the locus of
control and cognitive style together are moderating
variables. It can be seen that the locus of control can
be a moderating variable both individually and
together with cognitive style, whereas cognitive
style cannot be a stand-alone moderating variable,
but must be together with the locus of control.
This, cognitive style is a personality attribute
that cannot stand alone in strengthening the
influence of leadership style on job satisfaction, but
must be together with other personality attributes,
which in this study are locus of control To ensure
that cognitive style attributes cannot be variables
moderating individually, the researcher will
reexamine cognitive style variables with residual
analysis. Residual analysis aims to examine the
effect of deviations (deviations) from an equation
model. The objective of analysis is the lack of fit
resulting from the deviation of the linear relationship
between the independent variables. Lack of fit is
indicated by the residual value in the regression
equation.
COG a b1PUAS + e
If the coefficient value of b1 job satisfaction is
negative and significant, this indicates that the
cognitive style variable is a moderating variable.
Table 6.1. Coefficients
Model Unstandardized
Coefficients
Standardized
Coefficient
BStd.erro
r
Beta t Si
g
(Constant)
PUAS
,629
,006
,521
,011
0,060
1,206
,536
,231
,593
This test ensures that the cognitive style attribute
is not a moderating factor, so it cannot strengthen or
weaken the influence of the leadership style on team
members' job satisfaction. This happens because of
the lack of fit between leadership style and cognitive
style so that cognitive style variables cannot be used
as moderating variables. Thus, the results of this test
support the results of testing in hypothesis 3 which
states that the interaction between leadership style
and cognitive style is significant. Job satisfaction
does not affect.
7 CONCLUSIONS AND
SUGGESTIONS
7.1 Conclusion
Hypothesis testing results show the following:
1. The achievement leadership style shows a
statistically significant effect. This means that
the achievement leadership style influences job
satisfaction. Thus, when not considering the
personality attributes of team members, the
application of style, achievement leadership in
the inspectorate team will increase job
satisfaction felt by team members. These results
support the first hypothesis which states that
leadership style influences job satisfaction.
2. The interaction of directive leadership styles with
locus of control shows a statistically significant
effect. This means that locus of control is a
moderating factor, so that it can strengthen the
influence of force directive leadership to team
members' job satisfaction. The results of this test
support the second hypothesis which states that
the interaction between leadership style and
locus of control affects job satisfaction.
Model of Leadership Style on Job Satisfaction in Internal Audit Team at Regional Inspectorates with Locus of Control and Cognitive Style
as Moderated Variable
383

3. The interaction of leadership style with cognitive
style does not show a statistically significant
effect. This means cognitive style isn't is a
moderating factor, so it cannot strengthen or
weaken the influence of leadership style on team
members' job satisfaction. In other words, the
influence of leadership style on team member job
satisfaction does not depend on the cognitive
style of team members. This result does not
support the third hypothesis which states that the
interaction between leadership style and
cognitive style influences job satisfaction.
7.2 Suggestion
When not considering aspects of locus of control
and cognitive style from team members, this
research successfully found that leadership style
achievement has a positive effect on job satisfaction
of team members in the inspectorate team. By
providing clear goals accompanied by a delegation
of tasks and the greater the responsibility to the team
members, the job satisfaction felt by the team
members is also higher. Whereas when considering
aspects of the locus of control and cognitive style of
the members of this research team managed to find
that the directive leadership style had a positive
effect on job satisfaction of team members in the
inspectorate team.
So that team member job satisfaction is achieved
so that work motivation also increases, the effective
leadership style is a combination of directive and
achievement leadership styles. The directive
leadership style provides clear instructions and
direction, while the achievement leadership style
encourages team members to be independent in each
assignment. One example of applying this
combination of leadership styles is to make the audit
program as concrete as possible, but gives the team
members the freedom to be creative in deepening
and expanding in the field.
The results of this study are expected to be input
for the Regional Inspectorate to make efforts to
make policies in forming teams to increase job
satisfaction received by team members through
situational factors consisting of many aspects such
as authoritarianism, abilities, task structure, formal
authority systems and norms and group dynamics.
REFERENCES
As’ad, Moh. 2003 PsikologiIndustri, Liberty, Yogyakarta
Bologna, G. Jack and Robert J. Lindquist, 1995. Fraud
Auditing and Forensic Accounting, Second Edition.
John Willey & Sons, Inc.
Brownell, Peter. 1982, A Field Study Examination of
Budgetary Participation and Locus of Control.
Accounting Review, Vol LVII, No. 4. Pp. 766-777.
Cheerington, Davidd J. 1994, Organizational Behavior:
The Management of Individual and Organizational
Performance. Second Edition. Ally and Bacon.
Cherg, Mandy M; Luckett, Peter F; Schulz, 2003. The
Effect of Cognitive Style Diversity on Decision
Making Dyads: An Empirical Analysis in the context
of a Complex Task. Behavior Research in Accounting,
Vol. 15, pp. 39.
Ghozali, Imam, 2005. AplikasiAnalisis Multivariate
dengan Program SPSS. Edisi 3. Badan
PenerbitUniversitasDiponegoro.
Gordon, Judith R. 1991, A Diagnostic Approach to
Organizational Behavior. Third. Edition Ally and
Bacon.
Greenberg, Jerald and Robert A. Baron, 2003, Behavior in
Organizations. Third Edition. Ally and Bacon.
Hough, Jill R. and DT Ogilvie, 2005. A Empirical Test of
Cognitive Style and Strategic Decision Outcomes.
Journal of Management Studies. Vol. 42, No. 2. Pp.
417-448.
Hyatt, Troy A. and Douglas F. Prawit, 2001. Does
Congruence Between Audit Structure and Auditors
Locus of Control Affect Job Performance Accounting
Review.
Jiambalvo, James and Jamie Pratt. 1982, Task Complexity
and Leadership Effectiveness in CPA Firm.
Accounting Review, Vol LVII, No. 4. PP. 734-750.
Jogiyanto, 2004, MetodologiPenelitianBisnis: Salah
Kaprah dan Pengalaman-Pengalaman, BPFE,
Yogyakarta.
Keller, Robert T. 1989, A Test of The Path-Goal Theory
of Leadership with Need For Clarity as a Moderator in
Research and Development Organizations Journal of
Applied Psychology, Vol. 74, No. 2. Pp 208-212.
Kreitner, Robert and Angelo Kinicki, 2001, Organization
Behavior, Fith Edition, Mc Graw Hill.
Kuncoro, Mudrazad. 2001, MetodeKuantitatif: Teori dan
AplikasiuntukBisnis dan Ekonomi. AMP UKPN,
Yogyakarta.
Luthan, Fred, 1995, Organizational Behavior. Seventh
Edition. McGraw Hill.
Maridjo, Herry, 2001. Gaya dan Kepemimpinan yang
Efektif. MajalahAntisipasi, No. 5. Pp. 103-124.
Mills, Tina Y. 1996, The Effect of Cognitive Style on
External Auditor’s Reliance Decisions on Internal
Audit Functions. Behavior Research Accounting, Vol.
98. Pp. 49-73.
Outley, David T. and Bernard J. Pierce, 1995. The Control
Problem in Public Accounting Firm; An Empirical
Study of The Impac of Leadership Style, Accounting,
Organization and Society, Vol. 5. Pp. 405-420.
Nachrowi, NachrowiDjalal dan Hardius, 2002,
Penggunaan Teknik Ekonometri. PT.
RajaGrafindoPersada, Jakarta.
EBIC 2019 - Economics and Business International Conference 2019
384

Robbins, Stepen P., 1991. Organizational Behavior:
Concepts, Controversies and Applications. Prentice
Hall.
Sekaran, Uma. 2003, Research Methods for Business: A
Skill-Building Approach. Fourth Edition. John Wiley
& Sons, Inc.
Tsui, Judy S. L. The Joint Effect of Economic Presseru
and Locus of Control on Auditors’ Ethical Behavior.
Yukl, Gary, 2002. Leadership in Organizations. Fith
Edition. Prentice Hall.
Basri, YesiMutia. 2000. Pengaruh Gaya Kepemimpinan
dan Karakteristik Personal terhadapKepuasanKerja.
Thesis Magister Akuntansi UGM.
Tidakuntukdipublikasikan.
Hening, Tias W. 1998. Pengaruh Gaya
KepemimpinanterhadapKepuasanKerjaKaryawan:
pada PT Batik DanarHadiberdasarkan Model Parth-
Goal Theory. Thesis Magister Manajemen UGM.
Tidakuntukdipublikasikan.
Koemiati, 2001. Pengaruh Perilaku Kepemimpinan
Transformasional terhadap Kepuasan Kerja Bawahan
dengan Locus of Control sebagai Variabel
Pemoderasi. Thesis Magister Manajemen UGM. Tidak
untuk dipublikasikan.
Peraturan Menteri PendayagunaanAparatur Negara.
(2008). “Standar Audit AparatPengawasan Intern
Pemerintah (2008) atau (2008) atau APIP”.
Thoha, Miftah(2007), PerilakuOrganisasi, Konsep Dasar
dan Aplikasinya, Raja GrafindoPersada, Jakarta.
Model of Leadership Style on Job Satisfaction in Internal Audit Team at Regional Inspectorates with Locus of Control and Cognitive Style
as Moderated Variable
385
