
Influence of Financial Literacy on Performance
and Business Sustainability: Case Study on Cake Business Group
Typical Malayu Deli
Juli Meliza
1
, Dian Faqih Sumarli
2
1
Department of Management, Universitas Medan Area, Jl. SeiSerayu, Kampus UMA, Medan, Indonesia
2
Department of Accounting, Universitas Medan Area, Jl. SeiSerayu, Kampus UMA, Medan, Indonesia
Keywords: Financial Literacy, Performance, Sustainability
Abstract: This research aims to analyze the influence of financial literacy on performance and sustainability, case
studies in the business group of the Malayu pastry vendor of Deli. The structural equation model is used to
analyze data. The results confirmed the influence of financial literacy on performance and business
continuity in the Malayu pastry business group. The implication is that with proper financial literacy. The
cake Business group can make appropriate management and financial decisions, to improve business
performance and sustainability.
1 INTRODUCTION
Medan City is a city that has a diversity of culture
and the historical side of some tourist attractions.
Enjoying the culinary richness of Medan city also
must not be absent from the list of activities.
Culinary trails in the city of Medan that are not less
diverse can make everyone put heart in the town
nicknamed the Malay City of Deli. This distinctive
culinary is continued to be preserved by the
descendants of the Malay Deli in Medan, so there is
a unique business group Cake Melayu Deli. The
existence of this business group needs to continue to
be maintained, because the typical culinary of the
area becomes an attraction for tourists who visit.
Small micro-enterprise sector, can absorb the
workforce through the creation of new employment.
In general, the SME always has a common problem
that is not complet, so it is difficult to compete with
large companies. The typical Malay pastry business
group also includes SMEs who have similar issues
with SMEs in general, particularly in the field of
financial literacy.
In the year 2016, the results of OJK survey
showed that North Sumatera has an index of 31.3%
above the average value of the National Financial
Literacy Index and ranked 11 out of 33 provinces.
This data shows the low financial literacy of the city
community Medan (Segara, 2017) which will impact
the sustainability of the business.
Enriching the knowledge of SMEs to financial
expertise so that the management of business
finances can develop well (Aribawa, 2016), is one
way to maintain business sustainability.
Dahmen and Rodriguez (2014), stated that,the
necessary understanding of financial literacy rates
for business actors, especially for the preparation of
business financial statements is indispensable, in
terms of the search process of additional funds.
Anggraeni (2015) stated that, financial literacy
affects how people think of financial conditions and
influence strategic decision making in financial and
better management for business owners. However,
Eke, and Raath (2013) found that financial literacy
does not affect on SMEs growth.
Based on the descriptions, researchers are
motivated to research the level of financial literacy,
whether it affects performance and sustainability of
the business.
Meliza, J. and Sumarli, D.
Influence of Financial Literacy on Performance and Business Sustainability: Case Study on Cake Business Group Typical Malayu Deli.
DOI: 10.5220/0009202702910295
In Proceedings of the 2nd Economics and Business International Conference (EBIC 2019) - Economics and Business in Industrial Revolution 4.0, pages 291-295
ISBN: 978-989-758-498-5
Copyright
c
2021 by SCITEPRESS – Science and Technology Publications, Lda. All rights reserved
291
2 LITERATURE REVIEW
2.1 Financial Literacy
Financial literacy is a lives skill that everyone needs
to be able to improve their life and survive the
current complex economy (Lusardi, 2012).
Financial literacy is a mixture of financial
knowledge and skills, and it will help business
owners make decisions and financial choices wisely
(Okello, Ntayi, Munene, andMalinga, 2017).
Based on the survey data conducted by OJK
(2013), there are four levels of financial literacy of
the Indonesian population, namely :
(1) well literate of 21.84%, namely have knowledge
and know the benefits of financial services
institutions and have Financial product usage skills;
(2) sufficient literate of 75.69%, i.e.,have expertise
and understand the benefits of financial services
institutions;
(3) lessscholarly of 2.06%, i.e., only having
knowledge of financial services institutions; and
(4) not literate of 0.41%, i.e., has no experience and
confidence in financial services institutions.
The measurement of the financial literacy
variables in SMEs uses measurement indicators
regarding the Developing Indonesian Financial
Literacy Index conducted by the Financial Services
Authority (2013). This measurement indicator is
following the research undertaken by Aribawa
(2016) namely, general knowledge banking with
four sign questions, and interest calculation of
savings and loans with a sign of 4 items.
2.2 Business Performance and
Sustainability
Mutegi et al. (2015), defining the performance of
SMEs, is the result of work achieved by the
individual, and adjusting to the role or task of the
individual in a company at a certain period, which is
associated with a value size or individualstandard
companies work.Aribawa (2016), in his research on
the measurement of varibael performance, using five
statements of analysis.
Adamoko et al. (2015), business growth is the
company's ability to increase the size of a company.
Fatoki (2014) in his research, said that business
growth and how to measure it is usually defined and
measured using absolute or relative, changes in
sales, assets, work, productivity, profits.
Business sustainability in SMEscan be seen from
the company's success in innovating, employee and
customer management, and also initial capital. This
shows that the company has an orientation to thrive
and to see the opportunity for continuous innovation
(Hudson, Smart, and Bourne, 2001).
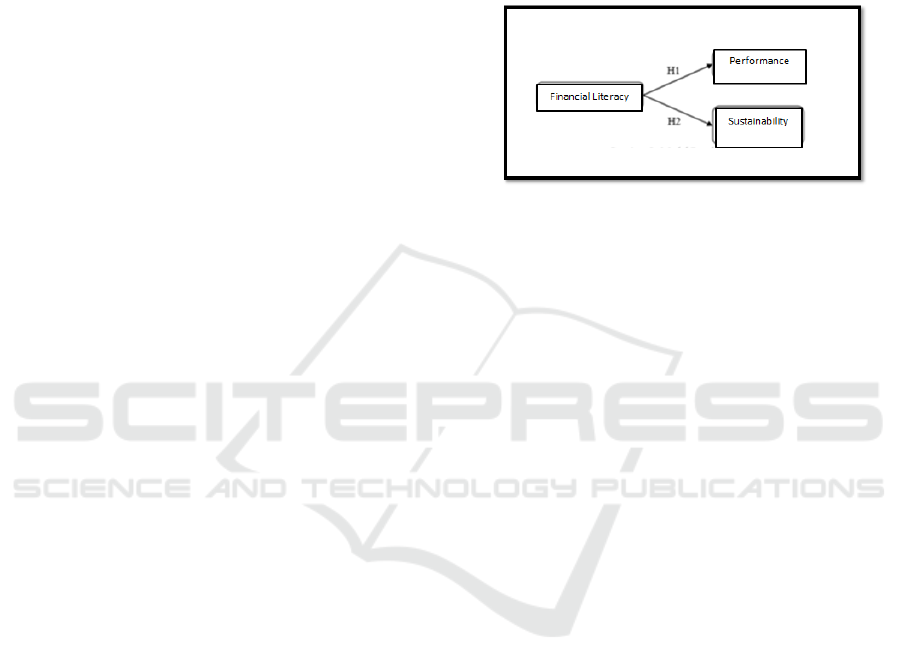
In general, the hypotheses tested in this study
are as follows:
H
1
: financial literacy has a significant impact on
performance
H
2
: financial literacy has a significant impact on
business sustainability
Figure 1. Research Model
3 RESEARCH METHODOLOGY
3.1 Population and Samples
The type of research used in this study is
quantitative research. This research aims to
determine the influence of independent variables,
i.e., financial literacy of dependent variables,
performance, and sustainability.
The population of this research is the owner and
manager of the Malay pastry business in Medan as
many as 145 business people. The number of
samples taken in this study was as much as 100
respondents.
The characteristics of this research sample are
based on several criteria, namely: SMEs located in
Medan, have at least 1 employee, offer deli Malay
cake products.
3.2 Data Collection
This study uses primary data. Primary data was
obtained from questionnaire, which was distributed
directly to all business people, who sold a traditional
Malay cake in Medan.
The form of the statement used is a closed
statement, and the measurement scale used for the
dependent variable in this study uses sematic
defferential (a measure of the sematic defferential
scale used in the measurement of the dependent
variable is measured by giving a score of one to
five). In general, the constructs and indicators used
are presented as in Table 1.
EBIC 2019 - Economics and Business International Conference 2019
292
The sample size used is 100. The sampling
technique used is non-probability sampling with
accidental sampling, ie the sample is selected based
on the ease in obtaining the required data.
Table 1. Research Constructions and Indicators
Research Constructions Indicators
Financial Literacy 1. Opening an account
2. Minimum funds
3. Funds settle
4. Government guarantee
5. One year yield
6. Multi-year yields
7. Credit interest
Sustainability 1. Total assets
2. Turnover
3. Profit
4. Production volume
5. Sales costs
6. Number of employees
7. Business location
Performance 1. Work plan
2. Work errors
3. Sales growth
4. Decreasing fixed costs
5. Antici
p
ate
p
roduction
Source: Data processed
3.3 Technical Analysis
Collected Data is analyzed using a partial least
square based structural equation model. Smart
Software PLS 3.0 is used to help analyze the
relationship between variables.
4 RESULT AND DISCUSSION
4.1 Document of Theoretical Model
Development
Figure 2. Theoretical Model Development Diagram
Source: PLS Output of research data (2019)
4.2 Outer Model or Measurement
Model
4.2.1 Validity and Reliability Tests
Convergent Validity
Convergent validity is seen based on the correlation
between item / indicator scores and latent variable
scores. Individual reflective measures are said to be
high if they correlate more than 0.7 with the latent
variable that is to be measured (Cahyanigrum,
Endah et al. 2015).
Convergent validity of the measurement model
with reflexive indicators can be seen from the
correlation of score items with variable scores.The
indicator is considered valid if it has a correlation
value above 0.70.But in the research stage of
developing the loading scale 0.50 to 0.60 is still
acceptable (Ghozali, 2008).
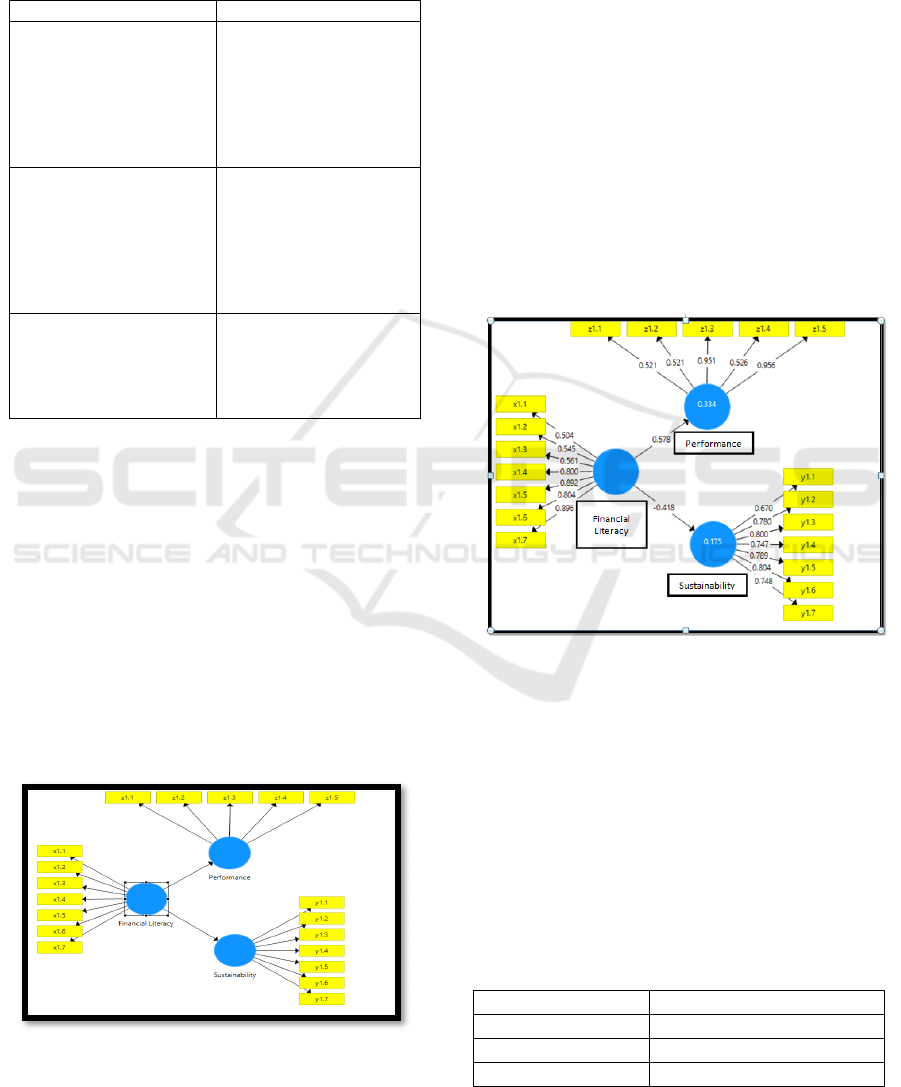
Figure 3. Output Diagram
Source: PLS Output of research data (2019)
Based on figure 3 it can be seen that the outer
loading of each item has a correlation value greater
than 0.50, so it can be said to be valid. This shows
that the indicators of each variable are declared valid
or can measure these variables appropriately
Composite reliability
Composite reliability is said to be good if the value
is above 0.60. Based on the PLS test results show
that the composite reliability value for all variables
Table 2. Value Composite Reliability
Composite Reliabilit
y
Sustainabilit
y
0,907
Performance 0,836
Financial literac
y
0,885
Source: PLS Output of research data (2019)
Influence of Financial Literacy on Performance and Business Sustainability: Case Study on Cake Business Group Typical Malayu Deli
293
Based on Table 2, Value Composite Reliability,
obtained information that the amount of Composite
Reliability on all blocks of indicators has met the
assumption Composite Reliability is more
significant than 0.6, it means that the indicator
blocks in each latent variable has a high consistency.
Discriminant Validity
Discriminant validity with reflexive indicators,the
value can be checked onthe cross-loading between
signwith its construct. Indicator correlation value to
its construction must be more significant than other
construct value. Another method of assessing
discriminant validity is to use Average Variance
Extracted (AVE) which has a construct value> 0.50
specified as a good model (Ghozali, 2008). Visible
on the AVE table the terms of construct value> 0.50
already appropriate, so it can be concluded that the
model in this study is a good model.
Table 3. Average Variance Extracted (AVE)
Avera
g
e Variance Extracte
d
Sustainabilit
y
0,583
Performance 0,528
Financial literac
y
0,536
Source: PLS Output of research data (2019)
4.3 Inner Model or Structural Model
After the estimated model meets the outer model
criteria, the next test is the structural model (inner
model). Internal model or structural model testing is
done to see the relationship between construct,
significance value, and R-square of the research
model. Evaluating structural models is by looking at
values R-square, for the t test dependent construct as
well as the significance of the structural path
parameter coefficients.
R-square
To assess the model with PLS begins by looking at
R-square for each latentdependent variable. The
following table is the result of R-square estimation.
Table 4. R-Square
R-Square Ad
j
.R-Square
Sustainabilit
y
0,175 0,166
Performance 0,334 0,328
Source: PLS Output of research data (2019)
Q-Square predictive relevance for the structural
model, measure how well the observational value
produced by the model, and also the estimated
parameter. The Q-square value> 0 indicates the
model has predictive relevance; otherwise if the Q-
square value ≤ 0 shows the model lacking predictive
connection.
Q-Square predictive relevance= 1- (1-Rsqure1)(1-Rsquare2)
= 1 – (0,825)(0,666)
= 1 – 0,54945= 0,45055
4.4 Hypothesis Testing
Hypothesis testing on the t test uses path
significance tests. Testing structural models to assess
the effect of each direction of the relationship
(causal path) and the predetermined hypothesis
testing, used bootstrapping techniques. Based on the
results of the technical analysis, all the course of the
variable relationship is significant at a significant
rate (p-value) of 5% and with the amount of t-
Statistic, respectively > 1.96. The relationship
between variables visible to the inner model
indicates all the hypotheses submitted are
acceptable.
In testing the draft model of this study proposed
test on two hypotheses as follows:
H
1
: financial literacy has a significant impact on
performance
H
2
: financial literacy has a significant influence on
the sustainability of business
Table 5. Path Coefficients
t – statistic P-value Keterangan
Financial literacy Sustainability 5,138 0,000 Significant
Financial literacy Performance 8,497 0,000 Significant
Source: PLS Output of research data (2019)
Table 5 path coefficients, shows the bootstrapping
path coefficients which illustrate the significant
positive effect between latent variables.
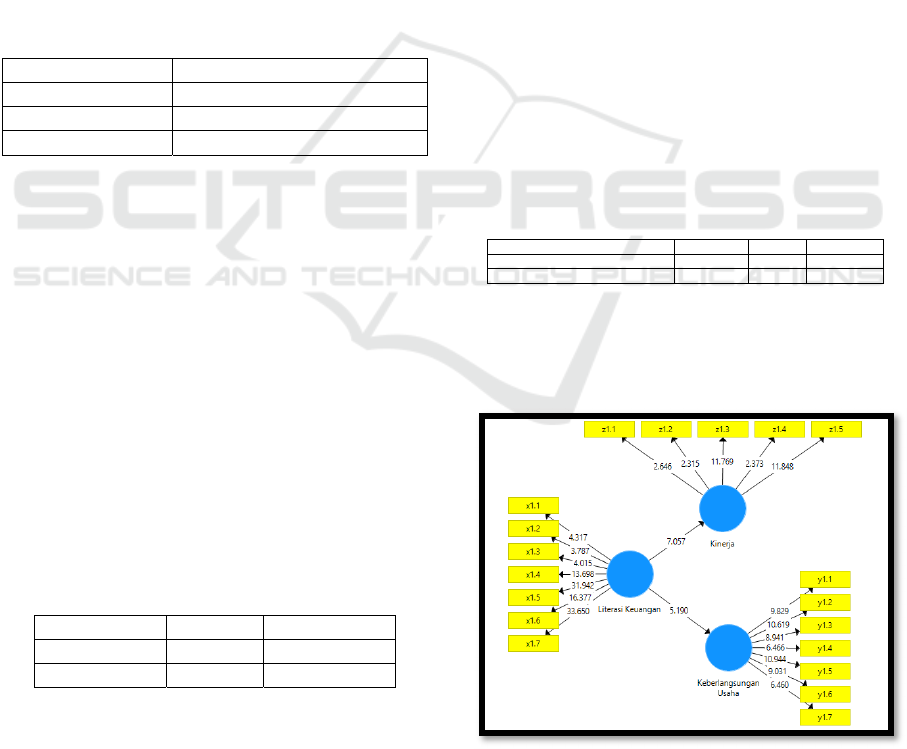
Path Significance Test
Figure 5. Bootstrapping Structural Model
Source: PLS Output of research data (2019)
EBIC 2019 - Economics and Business International Conference 2019
294

The coefficient value of the structural model is said
to be significant if the t-count> t-table is 1.96 (1.96
is the t-table value in the 95% confidence level). All
the indicators in Figure 5 look substantial on the
condition of t-value> 1.96.
These results mean that the relationship
between the variables seen with the model shows
that all proposed hypotheses can be accepted.
5 CONCLUSION AND
SUGGESTION
5.1 Conclusion
In general, it can be seen that there is an influence of
financial literacy on performance and sustainability
of the business in the Malay Deli Merchant business
Group in Medan.
Based on the explanation described in the
analysis and discussion chapter, it was concluded
that the most substantial direct effect occurred on the
variables of financial literacy to performance.
The research also provides insight to
stakeholders who have a role in increasing the level
of financial literacy in Indonesia.
5.2 Suggestion
In the future, researchers hope, there will be a lot of
research with a more applicative perspective for the
development of creative business in Indonesia.
Improvements to this research can be done among
others by extending the scope of the sample to a
broader extent, modifying the model to be more
involved, or could also extend the range of the
measuring indicator.
REFERENCES
Anggraeni, B. D. 2015. Pengaruh Tingkat Literasi
Keuangan Pemilik Usaha Terhadap Pengelolaan
Keuangan. Studi Kasus: UMKM Depok. Jurnal
Vokasi Indonesia, Vol.3 No.1, 22-30.
Aribawa, D. 2016. Pengaruh Literasi Keuangan Terhadap
Kinerja Dan Keberlangsungan Umkm Di Jawa
Tengah. Jurnal Siasat Bisnis, Vol. 20, 1-13.
Cahyanigrum, Endah et al. 2015.Analisa Faktor-Faktor
Yang Mempengaruhi Kinerja Perusahaan
Menggunakan Pendekatan Partial Least Square,
http://ejournal-s1.undip.ac.id/index.php/gaussian,
ISSN: 2339-2541
Eke, E., danRaath, C. 2013. SMME Owners’ Financial
Literacy and Business Growth. Journal of Social
Sciences MCSER Publishing, Rome-Italy, Vol. 4,
397-406
Hair, J.F et al. 2014. A Primer On Partial Least Squares
Structural Equation Modeling (PLS-SEM). United
States of America: SAGE.
Haryono, S. &Wardoyo, P. 2013. Structural Equation
Modeling (SEM) for Management Research. Jakarta:
PT Intermedia Personnel Utama Jakarta.
Lusardi, A., & Scheresberg, D. C. B. (2013). Financial
literacy and high-cost borrowing in the United
States.Nber, 1–42.
Okello, G. C. B., Ntayi, J. M., Munene, J. C., &Malinga,
C. A. (2017). The relationship between access to
finance and growth of SMEs in developing economies:
financial literacy as a moderator. Review of
International Business and Strategy.
Otoritas Jasa Keuangan, 2013. Developing Indonesia
Financial Literacy Index.
Otoritas Jasa Keuangan. 2013. Literasi Keuangan.
https://www.ojk.go.id/id/kanal/edukasi-
danperlindungan-konsumen/Pages/Literasi-
Keuangan.aspx.
Segara, T. 2017. Strategi Nasional Literasi Keuangan
Indonesia (Revisit 2017). Jakarta: Otoritas Jasa
Keuangan.
Influence of Financial Literacy on Performance and Business Sustainability: Case Study on Cake Business Group Typical Malayu Deli
295
