
Financial Health Assessment Model for
Listed Companies in Indonesia
Khaira Amalia Fachrudin
Faculty of Economic and Business, Universitas Sumatera Utara, Medan, Indonesia
Keywords: Financial Health, Financial Distress, Profitability, Financial Leverage
Abstract: It is important to conduct financial health assessment to measure company’s health so that corrective action
can be taken and it serves as a guide in investment decision. Managers will accordingly be able to detect the
factors that may improve company’s financial health. This study, therefore, aims to produce a financial health
probability assessment model. The population involved companies listed on the Indonesia Stock Exchange.
The target population is all companies experiencing bankruptcy and insolvency in 2018 totalling 23
companies and a total of 23 healthy companies as the comparison. The sample consist of all companies in the
target population. The analysis was conducted using logistic regression. The findings further discovered that
the profitability ratio was potentially likely to improve the financial health of the company, while the financial
leverage ratio was potentially likely to worsen the financial health of the company. The classification accuracy
two years prior to the observation year was 93.5%, and the previous year was 95.7%.
1 INTRODUCTION
The financial health of a company is the ability to
maintain a balance against changing conditions in the
environment and relates to everyone who participates
in business (Csikosova et al., 2019). A financial
health reflects company’s health in financial aspects,
such as health in terms of profitability, financing,
liquidity, asset utilization, and market value.
Financial statements are a prime source of
information about financial health (Ross et al., 2013).
The prediction model of financial distress can also
be adopted to predict company’s financial health
(Arasu et al., 2013 and Sriram, 2008). Its application
has been implemented in research to determine the
soundness of manufacturing companies in Indonesia
using the Altman, Springate, and Zmijewski models
(Sinarti and Sembiring, 2015), research in India used
Altman’s model to measures companies’ financial
health (Kumari, 2013), and research on banking
industry in Bangladesh adopted Altman’s model to
predict financial health (Parvin, 2013). These
models were carried out at different places and times,
thus leaving the possibility that they are not suited to
current condition in Indonesia. Tuckman urged that
financial unhealthy is used to describe companies that
eventually became liquidated (Tuckman and Chang,
1991). In 2018, there were 23 publicly listed
companies in Indonesia receiving special notations on
their ticker shares from the Indonesia Stock Exchange
due to negative business capital or equity, for
example the APEX stock code was miswritten as
APEX.E. The financial distress condition with this
type of insolvency in bankruptcy needs to be minded
as it shows signs of economic failure that potentially
lead to business liquidation (Fachrudin, 2007).
As of now, there has been no financial health
assessment model suited to current conditions in
Indonesia. This research therefore attempted to create
a model that can estimate the probability of
company’s health condition and its level. This model
will largely benefit company’s management,
investors and potential investors, creditors, and
academia.
Theoretical Linkages between Financial Health
and Financial Distress
Business failure causes losses to creditors and
investors who use accounting disclosures to assess
financial health, so financial health assessment can be
done through a financial distress model that also uses
accounting data (Sriram, 2008; Yakymova and Kuz,
2019). Performance measures reflected in the
financial ratios surrogate for important attributes of
Fachrudin, K.
Financial Health Assessment Model for Listed Companies in Indonesia.
DOI: 10.5220/0009200101270132
In Proceedings of the 2nd Economics and Business Inter national Conference (EBIC 2019) - Economics and Business in Industr ial Revolution 4.0, pages 127-132
ISBN: 978-989-758-498-5
Copyright
c
2021 by SCITEPRESS – Science and Technology Publications, Lda. All rights reserved
127

the firm's financial conditions such as profitability,
solvency, liquidity, and asset management. Financial
ratios also provided reliable signals of financial health
(Sriram, 2008).
Financial health prediction is one of the most
discussing topics in financial literatures (Javaid and
Javid, 2018). Financial performance is determined by
the financial ratios to be compared between
financially healthy and financially unhealthy
companies to produce prediction models in order to
determine the financial health of a firm (Javaid and
Javid, 2018).
The theory of financial distress is described as a
condition that is influenced by balance sheet
influence and earnings effect. Balance sheet influence
includes liquidity ratios, activity, and financial
leverage. While the earning effect includes
profitability, and retained earnings to working capital
ratio (Nketiah, 2017). The financial ratios used to
predict financial distress will also be used to assess
financial health.
Financial Health Prediction Model
Sriram (2008) created a model for assessing financial
health using fundamental financial variables and
intangible assets with predictive accuracy that was
comparable to prediction rates in the Altman’s model.
Altman (1977) conducted a multiple discriminant
analysis test on manufacturing and retail companies
included in the list of bankruptcy requests (distressed)
and companies that face bankruptcy (non-distressed)
to get a bankruptcy prediction model. The model
obtained is the previous revised model currently
named as Revised Z-Score. The model produced by
Altman was also used to assess financial health
(Sriram, 2008).
The model is :
Z” = 0.717(X
1
) + 0.847(X
2
) + 3.107(X
3
) +
0.420(X
4
) + 0.998(X
5
) (1)
Where :
X
1
= working capital/total assets
X
2
= retained earnings/total assets
X
3
= earnings before interest and taxes/total
assets
X
4
= book value equity/book value of total
liabilities
X
5
= sales/total assets
If the score obtained is <1.23, the company has
the potential to go bankrupt, a score of 1.23 to 2.9 is
classified as a gray area, and a score of> 2.9 is
classified as not having the potential to go bankrupt.
Yakymova (2019) created a model to assess
financial health for municipal companies by
developing a five-factor discriminant model using
data from 50 Ukranian companies during 2014-2017.
The most distinguishing factors between healthy and
unhealthy companies are equity-assets ratio, the
current ratio, and the average accounts receivable
turnover.
The assessment of financial health can also be
carried out using Bonitu B Index (Javaid and Javid,
2018). The formula is as follows:
B = 1.5X
1
+ 0.08X
2
+10X
3
+ 5X
4
+ 0.3X
5
+ 0.1X
6
(2)
Where:
X
1
= cash flow / debts
X
2
= total capital / debts
X
3
= earnings before taxes / total capital
X
4
= earnings before taxes / total revenues
X
5
= stocks price / total assets
X
6
= total revenues /total capital.
If B produces positive value, it means that the
company is positive and healthy, if it generated
negative values, it means that the company has a
negative and unhealthy situation, thus the lower the
value of B, the worse the situation of the company
would be.
Jordan (1998) used the ratio analysis and
identified financial health of water utility. The
function of financial health he made consisted of size
of liquid assets, cash flow, debt, and expenditures
(Jordan, 1998). The variables used in the model
consisted of return on assets, current ratio, debt to
equity ratio, operating ratio, and cash flow coverage.
Other financial distress prediction models used
for finacial health assessment include Springate and
Zmijewski models. Springate uses multiple
discriminant analysis - step wise by using 19 popular
financial ratios to distinguish between healthy and
bankrupt companies (Springate, 1978; Arasu et al.,
2013). The Springate model is as follows:
S-Score = 1.03 X
1
+ 3.07 X
2
+ 0.66 X
3
+ 0.4 X
4
(3)
Where :
X
1
= working capital / total assets
X
2
= earning before interest and taxes (EBIT) /
total assets
X
3
= net income before taxes (EBIT) / current
liabilities
EBIC 2019 - Economics and Business International Conference 2019
128
X
4
= sales / total assets
If the Springate Z-score is smaller than 0.862,
then the company is predicted to go bankrupt,
whereas if the score is greater than 0.862, then the
company is predicted to be healthy (Huo, 2006).
Zmijewski (1984) involved a sample of bankrupt
and non-bankrupt companies listed on the American
and New York Stock Exchange during 1972-1978
under probit analysis. The formula is as follows:
b* = -4.3 – 4.5 X
1
+ 5.7 X
2
– 0.004X
3
(4)
X
1
= net income / total assets
X
2
= total debt / total assets
X
3
= current assets / current liabilities
If b *> 0, then the company is predicted to
potentially experience bankruptcy, whereas if b * <0
then the company is predicted to be free from
bankruptcy.
Predictions of financial distress using predictors
in the form of financial ratios, be it profitability ratio,
capital structure, liquidity, and asset management.
However, Bal (2013) discovered that a good ratio
used to distinguish between failed companies and
successful companies is the ratio of return on assets,
return on capital, and earnings per share, all of these
three ratios are profitability ratios. In the meantime,
Javaid (2018) and Altman et al. (2017) stated that the
financial ratios that have the most impact on
prediction models in identifying the status of failed
and non-failed companies are profitability and
liquidity ratios. The ranking of the popularity of
financial ratios in prediction of financial distress is
dominated by the ratio of net income to total assets,
current assets to current liabilities, total liabilities to
total assets, working capital to total assets, and
earnings prior tointerest and taxes to total assets
(Fachrudin, 2007). For the prediction of financial
distress probability in Indonesia due to the 1997-1998
economic crisis, a significant predictor is the ratio of
net income to total assets and the ratio of total
liabilities to total assets (Fachrudin, 2007).
2 HYPOTHESIS DEVELOPMENT
In 2018, 46 companies with unhealthy financial
condition was found. This preliminary study involved
the variable of financial ratios in the form of net
income to total assets, working capital to total assets,
retained earing to total assets, earning before interest
and taxes to total assets, book value of equity to book
value of total liabilities, sales to total assets, and total
liabilities to total assets (Altman, 1977; Springate,
1978; and Fachrudin, 2007) in order to estimate the
probability of financial health by using logistic
regression in one year and two years prior to the
observation year, that is 2018. Some trials was
conducted by involving all the variables as well as in
stepwise, yet the obtained model was not feasible and
a number of financial ratios were found insignificant.
To this end, this study selected variables of the ratio
of net income to total assets and the ratio of total
liabilities to total assets in order to estimate the
probability of financial health in line with Fachrudin's
research previously conducted in Indonesia
(Fachrudin, 2007).
The hypothesis are :
1. Ratio of net income to total assets has positive
and significant inluences to probability of
financial health
2. Ratio of total liabilities to total assets has positive
and significant inluences to probability of
financial health
Research Model
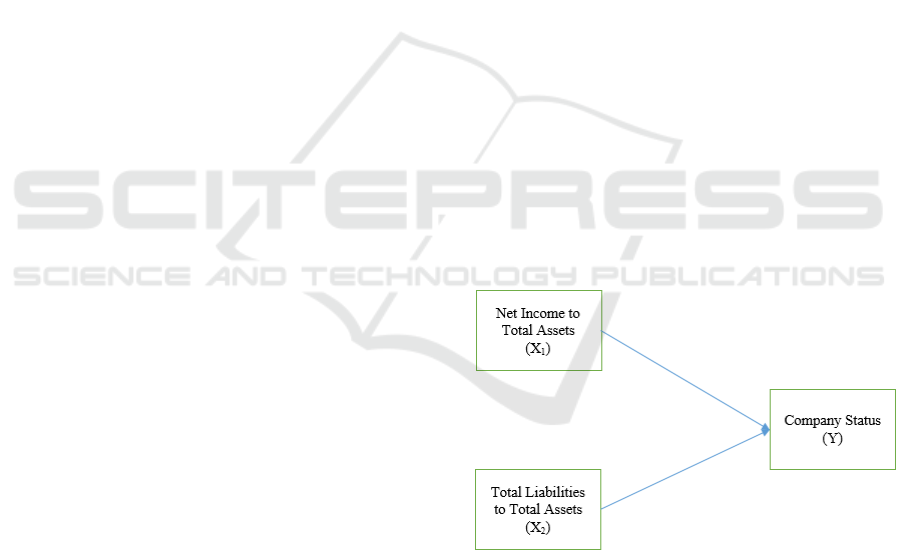
This study used profitability ratio and financial
leverage ratio as the variables to estimate the
probability of financial health. The model is as
follows:
Figure 1: Research Model
3 RESEARCH METHODS
3.1 Sample Design
The population in this study involved all 600
companies listed on the Indonesia Stock Exchange.
The target population is 23 unhealthy companies that
received a special notation on its stock ticker from the
Financial Health Assessment Model for Listed Companies in Indonesia
129

Indonesia Stock Exchange as of December 31, 2018
as they have negative equity. These companies with
negative equity theoretically belong to companies
that experience financial distress with insolvency in
bankruptcy type. They are compared with 23 healthy
companies. Each unhealthy company is compared to
a healthy company that has the highest positive equity
in the same sector and has almost the same total
assets. Saturated sampling was done for 46
companies in the target population.
3.2 Variable
The variables of this study include:
Dependent variabel (covariates) :
X
1
= net income / total assets (NITA)
X
2
= total liabilities / total assets (TLTA)
The dependent variable (Y) is company’s health
status which is a categorical variable. The values are:
1 = The company that has the best level of
financial health
0 = The company that has the worst level of
financial health (experiencing financial
distress - insolvency in bankruptcy type).
3.3 Statistical Analysis
Data analysis was performed by logistic regression
Binary regression model :
y
1
= a + b
1
x
1
+ b
2
x
2
+ μ (5)
Descended into Logistics distribution function :
Pi = 1 / [1+exp (a + b
1
x
1
+ b
2
x
2
)] (6)
Pi = financial health probability whose value is
between 0 and 1
4 RESULTS AND DISCUSSION
4.1 Results
The results of the study are presented in descriptive
statistics and inference statistics in the form of
logistic regression
4.1.1 Descriptive Statistics
Descriptive statistics are presented in Table 1
Table 1. Descriptive Statistics - Mean and Standard
Deviation of the Net Income to Total Assets Ratio and the
Total Liabilities to Total Assets Ratio
4.1.2 Logistic Regression
Logistic regression results are presented in Table 2
Table 2. Logistic Regression Results for Financial Health
Assessment
The value of Hosmer and Lemeshow goodness of
fit shows a significance probability of 0.503 one year
prior to the observation year (2017) and 0.267 in the
previous two years (2016). This value indicates that
these models are feasible for further analysis because
as there is no distinct distinguishment between the
predicted classification and the observed
classification.
Negelkarke R square, respectively, are 0.633 and
0.759, which means that the variability of the
dependent variable can explain the dependent
variable by 63.3% in one year prior to the observation
year and 75.9% in the previous two years. This value
indicates a fit model.
The -2 Log-Likehood indicates a decrease of
34,125 in one year prior to the observation year and
25,001 in the previous two years. These values are
greater than the critical values of chi square table at
alpha 5%, which indicates a better fit model.
The model for two years prior to the observation
year has a significance level of 5%, but for one year
prior this model is not significant at alpha 5% because
the phi value of NITA is 0.060. The statistical results
show that the hypotheses 1 are supported by empirical
data at alpha 5% and hypotheses 2 are not supported
by empirical data at alpha 5%.
N I T AT L T A
2016
Healthy
Companies Mean 0.037 0.371
Stdev 0.145 0.263
Unhealthy
Companies Mean -0.618 3.165
Stdev 2.605 4.051
2017
Healthy
Companies Mean 0.004 0.373
Stdev 0.132 0.203
Unhealthy
Companies Mean -0.227 3.527
Stdev 0.332 5.266
2017
Independent Variable B Exp (B) B Exp (B)
Constant 2.473 (0.003) 0.084 3.996 (0.002) 0.018
NITA 5.955 (0.041) 385.505 6.993 (0.060) 1089.212
TLTA -2.382 (0.007) 0.092 -5.225(0.002) 0.005
n4646
Hosmer and Lemeshow 0.503 0.267
-2LL 34.125 25.001
Negelkerke R Square 0.633 0.759
Predicted Percentage Correct 95.70% 93.50%
Numbers in brackets indicate significance
2016
EBIC 2019 - Economics and Business International Conference 2019
130

The classification accuracy in one year prior to
the observation year is 95.7% and 93.5% in the
previous two years. Both variables are significant
with the odds ratio shown by the Exp (B) value as
presented in Table 2, describing as follows:
1. One year prior to the observation year, the
increase in net income to total assets ratio would
potentially increase company's financial health by
385.505 times,
2. One year prior to the observation year, the
increase in the ratio of total liabilities to total
assets would potentially reduce company's
financial health by 0.092 times,
3. Two years prior to the observation year, the
increase in the ratio of net income to total assets
would potentially increase company's financial
health by 1089.212 times,
4. Two years prior to the observation year, the
increase in the ratio of total liabilities to total
assets would potentially reduce company's
financial health by 0.005 times.
The models obtained are as follows:
Two years prior
Pi = 1 / [1 + exp (3.966 + 6.993 X
1i
– 5.225 X
2i
)]
(7)
The logistic distribution function can be simplified to:
P
i
= 1 / 1 + 2.718
-(3.996 + 6.993 X1 i – 5.225 X2 i)
(8)
One year prior
Pi = 1 / [1 + exp (2.473 + 5.955 X
1i
– 2.382 X
2i
)]
(9)
The logistic distribution function can be simplified to:
P
i
= 1 / 1 + 2.718
-(2.473 + 5.955 X1 i – 2.382 X2 i)
(10)
P value range between a 0 and 1.
4.2 Discussion
The ratio of financial health prediction reflected by
the balance sheet influence and earnings effect [19]
can be applied to estimate company’s financial
health. The ratios that have a significant effect on this
study are among others the ratio of net income to total
assets and the ratio of total liabilities to total assets.
This finding is in line with previous financial distress
prediction model (Fachrudin, 2007) and previous
financial health assessment model (Csikosova et al.,
2019).
This model did not involve the variable of current
ratio such as Yakymova and Kuz (2019) and Jordan
(1998) models. This is due to the fact that the
preliminary study discovered that this ratio is not
significant since liquidity problem can be handled by
taking debt. Thus, total liabilities serve as an
important predictor.
5 CONCLUSION
Profitability and financial leverage ratios can be used
to estimate the financial health of a company. The
probability value obtained ranged between 0 and 1. A
value of 0 indicates that the condition of the company
is unhealthy. While a value of 1 indicates that the
condition of the company is healthy. The values
indicate the level of company’s health, for example a
value of 0.1 can be categorized as healthy, a value of
0.5 can be categorized as moderate, and a value of 0.9
can be categorized as unhealthy.
6 SUGGESTION
This financial health assessment model can be applied
to companies for assessing their company’s financial
health in the next year or in the next two years.
Company’s managers should make efforts in
increasing company’s profitability by increasing
sales and other sources of income as well as carrying
out activities that might add value to the company so
as expenses can be reduced. A negative net income
will cause negative retained earnings, thus leaving
company's equity negative.
Company managers should be aware of any
increase in liabilities as it can potentially reduce
company’s financial health. Companies have to
consider taking debt, especially debt in foreign
currencies whose value might go up when Indonesian
Rupiah is weakening.
Prospective creditors and potential investors can
use this model to make funding decisions and funds
investment. In so doing, investors who have invested
in company shares can assess the company’s health to
review their investment portfolio.
REFERENCES
Altman, Edward I, Robert G. Haldeman, and P. Narayanan.
(1977). Zeta
TM
Analysis – A New Model to Identify
Bankruptcy Risk Corporations. Journal of Banking and
Finance, 1, 29-54.
Altman, E.I., Iwanicz-Drozdowska, M., Laitinen, E.K. and
Suvas, A. (2017). Financial distress prediction in an
Financial Health Assessment Model for Listed Companies in Indonesia
131

international context: a review and empirical analysis
of Altman’s Z-score model. Journal of International
Financial Management & Accounting, 28(2), 131-171.
Arasu, R., Balaji, C.D., Kumar, S.P., and Thamizhselvi, N.
(2013). Applicability of Fulmer and Springate Models
for Predicting Financial Distress of Firms in the
Finance Sector – An Empirical Analysis. Journal of
Finance and Risk Management, 4(1), 1-9.
Bal, Jay., Yen Cheung, and Hsu-Che Wu. (2013). Entropy
for Business Failure Prediction : An Improved
Prediction Model for the Construction Industry.
Advances in Decision Sciences, 1-14.
Csikosova, Adriana., Janoskova, Maria, and Culkova,
Katarina. (2019). Limitation of Financial Health from
Post-Communist Countries. Journal Risk Financial
Management, 12(15), 1-14
Fachrudin, Khaira Amalia. (2007). Analisis Kesulitan
Keuangan Perusahaan – Studi pada Perusahaan
Manufaktur yang Terdaftar di Bursa Efek Jakarta
Tahun 1995 – 2005. (Unpublish Doctoral Dissertation).
Universitas Brawijaya, Malang, Indonesia.
Javaid, Muhammad Irfan and Javid, Attiya Yasmin.
(2018). Efficacy of Going Concern Prediction Model
for Creditor Oriented Regime via Liquidation - a MDA
Approach. Journal of Applied Accounting Research,
19(4), 552-573.
Jordan, J.L. (1998). Evaluating Water System
Performance and Financing Options. Georgia Water
Series, 3, 1-23.
Huo, Yang Hwae. (2006). Bankruptcy Sitiation Model in
Small Business : the Case of Restaurant Firms.
Hospitality Review, 2(24), 49-58.
Kumari, Nilanjana. (2013). Evaluation of Financial
Health of MMTC of India : A Z Score Model. European
Journal of Accounting and Finance Research, 1(1), 36-
43.
Nketiah, Ebenezer Tuffour. (2017). Analyzing Investment
Decisions Using Altman’s Model to Predict
Organizational Financial Distress. (Doctoral
Dissertation). Capella University, United Sttaes of
Ammerica.
Ross, Stephen A, Westerfield, Randolh W., and Jaffe,
Jeffrey. (2013), Corporate Finance, Tenth edition,
McGraw Hill Irwin.
Sinarti and Sembiring, Tia Maria. (2015). Bankruptcy
Prediction Analysis of Manufacturing Companies
Listed in Indonesia Stock Exchange. International
Journal of Economics and Financial Issues, 5, 354-359
Springate G L. (1978). Predicting the Possibility of Failure
in a Canadian Firms. (Research Project). Simon Fraser
University, Canada.
Sriram, Ram S. (2008). Relevance of Intangible Assets to
Evaluate Financial Health. Journal of Intellectual
Capital, 9(3), 351-366.
Parvin, Afroza., Rahman, Benazir., and Nitu, Alrafa Akter.
(2013). Prediction of Financial Health of Banking
Industry in Bangladesh Using Altman’s Z Score : A
Comparison Between State-Owned Commercial Banks
and Private Commercial Banks. Proceeding of the
International Conference for Bankers and Academics,
335 – 344.
Tuckman, H.P., and Chang, C.F. (1991). A methodology
for measuring the financial vulnerability of charitable
nonprofit organizations. Nonprofit and Voluntary
Sector Quarterly, 20(4), 445-460.
Yakymova, Larysa., and Kuz, Vasyl (2019). The Use of
Discriminant Analysis in the Assessment of Municipal
Company’s Financial Health. Recent Issues in
Economic Development, 12(2), 64 - 78.
Zmijewski, Mark Eugene. (1984). Essay on Corporate
Bankruptcy. (Doctoral Dissertation). University of
New York.
EBIC 2019 - Economics and Business International Conference 2019
132
