
Free Cash Flow, Investment, Capital Structure and Firm Value
Rina Br. Bukit
1,*
, Sri Mulyani
1
, Fahmi N. Nasution
1
,
Richard Chinomona
2
1
Department of Accounting, Universitas Sumatera Utara, Jl. Prof. T.M Hanafiah, SH, Kampus USU, Medan, Indonesia
2
Faculty of Commerce, Law and Management, School of Business Sciences, University of the Witwatersrand,
Johannesburg, South Africa
Keywords: Firm Value, Free Cash Flow, Investment Level and Capital Structure
Abstract: Shareholders are very interested in the company's performance and prospects, which are generally referred to
as company value. Information of corporate value declining is not mitigated by companies that have many
stakeholders. Literature shows that the following factors have an impact on company values such as free cash
flow, investment and capital structure. Decreasing the value of the company can endanger all parties including
investors. A supervisory system for company management decisions is needed to reduce losses and adverse
effects of a decrease in company value. However, in-depth research on corporate value models that are
influenced by free cash flow and investment through capital structures is still rarely done. The purpose of the
study was to examine the effect of intervening variable of capital structure in the relationship between free
cash flow and investment with firm value. The research population is non-banking companies listed on the
Indonesia Stock Exchange in 2014-2016. The dependent variable of this study is company value and the
independent variable is free cash flow and investment. Intervening variable is capital structure. Control
variable is company size, audit quality and company growth. The results of multiple regression analysis show
that free cash flow and investment have a positive effect on firm value. The results of this research also show
that free cash flow and investment have a negative effect on capital structure. However, this study did not find
the effect of capital structure on firm value. Hence, capital structure does not play a role as an intervening
variable between free cash flow and investment with firm value.
1 INTRODUCTION
Research on company value is important, which
relates to the level of welfare of shareholders and the
views of corporate stakeholders regarding future
corporate prospects. Companies need to make
effective decisions and take appropriate actions so
that the company continues to survive with high
profits and prosperity (Salvatore, 2005). The ratio of
stock price and book value per share is one illustration
of firm value (Ang, 1997). The firm stock price may
be above or below of its book value which illustrate
the investor's view of the company.
There are several factors affect the value of the
company such as free cash flow, investment and
capital structure. The first factor is free cash flow. The
excess cash can be used for dividend payment or
investment activity. The decision to use this free cash
flow may cause agency conflict (Jensen & Meckling,
1976; Jensen, 1986). Dividend distribution correlates
with the level of welfare of shareholders. But the
value of the company decreases if management uses
free cash flow in investment activities to safeguard its
own personal interests. 0n the other side, profitable
investment activities can improve shareholder
welfare and company value (Perfect, Peterson, &
Peterson, 1995; Richardson, 2005). Thus, effective
use of free cash flow may increase company value
The second factor is investment. The company's
investment activities should have a positive impact on
the value of the company. This investment activity
may bring the higher future cash flow, superior
company competitiveness or new business areas
(Agrawal & Zong, 2006). Therefore, a higher level of
investment may create higher corporate value.
Then, the third factor is capital structure. The
company's capital structure is not only covering
equity value, but also all financial sources including
debt. Debt is one of the financial resources in the
company. Debt is also a tool used by companies to
increase their capital in order to increase profits
(Chowdhury & Chowdhury, 2010). Ogbulu and
Emeni (2012) suggest that long-term debt has more
roles in determining the value of a company than
122
Bukit, R., Mulyani, S., Nasution, F. and Chinomona, R.
Free Cash Flow, Investment, Capital Structure and Firm Value.
DOI: 10.5220/0009200001220126
In Proceedings of the 2nd Economics and Business International Conference (EBIC 2019) - Economics and Business in Industrial Revolution 4.0, pages 122-126
ISBN: 978-989-758-498-5
Copyright
c
2021 by SCITEPRESS – Science and Technology Publications, Lda. All rights reserved
equity, especially in a country with a growing
economy such as Nigeria.
Past study showed that firm size, audit quality and
firm growth influence firm value. This study also tests
firm size, audit quality and firm growth as control
variables. First, company size can be expressed by
total assets or total net sales. Assets are all resources
and assets owned by the company for use in its
operations. The size of the company is considered
able to influence the value of the company. Because
the larger the size or scale of the company, the easier
it will be for the company to obtain funding sources
both internal and external. Firm size is stated to be
positively and significantly related to firm value
(Bukit, Haryanto, & Ginting, 2016).
Second, audit quality is related to the quality of
company profits. Past study (for example, Alfraih,
2016) supported that the better the quality of external
auditors used by a company, the better the quality of
the value relevance of financial reporting. The
amount of large costs incurred to utilize external
auditor quality is worth the results of the audit
produced. Therefore audit quality is considered
capable of increasing the value of the company.
Third, the company's growth also affects the value
of the company. Companies with high growth rates
are relatively easy to access the capital market. A high
growth company shows its ability to increase the
company value. For example, (Bukit, Haryanto, &
Ginting, 2016) suggest that firms with high growth
rate influence firm value in a positive and significant
way. In this study, company size, audit quality and
company growth are control variables. The purpose
of this research is twofold: First, to tests the effect of
free cash flow, investment and capital structure on
firm value. Second, this study aims to examine the
effect of free cash flow and investment through
capital structure.
2 CONCEPTUAL FRAMEWORK
AND HYPOTHESES
Agency theory explains that the use of excess cash
raises the potential for conflicts of interest where the
excess money is intended for activities that bring their
personal benefits that may be in line or not in line with
the interests of shareholders (Jensen 1986; Jensen &
Meckling 1976; Chung et al. 2005). Previous research
states that companies that have free cash flow tend to
be involved with activities that do not increase the
value of the company; this is predicted in the theory
of free cash flow (Ang et al. 2000; Jensen 1986).
Research needs to be conducted to examine the effect
of free cash flow, investment and capital structure on
firm value. Based on the prior arguments, this study
show that free cash flow and investment affect capital
structure, and subsequently capital structure is also
related to firm value. Therefore, this study argues that
capital structure mediates the relationship between
free cash flow and investment on firm value. The
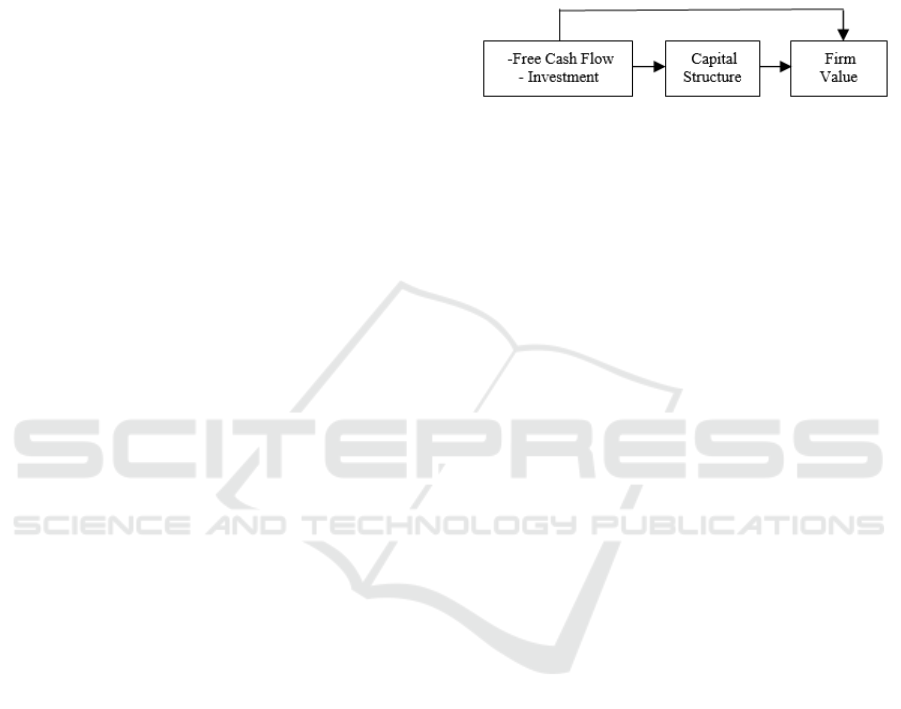
research framework is shown as follows (see in
Figure 2.1):
Figure 2.1: Firm Value Model
Furthermore, based on the explanation above, this
study develops several hypotheses as follow
H1. Free cash flow, investment and capital
structure are associated with firm value
H2. The effects of free cash flow and investment
on firm value are mediated by capital structure
3 METHOD
3.1 Population and Sample
The population of this study is all non-banking
companies listed on the Indonesia Stock Exchange
during 2014-2016. The selection and collection of
sample data needed in this study was conducted by
purposive sampling. The data analysis method used
in this study is Multiple Regression Analysis with
multiple path analysis.
3.2 Type and Method of Data
Collecting
This study uses secondary data which is collected
from annual reports and published financial reports,
books, and scientific journals related to this research.
Data is obtained from the internet by downloading the
required data by accessing it from the Indonesia Stock
Exchange website (www.idx.com), www.ssrn.com,
www.search.proquest.com, and the website of each
company.
3.3 Variable Definition and
Operationalization
Operational definitions and variable measurements
are shown in Table 4.1 (please see Appendix 1)
Free Cash Flow, Investment, Capital Structure and Firm Value
123

3.4 Method of Data Analysis
Data analysis method is a multiple regression analysis
model. Before data analysis is performed, the
classical assumption test is carried out which includes
normality test, multicollinearity test,
heteroscedasticity test and autocorrelation test. First,
the data normality test is done by probability plot
analysis and the Kolmogorov-Smirnov test. If the
probability is> 0.05 then the data distribution is
normal and if the probability is <0.05 then the data
distribution is not normal. Secondly, a
multicolinearity test is run to examine the correlation
between independent or independent variables that
are expected to not exceed 0.8 (Gujarati, 2003).
Third, heteroscedasticity test aims to test whether in
the regression model there is a variance inequality
from residual observation to another observation. If
the variance from residual one to another observation
remains, then it is called homoscedasticity and if it is
different is called heteroscedasticity. Fourth, the
autocorrelation test aims to test whether in a linear
regression model there is a correlation between
confounding errors in period t with errors in periods
t-1 or earlier.
3.5 Research Model
The first hypothesis will be tested with the regression
equation 1 as follows:
Y= b
0
+ b
1
X
1
+ b
2
X
2
+ b
3
X
3
+ CV +ε
......……… Equation 1
Where:
Y = Firm value
X
1
= Free cash flow
X
2
= Investment
X
3
= Capital structure
X
c1-c3
= Control variables
b
1
– b
3
= beta of each variable
ε = Error Term
The second hypothesis will be tested by the four
steps Baron and Kenny (1986) approach.
4 RESULTS
4.1 Descriptive Statistics
Descriptive statistics provide a general description of
the object of research sampled. Explanation of data
through descriptive statistics is expected to provide an
initial description of the problem under study (see
Table 4.1, in Appendix).
4.2 Correlation Coefficient
This study conducted the correlation coefficient test
between independent variables. Table 4.2 (see in
Appendix) shows the highest correlation coefficient
is between the variable of free cash flow and
investment which is -0.164 where the correlation
coefficient number is still below 0.8 (Gujarati, 2003).
Thus it can be concluded that in this research model
there is no problem of multicollinearity.
4.3 Research Regression Results
The results of this research also show that free cash
flow and investment have positive effects on firm
value. Hypotheses 1 is supported. This study also
finds that free cash flow and investment have
negative effects on capital structure. This study finds
the positive effect of capital structure on firm value.
However, the coefficients of free cash flow and
investment are still positive and significant in Model
4; it means that capital structure does not play a role
as fully mediating variable between free cash flow
and investment with firm value. (Please see Table 4.3
in the Appendix).
5 CONCLUSION
The results of this research also show that free cash
flow, investment and capital structure have positive
effects on firm value. However, capital structure does
not play a role as an intervening variable between free
cash flow and investment with firm value.
REFERENCES
Alfraih, M. 2016. The role of audit quality in firm valuation.
International Journal of Law and Management Vol.58
No. 5: 575-598.
Agrawal, R. &Zong, S. 2006. The cash flow–investment
relationship: International evidence of limited access to
external finance. Journal of Multinational Financial
Management 6(1): 89-104.
Ang, J. S., Cole, R. A. & Lin, W. J. 2000.Agency cost and
ownership structure.Journal of Finance 55: 81-106.
Chowdhury, Anup & Chowdhury, Suman Paul. 2010
Impact of capital structure on firm’s value: Evidence
from Bangladesh. Business and Economic Horizons.
Vol.3, Issue 3, pp. 111-122
Jensen, M. &Meckling, W. 1976. Theory of the firm:
Managerial behavior, agency costs, and capital
structure. Journal of Financial Economics3: 305–360.
EBIC 2019 - Economics and Business International Conference 2019
124

Jensen, M.C. 1986. Agency costs of free cash flow,
corporate finance and takeovers. American Economic
Review 76: 323-329.
Ogbulu, Onyemachi Maxwell & Emeni, Francis Kehinde,
2012. Capital Structure and Firm Value: Empirical
Evidence from Nigeria. International Journal of
Business and Social Science. Vol. 3 No. 19
Perfect, S.B., Peterson, D.R. & Peterson, P.P. 1995. Self-
tender offers: The effects of free cash flow, cash flow
signaling, and the measurement of Tobin's q. Journal of
Banking & Finance 19(6): 1005-1023.
Richardson, S. 2005. Over-investment of free cash flow.
Working Paper. University of Pennsylvania.
Rina Bukit, Bode Haryanto, &P Ginting. 2016.
Environmental performance, profitability, asset
utilization, debt monitoring and firm value, IOP
Conference Series: Earth and Environmental Science
Salvatore, Dominick. 2005. Ekonomi Manajerial dalam
Perekonomian Global. 5
th
Ed, Salemba Empat: Jakarta.
APPENDIX
Descriptive Statistics
Table 4.1: Descriptive Statistics
N
Minimu
m
Maximu
m
Mean Std. Deviation
FIRM
_
SZ 382 12,230 33,650 27,460 3,184
AUDIT
_
QLT 382 0,000 1,000 0,393 0,489
GROWTH 377 -58,450 192,250 18,767 39,936
FCF 377 -1,150 0,330 -0,008 0,158
INV 377 -1,000 3,210 0,138 0,525
DER 377 0,030 5,060 0,584 0,625
FIRM
_
VALUE 382 0,080 23,180 1,813 2,927
Valid N
(listwise) 375
Correlation Coefficient
Table 4.2. Correlation Coefficient
FIRM
_
SZ AUDIT
_
QLT GROWTH FCF INV DER FIRM
_
VALUE
FIRM
_
SZ 1
AUDIT
_
QLT 0,061 1
GROWTH 0,090 -0,033 1
FCF -0,013 0,084 0,074 1
INV 0,021 0,035 -0,017 -0,164 1
DER -0,126 -0,102 -0,114 -0,055 -0,157 1
FIRM
_
VALUE 0,150** 0,130* 0,117* 0,092 0,118* 0,050 1
Free Cash Flow, Investment, Capital Structure and Firm Value
125

Regression Results
Table 4.3. Regression Analysis Results
Model 1
DV :
Firm Value
Model 2
DV :
Capital
Structure
Model 3
DV :
Firm Value
Model 4
DV :
Firm Value
Constant
Independent
Variable
Free Cash
Flow
Investment
Mediating
Variable
Capital
Structure
Control
Variable
Firm Size
Audit Quality
Growth
-2,064
(-1,609)
1,847
(1,914) *
0,724
(2,534) **
0,124
(2,649)***
0,669
(2,190) ***
0,008
(2,008) ***
1,262
(4,622) ***
-0,295
(-1,435)
-0,198
(3,256)***
-0,021
(-2,122) **
-0,105
(-1,613)
-0,002
(-2,045)**
-2,587
(-1,953)*
0,446
(1,839)*
0,134
(2,831)***
0,807
(2,630)***
0,009
(2,294)**
-2,798
(-2,134)**
2,018
(2,099)**
0,839
(2,915)***
0,582
(2, 393)**
0,136
(2,913)***
0,730
(2,397)**
0,008
(2,263)**
R
2
Adj
F
Prob F
0,071
0,058
5,636
0,000
0,064
0,051
5,058
0,000
0,058
0,047
5, 663
0,000
0,085
0,070
5,711
0,000
EBIC 2019 - Economics and Business International Conference 2019
126
