
Social Economic Perception and Status towards the Behavior of
Customers of Islamic Banking Financial Services Users
Doli Muhammad Ja’far Dalimunthe, Yeni Absah, Tetty Yuliaty
Faculty Economics and Business, Universitas Sumatera Utara
Keywords: Socio-Economic Status, Perception, Religious Attitudes, Behavior, Syariah Banks.
Abstract: The rapid development of Islamic banking in Indonesia, still considered relatively low when compared to other
Islamic countries such as Malaysia and Saudi Arabia, with a market share of around 20% and 53% of the total
domestic banking market. This is due to the low interest of the community to become Syariah banking
customers due to the lack of public understanding of Syariah banking.The purpose of this study is to determine
the cause of the lack public interest to transact through Syariah banking by looking at the influence of
perceptions and socio-economic status of behavior, especially Syariah bank customers. Data collected through
interviews and questionnaires. The data analysis technique used is path analysis. The results show that socio-
economic status has a positive and significant effect on religious attitudes and behavior. Perception has a
significant positive effect on religious attitudes but does not have an influence on behavior and religious
attitudes have a significant positive effect on behavior. Status has a significant positive effect on behavior
mediated by religious attitudes. Perception has a significant positive effect on behavior mediated by religious
attitudes.
1 INTRODUCTION
The growth of Islamic banking in June 2018 showed
a positive and intermediation improved with an
increase in assets, funding channeled (PYD), and
third-party funds (DPK) higher than the same period
the previous year. The performance of Islamic banks
in June 2018 generally improved compared to the end
of 2017 indicated by the key financial ratios, baikdari
sisilikuiditas, efficiency, profitability, and capital,
which showed improvement. Sources from the FSA
can be seen the number of CAR of 20.59% and ROA
of 1.69%.
Although the growth of Islamic banking sector
continued to grow during the past few years, the total
market share of Islamic Banks and Islamic Business
Unit reached 5.70% of total banking sector in June
2018. The market share is considered to be relatively
low when compared to other Islamic countries with
the population and economic level are much smaller,
namely Malaysia and Saudi Arabia. Various reasons
can be known as socioeconomic status communities
are low making it difficult to get an understanding,
education especially low incomes so that they do not
feel the need to relate to Islamic banks.
Perception felt important, because perception is a
process when individuals organize and interpret their
sensory impressions in order to give meaning to their
environment. Customer perception is closely related
to their religious attitude that what is done by the
customer is an objective reality that will affect their
behavior to use the services of Islamic banking.
Human behavior is a form of reaction to an object
of one's feelings in this regard Islamic banking.
Attitude is a preparatory act / acts in a certain
direction. In the form of supportive attitude
(favorable) or feelings of support (unfavorable)
which has three components: cognitive, affective and
behavioral. Religious attitude is a state where each
commit oneself on activities always associated with
religion. Thus usually every community that has a
high religious attitudes will tend to apply it. So proper
to if the people of Indonesia, especially in the field
which generally have a high religious attitude will
change his attitude towards Islamic banks in that they
would be interested to become customers of Islamic
banks.
Likewise, customer attitudes towards flowers and
the results are very diverse, so from a variety of these
attitudes give the feel is quite interesting as a picture
of perception, economic and social status of religious
attitudes and behavior of the community in dealing
with Islamic banking. While Islamic banks with
profit-sharing system does not provide certainty as
Ja’far Dalimunthe, D., Absah, Y. and Yuliaty, T.
Social Economic Perception and Status towards the Behavior of Customers of Islamic Banking Financial Services Users.
DOI: 10.5220/0009199901170121
In Proceedings of the 2nd Economics and Business International Conference (EBIC 2019) - Economics and Business in Industrial Revolution 4.0, pages 117-121
ISBN: 978-989-758-498-5
Copyright
c
2021 by SCITEPRESS – Science and Technology Publications, Lda. All rights reser ved
117
conventional bank interest income provide revenue
certainty. As a result of socioeconomic status,
perception so that ultimately affect the religious
attitudes and behavior of prospective customers in the
use of financial services in Islamic banking.
Formulation problems of this study are as follows:
1. How to influence customers' perception of
religious attitudes in using financial services of
Islamic banking?
2. How does the influence of Socio-Economic Status
of the Religious Attitude customers in using
financial services of Islamic banking?
3. How will influence customers' perception of
Conduct in using financial services of Islamic
banking?
4. How does the influence of Socio-Economic Status
of the behavior of customers in using financial
services of Islamic banking?
5. How do the religious attitude towards behavior of
customers in using financial services of Islamic
banking?
2 METHODOLOGY OF
RESEARCH
The method used is quantitative tool hypothesis
testing is using path analysis. Path analysis (path
analysis) is an extension of the multiple linear
analysis, or the use of regression analysis to estimate
the causal relationships between variables that have
been set previously by the theory (Ghozali, 2013).
The data analysis technique used isBased Component
Structure Equation Model (SEM) with a program
Generalized Structured Component Analysis (Web
GeSCA) version 1.5.
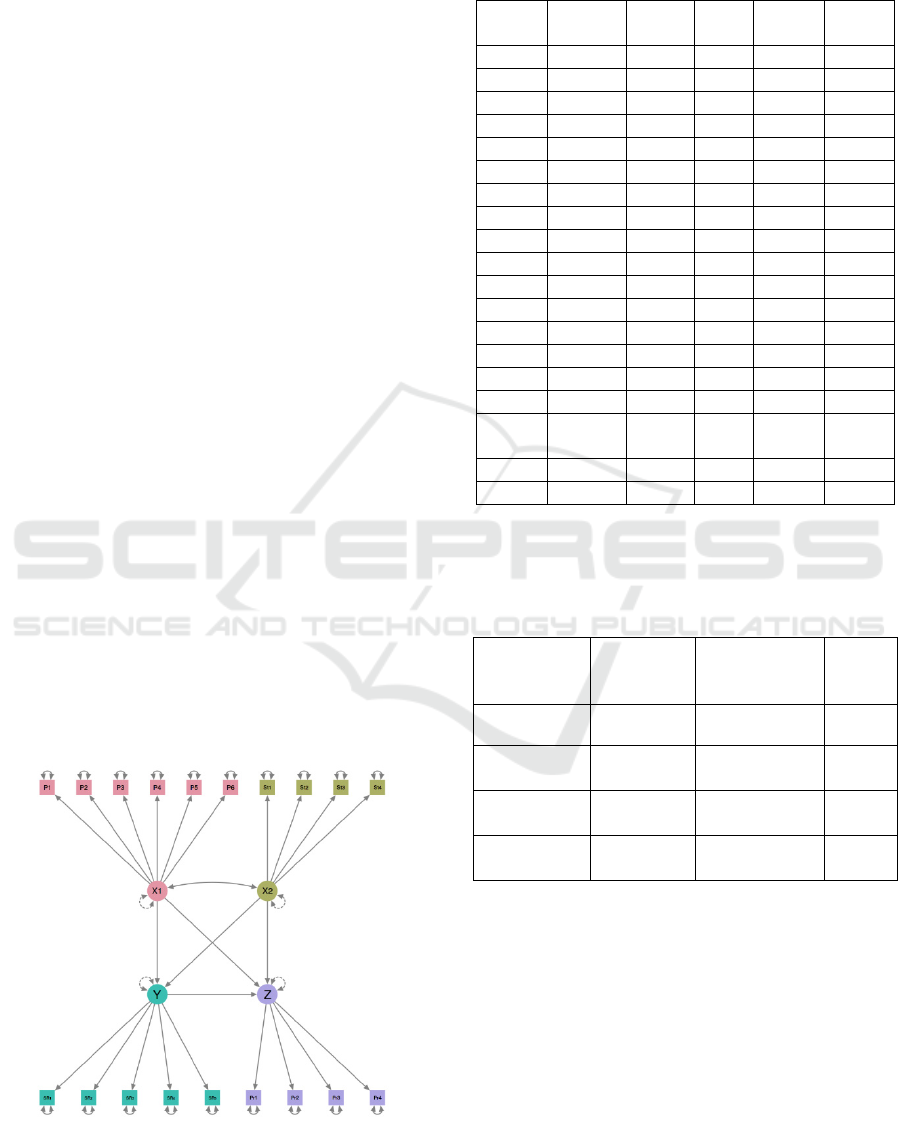
The research model can be seen as follows:
3 RESULT AND DISCUSSION
Here are the results of testing the validity of:
estimate
Std.
Error
t-
value
95%
CI_LB
95%
CI_UB
P1 0.5606 0089 6:30 0359 0.6837
P2 0.7482 0059 12.68 0612 0.8192
P3 0.7006 0.0599 11.70 0.5447 0.7934
P4 0.7476 0.0454 16:47 0.6413 0.8167
P5 0645 0.0772 8:35 0.5056 0806
P6 0.6679 0.0585 11:42 0:54 0.7602
st1 0.7655 0.0454 16.86 0672 0842
ST2 0833 0.0257 32.41 0.7766 0.8764
St3 0.8493 0.0184 46.16 0.8171 0.8852
ST4 0.6825 0.0488 13.98 0.5917 0.7771
SR1 0.7447 0.0321 23:20 0675 0.8068
SR2 0.7966 0.0313 25.45 0.7244 0.8488
SR3 0.7612 0.0357 21:32 0.6892 0.8247
SR4 0.8061 0.0401 20:10 0.7174 0.8745
SR5 0.81 0.0318 25.47 0.7326 0.8655
pr1 0.6903 0.0517 13:35 0.5779 0772
comply
pr2
0.7887 0.0372 21:20 0.7172 0.8566
Pr3 0.8189 0.0292 28.04 0.7589 0.8839
pr4 0.7402 0.0549 13:48 0.6085 0825
At a confidence level of 95% or 5% alpha and df 198
then table-t of 1,653. According to the table above, it
can be seen that all the indicators have values –t above
1,653, so it declared invalid. Here are the results of
reliability testing:
variables
Cronbach's
Alpha
Dillon-
Goldstein's
rho
AVE
X2 (Status) 0.7896 0.8647 0.6167
X1
(Perception)
0.7664 0.8375 0.4643
Y (Religious
Attitude)
0843 0.8886 0.6149
Z
(Behavior)
0.7556 0.8458 0.5792
Based on the above table, the variables of
perception, status, religious attitudes, and behaviors
declared reliable by Cronbach's Alpha value and
Dillon-Goldstein's rho greater than 0.6. Although the
value of the variable AVE perception of less than 0.5,
but the indicator status, religious attitudes, and
behaviors value is above 0.5. So that all variables can
be inferred been reliable.
1. Measurement of Fit Testing Model
Testing of this model can be seen in the following
table:
EBIC 2019 - Economics and Business International Conference 2019
118

Measur
e
Std.
Error
Informatio
n
FIT 0.4962
0.020
9
Well
Adjusted FIT
(Afit)
0.4904
0.021
1
Well
GFI 0.9851
0.001
9
Well
Standardize
d Root Mean
Square
(SRMR)
0.1158
0.012
1
Pretty good
Based on the model FIT goodness table, it can be
seen that:
a. FIT shows the total variance of all the variables
described by the model specification. FIT Values
range from 0 to 1. FIT value generated in this study
was 0.4962. That is, the value of the variance of the
data can be explained by the model is equal to
49.62%.
b. AFIT is developed from FIT test values value,
because the value of FIT is strongly influenced by
the complexity of the model. Afit value generated in
this study amounted to 0.4904 or 49.04%, which
means good models to explain the phenomenon
being studied.
c. GFI value is the value Unweight Least Square,
which aims to test whether the resulting model
describes the actual conditions. GFI is a range
of values on a 0 (poor fit) to 1 (good fit). GFI
value generated in this study was 0.9851, this
indicates that the model used in the study is
very appropriate because GFI value close to 1.
d. If SRMR value close to 0 then it indicates the
suitability of the overall model. SRMR value
generated in this study was 0.1158.
2. Analysis of R-Square
Results of analysis of the R-square value can be seen
in the table below:
X1 0
X2 0
Y 0337
Z 0.4316
R-square value on religious attitude variable (Y)
equal to 0.337 so that it can be said that variations in
religious attitudes afford described by state variables
(X1) and perception (X2) is 0.337 or 33.7%. While
the behavioral variables (Z) has the R-square value of
0.4316 so that variations in behavior were able to be
explained by variable status (X1) and perception
(X2), and the religious attitude (Y) equal to 0.4316 or
43.16%. The rest is explained by other variables not
examined or incorporated into the model.
3. Direct Impact Hypothesis Testing
Hypothesis testing direct influence can be seen from
the table below:
estimate
Std.
Error
t-value
95%
CI_LB
95%
CI_UB
Informatio
n
-
X
1
0.3306 0.0868 3,809 0:16 0.4865 Significant
-
X
1
0.2602 0.0826 3:15 0.1211 0.4591 Significant
-
X
2
0.3599 0.0745 4,831 0.2262 0.5007 Significant
-
X2
0.1242 0.0861 1,442
-
0.0554
0.2717
Not
significant
- Y
0.4108 0.0848 4,844 0.1888 0.5576 Significant
Based on the table above, it can be obtained
directly influence the results of hypothesis testing as
follows:
Hypothesis 1, Effect of Status (X1) on Religious
Attitudes (Y)
Status has a significant positive effect on religious
attitudes with coefficient 0.3306 and t-value of 3.809.
That is, the higher the socio-economic status, the
attitudes of religious communities is increasing. As
perceived by Purwanto (1990), the tendency to react a
certain way to a stimulus in accordance with the
situation. In this case the person becomes
perangsangnya status to be more religious.
Hypothesis 2 Effect of Status (X1) to Behavior
(Z)
Status has a significant positive effect on the
behavior of the coefficient of 0.2602 and a t-value
of 3.15. This shows that the existing status of a
person it would be easy to act in accordance with
her wishes. As perceived by Prasetijo and Ihalauw
(2005), the behavior is about how the decision-
makers make the decision to buy or transact a
product and taking it where it is supported by its
status.
Hypothesis 3, Influence Perception (X2) on
Religious Attitudes (Y)
Perception has a significant positive effect on
religious attitudes with coefficient 0.3599 and t-
value of 4.831. That is, the greater the public
perception that the religious attitude is increasing. As
perceived by Asshidin (2016) that the attitude of a
person's tendency toward an object or idea and
evaluate the value of a feeling about something.
Social Economic Perception and Status towards the Behavior of Customers of Islamic Banking Financial Services Users
119

Hypothesis 4, Influence Perception (X2) on the
behavior of (Z)
Perception has no influence on the behavior of the
coefficient of 0.1242 and a t-value of 1.442. This
shows that the higher the public perception will not
affect the behavior without the support of their
awareness of the personal and the person concerned.
In accordance with that presented by Kotler and
Armstrong (2008), which encourages a person to
love, toward or away from something is not a
perception but an attitude.
Hypothesis 5, Effect of Religious Attitude (Y)
to Behavior (Z)
Religious attitudes had a significant positive effect
on the behavior of the coefficient of 0.4108 and t-
value is at 4.844. That is, the higher the religious
attitude of society then the behavior is also
increasing. According to the dictionary Chaplin
stated trends are relatively stable and continues to
behave or react in a certain way is the foundation of
attitude,
4. Effect Hypothesis Testing Not Live
Hypothesis testing indirect influence can be seen
from the table below:
esti
mate
Std
. Error
t-
value
Inform
ation
Z
~
X1
0.14
78
0.0
436
3:
39
Signific
ant
Z
~
X2
0.13
58
0.0
466
2,
914
Signific
ant
Based on the table above, then the hypothesis test
results can be obtained indirect effect as follows:
Tests of Hypotheses 6, Effect of Status (X1) to
Behavior (Z) mediated by religious attitude (Y)
Test results obtained by the t-value of 2.914, which
means the value is greater than t-table 1.653. It can
be concluded that the status has a significant positive
effect on behavior mediated by religious attitudes.
This indicates that the status based on the religious
attitude will encourage positive behaviors. Due to
the status of a person in the community and religious
attitude will keep him away from bad thoughts and
bad behavior anyway.
Hypothesis 7, Influence Perception (X2) on the
behavior of (Z) mediated by religious attitude
(Y)
Test results obtained by the t-value of 3.39, which
means the value is greater than t-table 1.653. It can
be concluded that the perception has a significant
positive effect on behavior mediated by religious
attitudes. This shows that the perception which was
followed by a religious attitude will give you the idea
that the behavior captured is a good and right
decision because in accordance with his beliefs.
4 CONCLUSIONS
The results showed that, the Status has a significant
positive effect on religious attitudes. As perceived by
Purwanto (1990), the tendency to react a certain way
to a stimulus in accordance with the situation. In this
case the person becomes perangsangnya status to be
more religious. The higher the person's position in
society, the better the attitude of religious feeling
becomes a role model for people - the people around
him.
Status has a significant positive effect on
behavior. As perceived by Prasetijo and Ihalauw
(2005), the behavior is about how the decision-
makers make the decision to buy or transact a product
and taking it where it is supported by its status.
Perception has a significant positive effect on
religious attitudes. As perceived by Asshidin (2016) that
the attitude of a person's tendency toward an object or
idea and evaluate the value of a feeling about something.
Perception has no influence on behavior In
accordance with that presented by Kotler and Armstrong
(2008), which encourages a person to love, toward or
away from something is not a perception but an attitude.
Religious attitudes had a significant positive effect
on behavior. According to the dictionary Chaplin stated
trends are relatively stable and continues to behave or
react in a certain way is the foundation of attitude,
Status has a significant positive effect on behavior
mediated by religious attitudes. This indicates that the
status based on the religious attitude will encourage
positive behaviors. Due to the status of a person in the
community and religious attitude will keep him away
from bad thoughts and bad behavior anyway.
Perception has a significant positive effect on
behavior mediated by religious attitudes. This shows
that the perception which was followed by a religious
attitude will give you the idea that the behavior captured
is a good and right decision because in accordance with
his beliefs.
REFERENCES
Abdulsyani, (2007). Sociology, schematic, Theory, and
Applied. Jakarta: PT.Bumi. Script.
Asshidin NHN, Abidin Borhan N. and HB. 2016. Consumer
attitude towards international products and uniqueness.
Procedia Journal of Economics and Finance, 35, 632-
638.
EBIC 2019 - Economics and Business International Conference 2019
120

Ary Gina Agustin, ESQ Power Generating Success Secrets:
An Inner Journey Through Ihsan, (Jakarta: ARGA,
2003), Hal.249
Candraditya H. and Idris. 2013. Analysis of Usage of
Electronic Money: A case study on product users Flazz
BCA student at the Faculty of Economics and Business,
University of Diponegoro. Diponegoro Journal of
Management, 2, 1-11.
Ghozali, I. (2013). Applications Multivariate Analysis With
SPSS Program. Semarang: Diponegoro University
Publishers.
Kotler, Philip and Gary Armstrong. 2008. Principles -
Principles of Marketing. Volume 12. Issue 1. Jakarta:
Erlangga.
Kotler, P., & Keller, KL (2012). Marketing Management.
Jakarta: Erland.
M. Ngalim Purwanto, Educational Psychology, (Bandung:
PT. Youth Rosda paper, 1990), p. 141.
Muhammad Alim, Islamic Education, (Bandung: PT Young
Rosdakarya,
Prasetijo, Ristiyanti and John Ihalauw. 2005. Consumer
Behavior. Yogyakarta: Andi.
Schiffman, LG, & Kanuk, LL (2009). Consumer behavior.
Jakarta: PT Gramedia Group Index.
Sitorus, (2000). Acquainted with Sociology. Jakarta: Erland
Sumardi, M. (2004). Poverty and Necessity, Jakarta:
Rajawali Jakarta.
Sumarwan U. 2014. Consumer Behavior: Theory
application in marketing. Bogor: Ghalia Indonesia.
Walgito, Ben. 2003. An Introduction to Social Psychology.
Yogyakarta: Andi Offset.
Social Economic Perception and Status towards the Behavior of Customers of Islamic Banking Financial Services Users
121
