
High Risk High Return? Empirical Testing of Prospect Theory in
Indonesia
Rini Setyo Witiastuti, Kris Brantas Abiprayu, and Ascariena Rafinda
Department of Management, Universitas Negeri Semarang, Gedung L2 Fakultas Ekonomi UNNES, Gunungpati, Semarang
Keywords: Financial Behaviour, Prospect Theory, Risk-return
Abstract: The purpose of this research is to examine the prospect theory which show negative relation between risk and
return as opposed to conventional view of “high risk high return” belief. We are testing the firm’s behaviour
regarding their decision making under specific circumstances. We expect firm which underperform will show
risk seeking behaviour and vice versa, which will prove the prospect theory. Using the data form 2005-2012,
the samples in our research are all companies listed in Indonesian Stock Exchange. The result form our model
shows robust and consistent evidence that support the prospect theory. We find that firm that perform under
their competitor within industry (which shown by ROE/ROA lower than median industry) show a significant
negative risk and return relation. We also find that within industry regression, the negative relation between
risk and return still consistent with the base model. And lastly, in the annual regression, almost all period
shows negative significant relation between risk and return. All of the result strongly support premise that
argue most individuals are loss averse, then perform prospect theory behaviour.
1 INTRODUCTION
During its development, research in the field of
finance starting to give more contribution to the world
as it is. The current researches in academic finance
are usually referred to as traditional finance. The
foundation of traditional finance often associated
with Modern Portfolio Theory developed by
Markowitz (1952). Another backbone of standard
finance is known as the Efficient Market Hypothesis
and led the research in finance as we know nowadays.
Basically, the foundation of standard finance is under
the assumption that individual always making
rational decision making, which explained within the
frame of Expected Utility Theory. At some point,
Kahneman and Tversky (1979) emerge with this idea
called Prospect theory. The basic assumption of
Prospect Theory is that individual seldom rational, as
they have bounded rationality, a cognitive limitation
to absorb all necessary information available as
guidance when an attempt to make a decision. As this
happens, they will rely on their so-called “ruled of
thumb,” which allow them to decide faster although
it is often misleading.
We try to examine whether the relation between
risk and return will always be positively related as the
modern portfolio theory posit that high-risk always
result in high return. Under the prospect theory
presented by Kahneman and Tversky (1979), the
concept of high-risk, the high return will likely to be
violated since the theory state that the risk preference
in individual, will change relative to their current
position. Being in winning condition will be different
with if a person under losing condition, they likely to
be more risk seeker as they have more incentive to
avoid the loss.
Even though prospect theory was developed to
describe an individual to make a decision, it often to
predict the decision-making process within an
organization. And to make it clearer, Hambrick and
Finkelstein (1987) believe that, at some degree, the
performance of firm or organization in the long term,
will be determined by the decision made by an
individual running the firm so called manager. So, in
the end, the decision made by the manager will reflect
in their firm future performance.
Among many research in the earlier period is
Bowman (1980) posit an idea that the decision
makers in an organization, especially an organization
that their financial condition bad shape, have the
tendency to make a more risky decision under the
notion of that they have nothing to lose. Fiegenbaum
and Thomas (1988) study found evidence that
82
Witiastuti, R., Abiprayu, K. and Rafinda, A.
High Risk High Return? Empirical Testing of Prospect Theory in Indonesia.
DOI: 10.5220/0009199300820086
In Proceedings of the 2nd Economics and Business International Conference (EBIC 2019) - Economics and Business in Industrial Revolution 4.0, pages 82-86
ISBN: 978-989-758-498-5
Copyright
c
2021 by SCITEPRESS – Science and Technology Publications, Lda. All rights reserved

company with financial performance that lies below
the industry performance tend to be more aggressive
in risky condition. Beside those two, many have been
examined the firm decision making under irrational
behaviour as posited by Prospect Theory (Sinha
(1994), Lehner (2000), Chou et al (2009), Kliger and
Tsur (2011), Dominguez and Raïs (2012), Diez-
Esteban et al (2017), Gupta and Pathak (2018))
Most of the result from prior studies show some
consistencies. Which led to the conclusion of many of
the sample performing loss-aversion attitude.
Kahneman and Tversky (1979) explained that there
two decision factors when certain individual attempt
to make a decision, especially if the result from the
decision they made is a risky one. First, the deciding
factor of decision making isn’t the amount of utility
or benefit that an individual will acquire. Instead, they
will compare the results or output from their decision
to the target level that already been decided
beforehand. In other words, they already have a
certain level of expectancy over future results.
Second, people have a tendency to avoid loss. It is
better not to lose $1 that to get $1. The level of
satisfaction from losing $1 will be different, if not
worse, than to find $1. Those two conditions explain
why loss-aversion happened, and also shed some
answer on why companies that underperformed tend
to be bolder, in term of making risky decision.
In short, the Prospect Theory explained the
decision-making behaviour of the firm in regard to
their risk preference. The risk-return relation will be
varied depending on firm performance position or
condition. The condition that mentioned in Prospect
Theory is winning or losing condition. The line that
separates those two conditions is called a reference
point. This reference point is so important, yet
Kahneman and Tversky (1979) in their paper did not
mention how the reference point is conducted. Thus,
such fact will be one of the obstacles for the
researcher to examine or testing the Prospect Theory.
Even though they did mention that to determine the
reference point, we must find the line that separate
gains and losses which in the end affecting the
decision maker.
Most of the prior research which examined the
relation of risk and return under Prospect Theory
usually measured the reference point at the industrial
level by using the centre value of firm performance.
We try to find the evidence that decision maker
within the firm which performed below (lose) the
reference level would show some risk-seeking
attitude, which will be proven by the negative
association between risk and return. While the firm
that able to perform better than peer company within
the industry (above the reference point) will show
risk-averse attitude.
2 METHOD
The data used in this research are all of the public
companies (ousting the financial industry) in
Indonesia from 2005-2012 and acquired from
Bloomberg database. We use all of the data from
those periods without omitting the firm that delisting
or recently being public in order to avoid the
survivorship bias. The sequence that we do before
testing the regression model is: First, we have to
determine the reference point. Using the reference
point method from Kliger and Tsur (2011), we
measure the reference point as the median of firms’
industrial return from the previous year (lag one
year).
Ref
i, j, t
= Med
j, t-1
Table 1: Descriptive statistics by Industry
Table 2: Descriptive Statistics for ROA as Alternative
Proxy by Industry
Ref
i, j, t
is the reference point within the industry
that calculated each year, and Med
j, t-1
median ROE
of industry j at year t-1. So even though we used the
data from 2004-2012, we only managed to get an
eight-year span of data. In order to find the reference
point, firstly, we separate our sample into industrial
subsample data. Then, we find the median ROE of the
previous year.
To test our hypothesis, we used a model that
shows the relationship between risk and return. The
basic model is in the following equation:
Risk
i, j, t
= α + β Dumwin
I, j, t
+ ε
i, t
Risk
i, j, t
= ROE
i, j, t
- Med
j, t
Where Risk
i, j, t
is calculated by finding the
difference between ROE
i, j, t
(ROE is calculated from
firm net income divided with total equity) and
High Risk High Return? Empirical Testing of Prospect Theory in Indonesia
83

Median ROE industry in the same year. While
Dumwin
I, j, t
is dummy variable with the value of 1 if
the ROE
I, j, t
above the Ref
i, j, t
which indicate that firm
in winning condition relative to their industrial peer
.
The expected value of β in the base model is negative,
which will support the hypothesis in this paper.
The base model will be examined using several
adjustments. First is we use the complete sample to
test our hypothesis. Second, we separate our full
sample into industrial sub-sample and then test the
model using that sub-sample in each industry. Third,
we will conduct the annual cross-sectional regression
for each year in our sample from 2005-2012. The
configurations that we create is in an attempt to
eliminate the time- and industry-specific effects.
Lastly, we will conduct the three previous
configurations using the ROA performance indicator.
We hoped that using the different proxy of firm
performance, we would find a robust model.
3 RESULTS AND DISCUSSION
3.1 Descriptive Analysis
We present the descriptive statistics by industry and
by year to show the idiosyncratic effect of industry
and year to the data tested. Table 1 and table 2 show
the descriptive statistics by industry, and as we can
see there isn’t any significance difference between
ROE and ROA. The data present already winsorized
to avoid outliers within the observation. The highest
mean ROE comes from Consumer, Non-Cyclical
industry with mean 0.135 and the lowest is Basic
Material with ROE 0.063. While from ROA, we can
see that the highest mean comes from Technology
with 0.101 and the lowest one is Communication with
-0.023.
Table 3: Descriptive Statistics by Year.
Table 3 present the descriptive statistics by year
for ROE and ROA. The lowest of ROE come from
year 2011 with -0.076 and the highest is 1.456 in
2007. While, the highest mean ROA is 0.036 from
2011 and th e lowest is -0.361 in 2008.
To examine the main hypothesis, we formulated
the empirical model to capture the relationship
between firm’s risk and the return. We separate the
model into three models, first is the base model, we
examine all of the data to prove whether the
hypothesis is true or not. Second, we construct the
model according by industry, to capture the industry
effect and the last model is formulated by year to
control the year effect.
Table 4: Base model of risk and return.
Table 4 present the result from the base model
using combination of control variables. In model 1 we
test the risk-return association without controlling
industry and year, the result shows the negative effect
of risk on return. Model 2 we include industry control
and the result still show negative relation between
risk and return. Model 3 include year control and still
show negative relation between risk and return. The
last model, we control the industry and year and the
result still show negative significant association
between risk and return. The results from all four
models corroborate the main hypothesis that firms
with return above the reference point (gain) take less
risk (risk-averse).
Table 5: Risk-Return Industry Analysis.
In the second examination, we estimate the risk-
return association within each industry observed as
presented in table 5. The result show that all of the
industries observed in this research show consistent
result. The negative β all similar in all industries,
which show the negative relation between risk and
return.
The last examination in table 6 show the annual
regression analysis from all the year of observed in
this research. The value of coefficient beta show
negative significant which in particular similar with
the beta estimated in base model and in industry-
based model. Only one from eight year of observation
which not significant. The result overall
EBIC 2019 - Economics and Business International Conference 2019
84
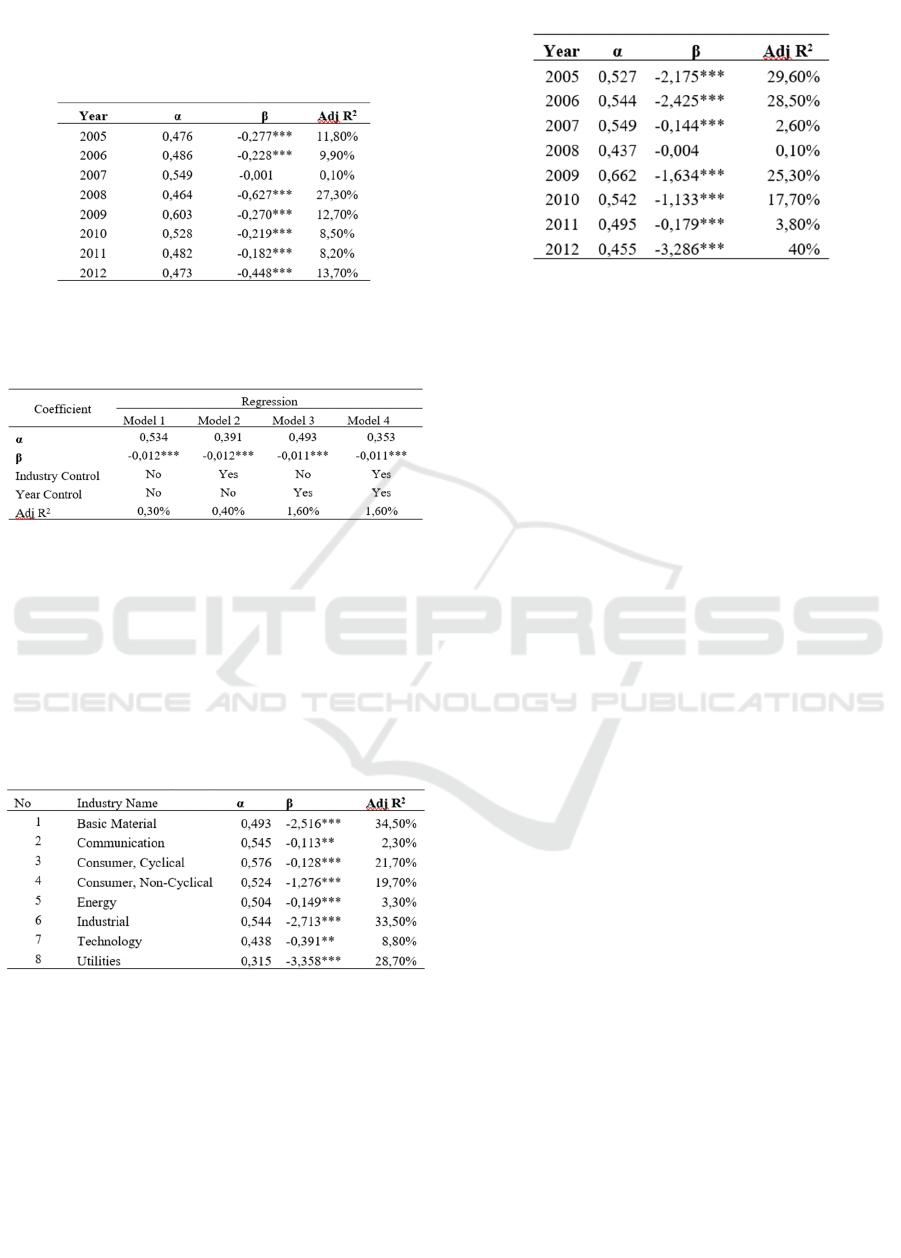
strengthening the negative relationship between
firm’s risk level and return.
Table 6: Risk-Return Annual Analysis.
Robustness Analysis
Table 7: Base model of risk and return.
The sample in robustness analysis is same with the
earlier examination, but instead of using ROE, we
change it to ROA as alternative proxy of risk and
return. In this section, we will examine the negative
relation between firm’s risk and return using ROA.
Table 7 show the base model examination of risk and
return regression using ROA. All four models show
negative significant result that support the result in
table 4 and the hypothesis tested in this research.
Table 8: Risk-Return Industry Analysis.
The industrial regression analysis in table 8 also
show similar result that all of industries show
negative association between risk and return. The last
model is annual regression in table 9, the result show
almost all observation in all year show negative beta
except 2008.
Table 9: Risk-Return Annual Analysis.
4 CONCLUSIONS
Prospect theory by Kahneman and Tversky (1979)
addressed an important issue in behavioural finance.
In short, prospect theory built upon economic and
psychological-experimentation foundation. It shows
that individual cling on loss more heavily than gain
and evaluate the expected loss and gain relative to
their predetermined expectation. Our research model
aims to strengthening the results from prior research.
The result form our model shows robust and
consistent evidence that support the prospect theory.
We find that firm that perform under their competitor
within industry (which shown by ROE/ROA lower
than median industry) show a significant negative risk
and return relation. We also find that within industry
regression, the negative relation between risk and
return still consistent with the base model. And lastly,
in the annual regression, almost all period shows
negative significant relation between risk and return.
All of the result strongly support premise that argue
most individuals are loss averse, then perform
prospect theory behaviour.
REFERENCES
Bowman, E. H. (1980). A Risk/Return Paradox for
Strategic Management. Sloan Management Review
(pre-1986), 21(3), 17.
Chou, P. H., Chou, R. K., & Ko, K. C. (2009). Prospect
theory and the risk-return paradox: some recent
evidence. Review of Quantitative Finance and
Accounting, 33(3), 193-208.
Das Gupta, R., & Pathak, R. (2018). Firm’s Risk-Return
Association Facets and Prospect Theory
Findings—An Emerging versus Developed
Country Context. Risks, 6(4), 143.
Díez-Esteban, J. M., García-Gómez, C. D., López-Iturriaga,
F. J., & Santamaría-Mariscal, M. (2017). Corporate
risk-taking, returns and the nature of major
shareholders: Evidence from prospect theory.
High Risk High Return? Empirical Testing of Prospect Theory in Indonesia
85

Research in International Business and Finance, 42,
900-911.
Dominguez, N., & Raïs, M. (2012, September). Risk-
seeking behaviours in growth strategies of SMEs:
targeting unstable environments. In 15th McGill
International Entrepreneurship Conference (p. 21).
Fiegenbaum, A., & Thomas, H. (1988). Attitudes toward
Risk and the Risk-Return Paradox: Prospect Theory
Explanations. The Academy of Management
Journal, 31(1), 85-106.
Hambrick, D & Finkelstein, S. 1987. Managerial
Discretion: A Bridge between Polar Views of
Organizational Outcomes. Research in
Organizational behaviour. 9: 369-406.
Kahneman, D, & Tversky, A. (1979). Prospect theory: An
analysis of decisions under risk. Econometrica, 47,
278.
Kliger, D., & Tsur, I. (2011). Prospect theory and risk-
seeking behavior by troubled firms. Journal of
Behavioral Finance, 12(1), 29-40.
Markowitz, H. (1952). Portfolio selection. The journal of
finance, 7(1), 77-91.
Sinha, T. (1994). Prospect theory and the risk return
association: another look. Journal of Economic
Behavior & Organization, 24(2), 225-231
.
EBIC 2019 - Economics and Business International Conference 2019
86
