
Geotechnics Analysis: Soil Hardness on Stability of Davit Kecil’s Weir in
Ulu Maras, Kepulauan Anambas, Kepulauan Riau
Miftahul Jannah
1
, Dewandra Bagus Eka Putra
1
, Firman Syarif
2
, Joni Tripardi
3
, Nopiyanto
3
and
Husnul Kausarian
1
1
Department of Geological Engineering, Universitas Islam Riau, Pekanbaru, Indonesia
2
Department of Civil Engineering, Universitas Islam Riau, Pekanbaru, Indonesia
3
Water Resources, Department of Public Works and Housing, Kepulauan Anambas, Indonesia
nopiyanto.dpu@gmail.com, husnulkausarian@eng.ur.ac.id
Keywords:
Geotechnics, Weir Stabillity, Sieve Analysis, Direct Shear Stress, Kepulauan Riau.
Abstract:
Davit Kecil’s weir is an irrigation area that located in Ulu Maras Village, East Jemaja District, Kepulauan
Anambas Regency, Kepulauan Riau Province. The needs of a geotechnical study are important to determine
the soil properties and soil stability of the study area, those parameters will be used to identify the stability of
the weir structure. Methods used are field study by taking soil samples and conduct laboratory analysis such
as sieve analysis, hydrometer analysis, atterberg limits and direct shear stress that useful for soil resistance
identification. Based on the laboratory test result, Hb.2 and Hb.3 are non- plastic soils with uniformity
coefficient are 20.92 – 45.38 and coefficient of gradation is 6 – 15.68. So, the soils as categorized as very
good on uniformity and good on gradation. The value of direct shear stress with cohesion (c) is 0.06 and φ
obtained were in the range of 33.78 – 34.33. Soil grain size identified from sieve analysis is gravel-clay. Based
on the analysis result, the stability of Davit Kecil’s weir that was observed from normal water condition and
flood water condition is categorized into strong-safe weir characterized by sufficient eccentricity and bearing
capacity control. In addition, the weir is withstand rolling and sliding failures.
1 INTRODUCTION
Weir is an across building on river channel that
functions to raise the river’s water level. Weir is
a solution in various problems that related to water
resources, utilization, management and preservation
(Sadono et al., 2017). It was commonly built from
soil and rock materials (Athani et al., 2015), that
collected a water reserve as a reservoir in order to
maintain stable water supply both in rainy and dry
seasons (Sompie et al., 2015). Weir is a building
that perpetually related with the water (Harseno and
Daryanto, 2008). It could also be defined as a building
that planted in the river or water flow to deflect water
into irrigation (Gunasti, 2016; Putra et al., 2016).
Jemaja’s irrigation area is located in Jemaja
Island, Kepulauan Anambas Regency, Kepulauan
Riau Province. Based on the regulation from
Ministry of Public Works and Housing (PUPR)
No.14/PRT/M/2015 about The Criteria and
Stipulation of Irrigation Area Status, Kepulauan
Anambas Regency has the authorization of irrigation
area as wide as ±386 ha. A study by BWS Sumatra
IV said this time around 637,48 ha Irrigation Area
was indicated as irrigation area and ±793,43 ha that
has the potency to be convert into irrigation area.
As a follow-up, the management of irrigation
that could be utilized effectively and optimally then
developed an irrigation area that potentially as an
irrigation area. Other than that, the aims to plan
the development irrigation area should estimating the
technique, economical and environmental aspects.
The weir conditions need to fulfill several factors
to be stable and able to control a flood condition. The
weir construction should be calculated the strength of
bearing capacity of subsurface soil, the weir must be
able to hold-out a seepage caused by river water flow
and water infiltration into the soil, the weir height
must be able to fulfill the minimum water level which
is needed for the whole irrigation area and the form of
a boiler must be calculated so the water can transport
a sand, gravel and any stones from upstream and not
cause damage to the weir’s body (Erman and M.,
2010).
Jannah, M., Putra, D., Syarif, F., Tripardi, J., Nopiyanto, . and Kausarian, H.
Geotechnics Analysis: Soil Hardness on Stability of Davit Kecil’s Weir in Ulu Maras, Kepulauan Anambas, Kepulauan Riau.
DOI: 10.5220/0009158402190228
In Proceedings of the Second International Conference on Science, Engineering and Technology (ICoSET 2019), pages 219-228
ISBN: 978-989-758-463-3
Copyright
c
2020 by SCITEPRESS – Science and Technology Publications, Lda. All rights reserved
219
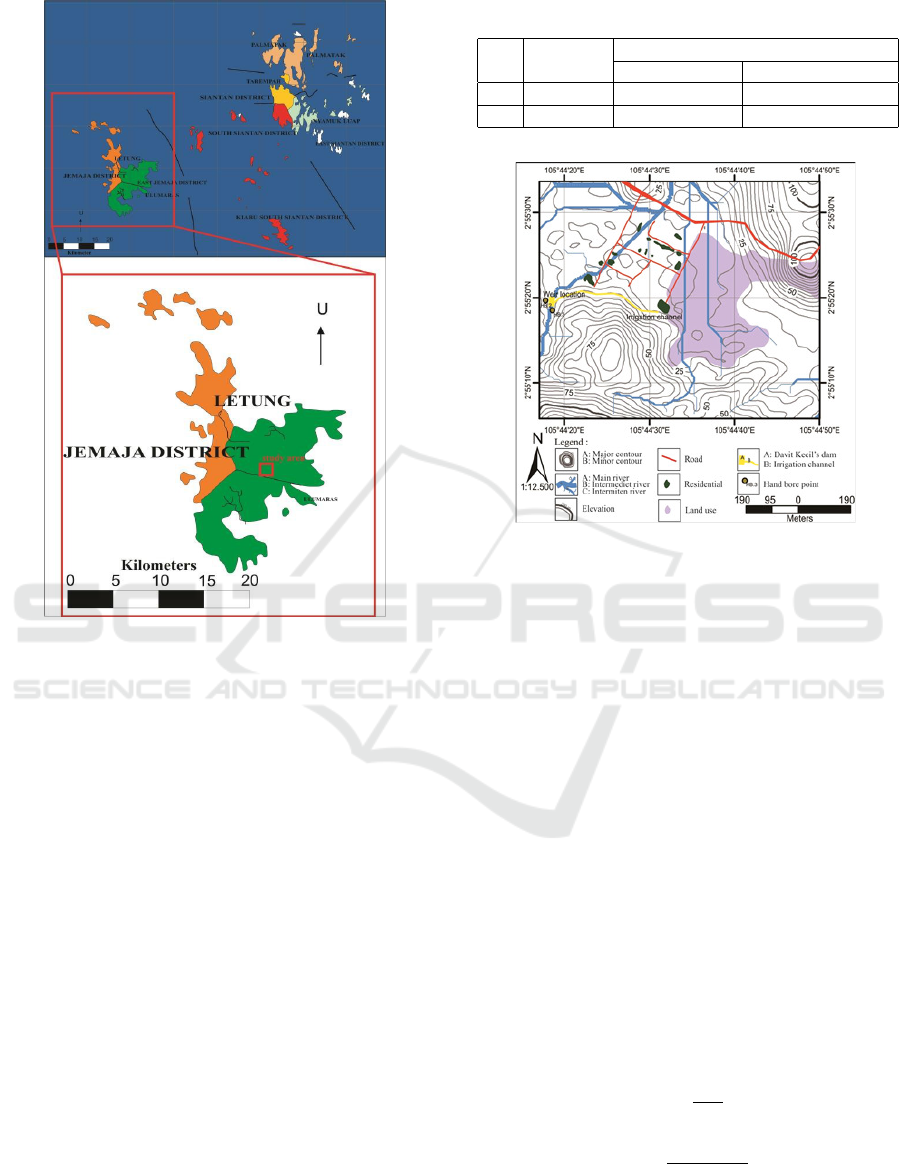
Figure 1: The administration map of Kepulauan Anambas
regency.
2 METHODOLOGY
Methods used in this study are field survey, laboratory
analysis and the calculation of dam stability. The
explanation of each analysis is as follows:
2.1 Field Survey
The field survey was done to obtain primary data such
as planning location, identified soil layers by using
borehole data in several points. In addition, drilling
is done to take soil sample which would be analyzed
in the laboratory (Susanto H, 2014). Field survey
also conducted by using hand bore that useful to find
out the soil layers on the subsurface. The standard
procedure that used in hand bore work is ASTM D –
1452 – 80. There are 2 boreholes that can be seen in
table (1) and figure (1) below.
Based on the Regional Geology Map (Samodra,
1995), in this two points, the study area was include
in Granit Anambas Formation. There are granite,
granodiorite and syenite in this formation. The
general soil condition is grey, brown and pink in
colour.
Table 1: Borehole location and soil testing.
No
Location
name
Coordinates
X Y
1 HB.2 N2
◦
55’19.64” E1052
◦
44’17.83”
2 HB.3 N2
◦
55’18.50” E1052
◦
44’18.64”
Figure 2: The topography map in the study area shows hand
bore points and weir location
2.2 Laboratory Test
Laboratory test consists of undisturbed and disturbed
samples taken from selected locations (Sompie et al.,
2015). Laboratory test used to determine the most
effective and suitable location of dam construction
in the study area. Several laboratory tests had
been conducted such as sieve analysis, hydrometer
analysis, atterberg limits and direct shear stress.
2.2.1 Sieve and Hydrometer Analysis
Sieve and hydrometer analysis are the methods to
determine the soil grain size at the borehole points.
Soil classification calculated based on particle size
from sieve and hydrometer analysis (ASTM, 2007).
There are uniformity coefficient (Cu) and
coefficient of gradation (Cc) that obtained from sieve
and hydrometer curve. The calculation (1) and (2)
are:
C
u
=
D
60
D
10
(1)
C
c
=
D
30
2
D
10
× D
60
(2)
where:
C
c
= coefficient of gradation
ICoSET 2019 - The Second International Conference on Science, Engineering and Technology
220
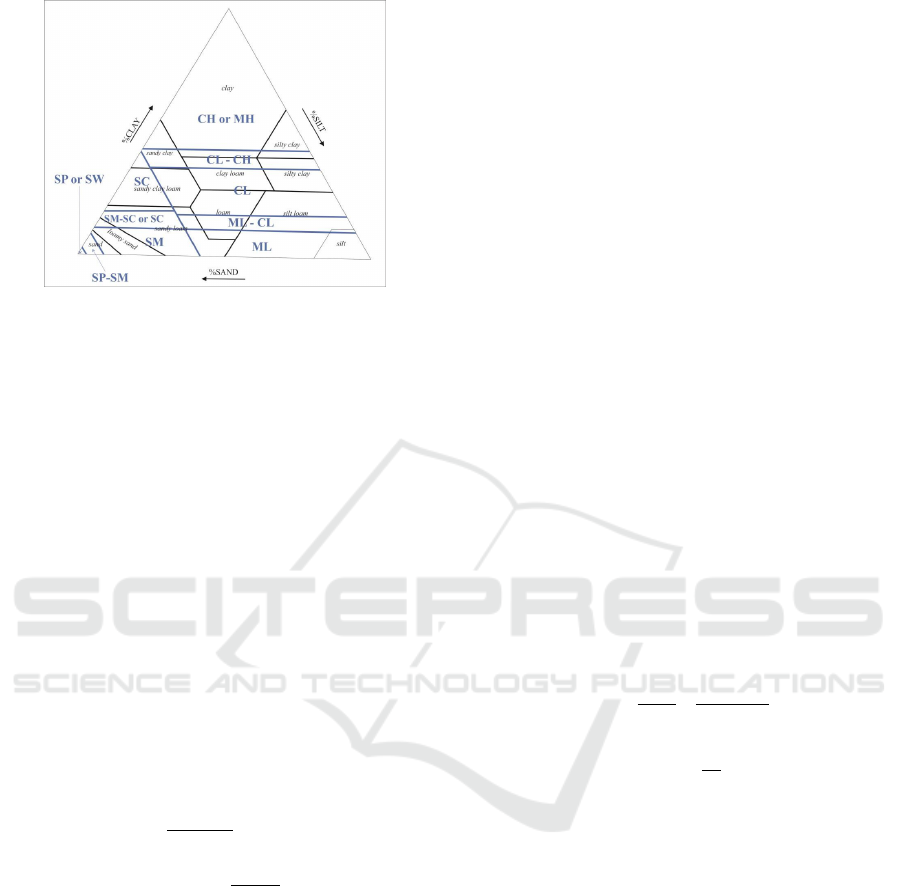
Figure 3: The USCS triangle
C
u
= uniformity coefficient
D
10
= diameter of 10% finer
D
30
= diameter of 30% finer
D
60
= diameter of 60% finer
2.2.2 Atterberg Limit
Atterberg Limit used to identify the soil properties
such as Liquid Limit (LL), Plastic Limit (PL)
and Plasticity Index (PI). The type of soil can be
determined based on the Plasticity Index’s (PI) value
and then the value is inserted into the plasticity chart.
When the atterberg limit’s status is non-plastic, the
triangle (figure 3) can be used.
Other than that, here is the formula of Atterberg
Limits to calculated Plastic limit from ASTM D 424-
54 (3), Liquid limit from ASTM D 422 – 66 (4) and
Plasticity index from ASTM D 424 – 74 (5).
w =
m
2
− m
3
m
3
− m
1
× 100% (3)
LL = w ×
N
0.121
25
(4)
PI = LL − PL (5)
wherein:
w = water content (%)
N = number of beats
m
1
= container mass (gr)
m
2
= container mass + wet soil (gr)
m
3
= container mass + dry soil (gr)
PI = Plastic Index (%)
LL = Liquid limit (%)
PL = Plastic limit (%)
2.2.3 Direct Shear Stress
This test is used to determine the soil shear stress after
its experienced a consolidation by loaded with two-
way drainage. On the soil mechanics calculation, the
direct shear stress is stated as cohesion (c) and deep
friction angle (◦) (Adama, 2017). The deep friction
angle used to determine the main material in the weir.
2.3 Weir Stability
Weir stability analysis is useful to indicating the
forces that worked on the weir. The calculation
used are own gravity (G), Earthquake force (K),
hydrostatic force (W), Mud pressure (L) and uplift
pressure (Px). To calculated own gravity and
hydrostatic force the weir was partially divide into
several shape such as triangles, rectangulars or
trapezoid (Ali, 2014). The earthquake coefficient
depends on the construction site. In this study area,
K is 0,15. According to Radjulaini (2012), on the
construction by using stone should not occur tensile
stress. Moment of resistance (Mt) must greater than
the moment of rolling (Mg) with the safety factor
between 1.5-2. The construction should not shift with
the safety factor is 1.2-2.
E = W bs.α (6)
L
p
=
γ
s
.h
2
2
.
1 − sin ϕ
1 + sin ϕ
(7)
P
x
= H
x
−
L
x
L
.∆H (8)
wherein:
E = earthquake forces (ton)
Wbs = own gravity in the vertical direction (ton)
α = earthquake coefficient
L
p
= force located at 2/3 of the depth of the top of
the mud that works horizontally (m)
γ
s
= mud specific gravity (γ
s
= 1.6 kN/m 3 )
H = thick mud (m)
ϕ = friction angle in mud (ϕ=20 o )
Px = uplift force on x point (kg/m 2 )
Hx = height x (m)
∆ = high difference (m)
L = total length of creep line on the weir (m)
Lx = length of creep line until x point (m)
Geotechnics Analysis: Soil Hardness on Stability of Davit Kecil’s Weir in Ulu Maras, Kepulauan Anambas, Kepulauan Riau
221
Dam stability in terms of rolling, sliding,
eccentricity and soil bearing capacity were calculated.
The dam stability analysis is observed from 2 (two)
water level conditions, that is normal water condition
and flood water condition. The following are
formulas used in this calculation.
F
x
=
∑
MT
∑
MG
> 1.25 (9)
F
x
=
∑
V.tan ϕ
∑
H
> 1.00 (10)
a =
∑
MT −
∑
MG
∑
H
e =
B
2
− a <
B
6
(11)
σ =
∑
V
B
×
1 ±
6e
B
< σi jin (12)
where:
Fx = safety value
∑
V = total of vertical force
∑
H = total of horizontal force
∑
MT = total of the moment of resistance
∑
MG = total of the moment of rolling
e = eccentricity
σ = soil stress (σijin = 3.75 kg/m
2
)
3 RESULT AND DISCUSSION
The result and discussion of each analysis that has
been done in this study are:
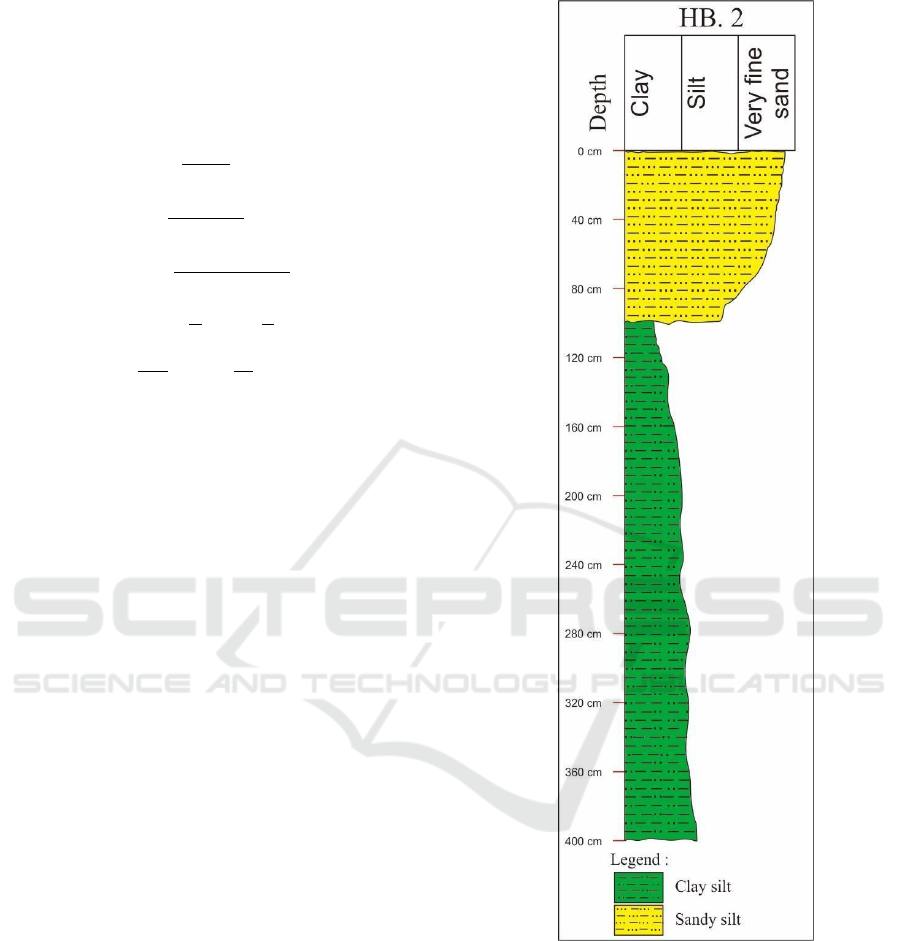
3.1 Field Survey
The following are soil layers in the drill point at a
depth of 4 meters.
In this location (figure 4), the description of layers
soil are:
- At depth 30 – 100 cm there is silty sand, the colour
is brownish yellow, solid and low plasticity.
- At depth 100 – 400 cm there is silty clay with sand
insert, the colour is yellow, rather soft – medium,
medium – high plasticity.
In this location, the description of layer soil (figure
5) is:
- At depth 0 – 50 cm there is sandy-silt with fine
sand grains, the colour is brownish yellow, rather
loose and hard.
- At depth 50 – 400 cm there is sand with medium
sand grains, the colour is yellow, rather loose –
solid.
Figure 4: The sediment log at HB.2
3.2 Laboratory Test
The result of laboratory analysis in the study area
are sieve and hydrometer analysis, atterbeg limit and
direct shear stress.
3.2.1 Sieve and Hydrometer Analysis
There are the result of sieve and hydrometer analysis
from the soil samples taken at 3.5 – 4.00 m in each
ICoSET 2019 - The Second International Conference on Science, Engineering and Technology
222
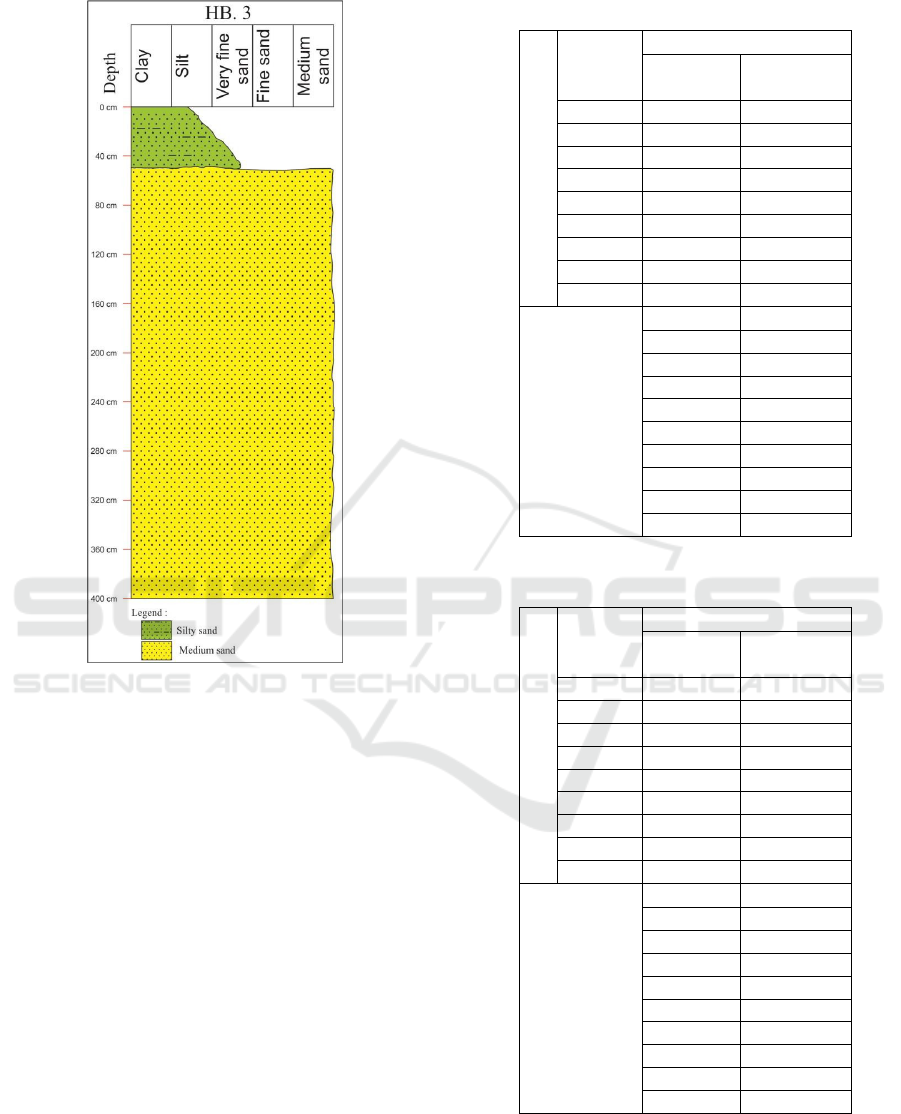
Figure 5: The sediment log at HB.3
borehole. Based on the table below, the value will be
plotted into the grain-size curve (figure 6).
From the curve, it could be seen that the result
of grain size curve has gap graded because it has a
combination of more than 2 fractions with the similar
gradation. The type of grain size on sieve analysis
fromvthe curve above are gravel – fine sand.
Whereas, hydrometer analysis indicated the grain
size type as silt – clay. Based on the classification of
grain size, the type of soil is sandy loam (SM) with
texture non-sticky and non-plastic (figure 7).
The uniformity coefficient (Cu) calculation and
coefficient of gradation were carried out using the
diameter value that obtained from the curve are
D
10
= 0.006, D
30
= 0.15852 and D
60
= 0.2723.
So, the value of Cu and Cc based on the diameter
by curve are 45.38 and 15.68. Accordingly, the soil
sample has a very good grain uniformity and good
gradation.
For HB.3, the result of sieve and hydrometer
analysis are (table 3):
From the curve above, indicated the gap graded
Table 2: Result of Sieve and hydrometer analysis of HB.2
S
I
E
V
E
Sieve
number
HB.2
Diameter
(mm)
Percentage
(%)
0 0.00 100.0
4 4.75 96.80
10 2.00 95.60
20 0.85 95.10
30 0.6 94.20
40 0.425 89.00
60 0.25 64.70
100 0.15 29.50
200 0.075 29.00
H
Y
D
R
O
M
E
T
E
R
0.073 27.07
0.052 26.14
0.038 25.22
0.028 23.37
0.019 18.75
0.011 15.06
0.008 13.21
0.006 9.52
0.003 8.59
0.001 4.9
Table 3: Result of Sieve and hydrometer analysis of HB.3
S
I
E
V
E
Sieve
number
HB.3
Diameter
(mm)
Percentage
(%)
0 0.00 100.0
4 4.75 97.80
10 2.00 97.20
20 0.85 96.70
30 0.6 95.50
40 0.425 94.60
60 0.25 89.70
100 0.15 65.50
200 0.075 28.90
H
Y
D
R
O
M
E
T
E
R
0.073 27.02
0.052 26.09
0.038 25.17
0.028 21.48
0.019 17.80
0.011 15.03
0.008 12.26
0.006 8.58
0.003 5.81
0.001 3.96
soil and has a combination of more than 2 fractions
with the same gradation. The type of grain size from
sieve analysis are gravel – fine sand. Whereas, from
Geotechnics Analysis: Soil Hardness on Stability of Davit Kecil’s Weir in Ulu Maras, Kepulauan Anambas, Kepulauan Riau
223
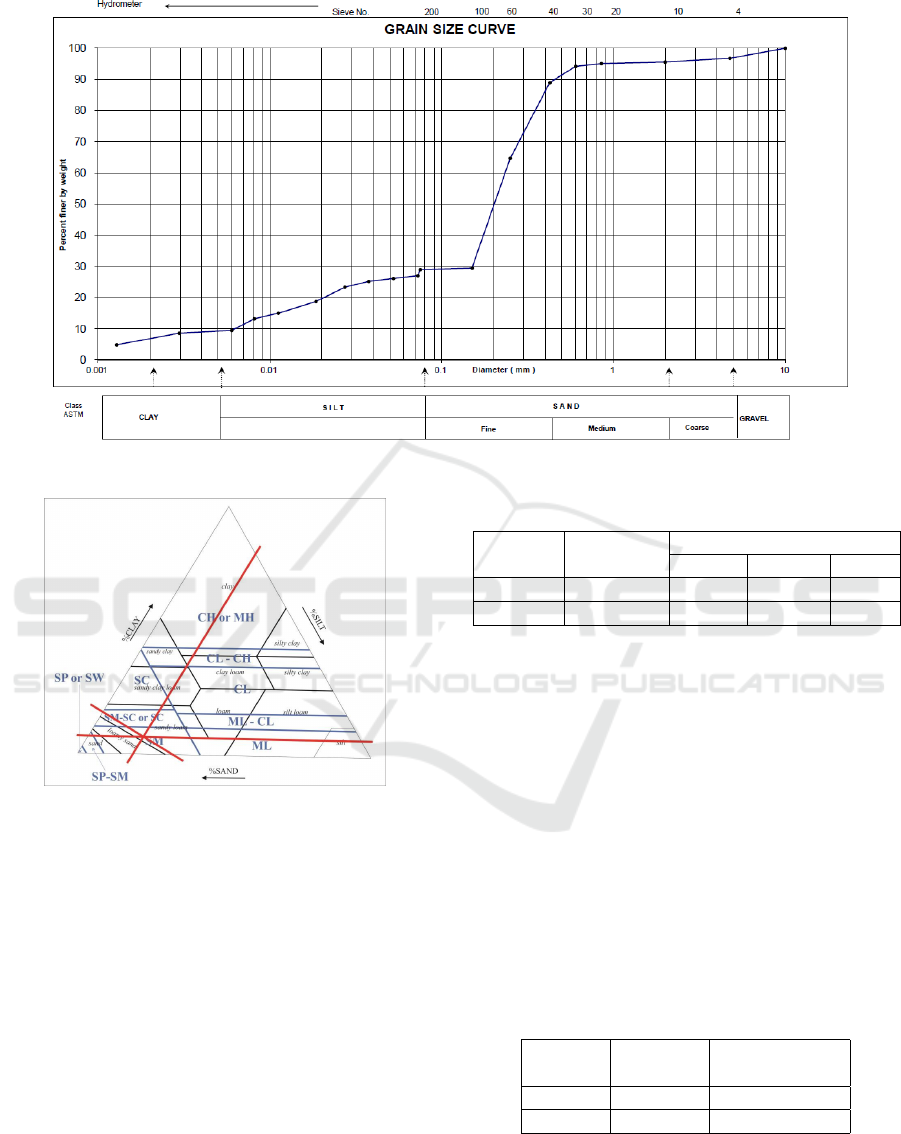
Figure 6: The grain size curve of HB.2
Figure 7: Type soil in HB.2
hydrometer analysis shows silt – clay grain size. Soil
type determine from the grain class (figure 9).
The uniformity coefficient (Cu) and coefficient of
gradation were calculated with diameter value that
determine from the curve are D
1
0 = 0.00698, D
3
0 =
0.075892 and D
6
0 = 0.146.
So, the value of Cu and Cc are 20.92 and
6. Accordingly, the soil sampleo has very god
uniformity of grain and good gradation.
3.2.2 Atterberg Limits
The atterberg limit analysis that performed were
liquid limits, plastic limits and index plastic. The test
carried out using the sample from 3,50 m – 4,00 m
depth in each borehole. The following are the results
of liquid limit, plastic limit and plasticity index.
Table 4: Atterberg Limit analysis result
Drill no.
Depth
(m)
Atterberg limits
Wl(%) Wp(%) Ip(%)
HB.2 3.50- 4.00 *NP *NP *NP
HB.3 3.50- 4.00 *NP *NP *NP
*NP = non-plastic
This sample has non-plastic properties because
at that depth, the soil layers are clay-silt with sand
insertion (HB.2) and medium sand (HB.3).
3.2.3 Direct Shear Stress
This test was done with three-loads, those are 13.4
kg, 28,4 kg and 54.80 kg. After that the value of
normal stress and shear stress would be plotted into
shear stress graph (figure 10 and figure 11).
The result of direct shear stress from the graph
above could be seen in the table below (Table 5).
Table 5: The direct shear stress’s value
Bore
Number
Cohesion
(kg/cm2)
Friction Angle
(degree)
(2) 0.06 34.33
(3) 0.06 33.78
From the table above, could be determined the
material that used is stone. Whereas the volume
weight is 22 kN/m
3
.
ICoSET 2019 - The Second International Conference on Science, Engineering and Technology
224
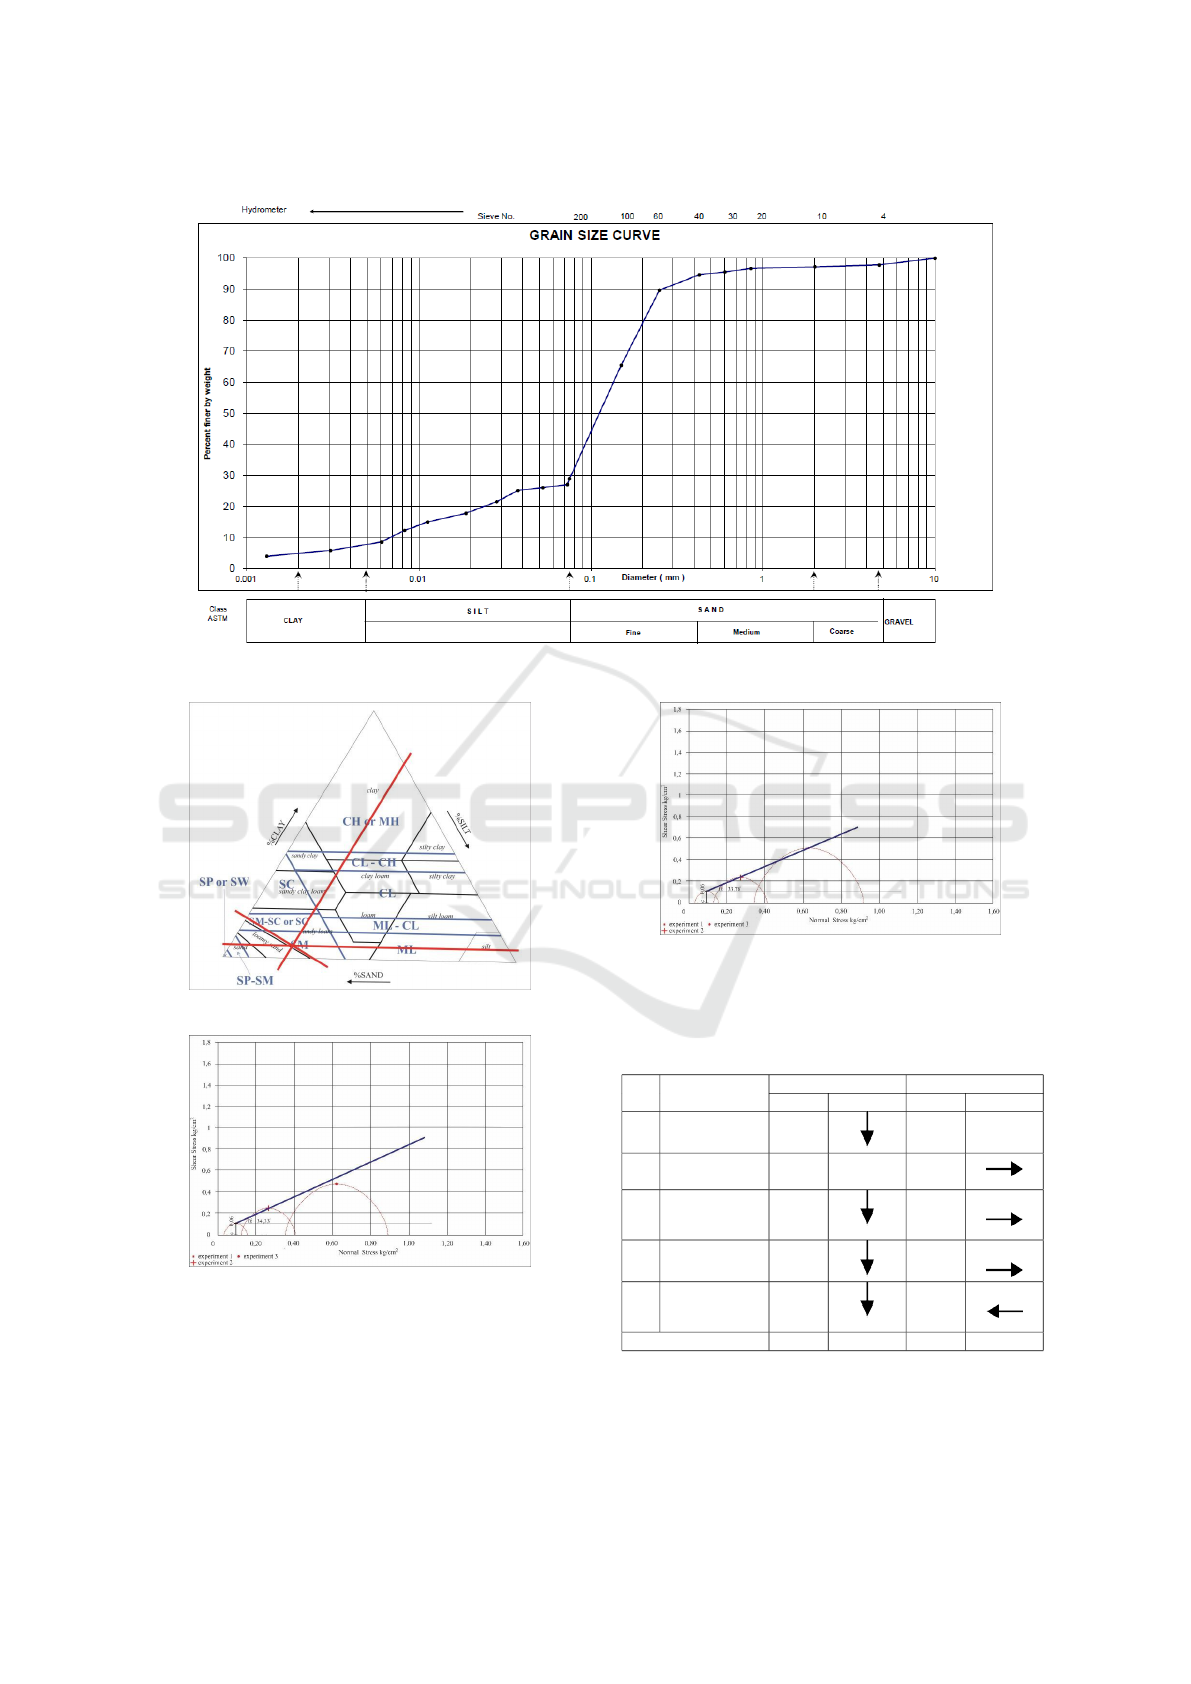
Figure 8: The grain size curve of HB.3
Figure 9: The grain size curve of HB.3
Figure 10: The shear stress graph of HB.2
3.3 Weir Stability
Weir stability is determined based on the calculation
of workforces. The result of forces that worked at
Davit Kecil’s Dam during normal water condition and
Figure 11: The shear stress graph of HB.3
flood water condition.
Table 6: a. The forces that worked at Davit Kecil’s Weir in
normal water condition
No Kind of forces
Vertical styles Horizontal styles
V Direction H Direction
1. Own gravity -43.07
2.
Earthquake
force
7.69
3.
Hydrostatic
pressure
0.26 7.28
4. Mud pressure 0.2 5.71
5.
Uplift-
pressure
8.00 -10.99
Total -34.6 9.79
The forces that work on normal and a flood
condition could be seen by moment direction. On the
table above could be seen that MT is -180.21 (normal
Geotechnics Analysis: Soil Hardness on Stability of Davit Kecil’s Weir in Ulu Maras, Kepulauan Anambas, Kepulauan Riau
225
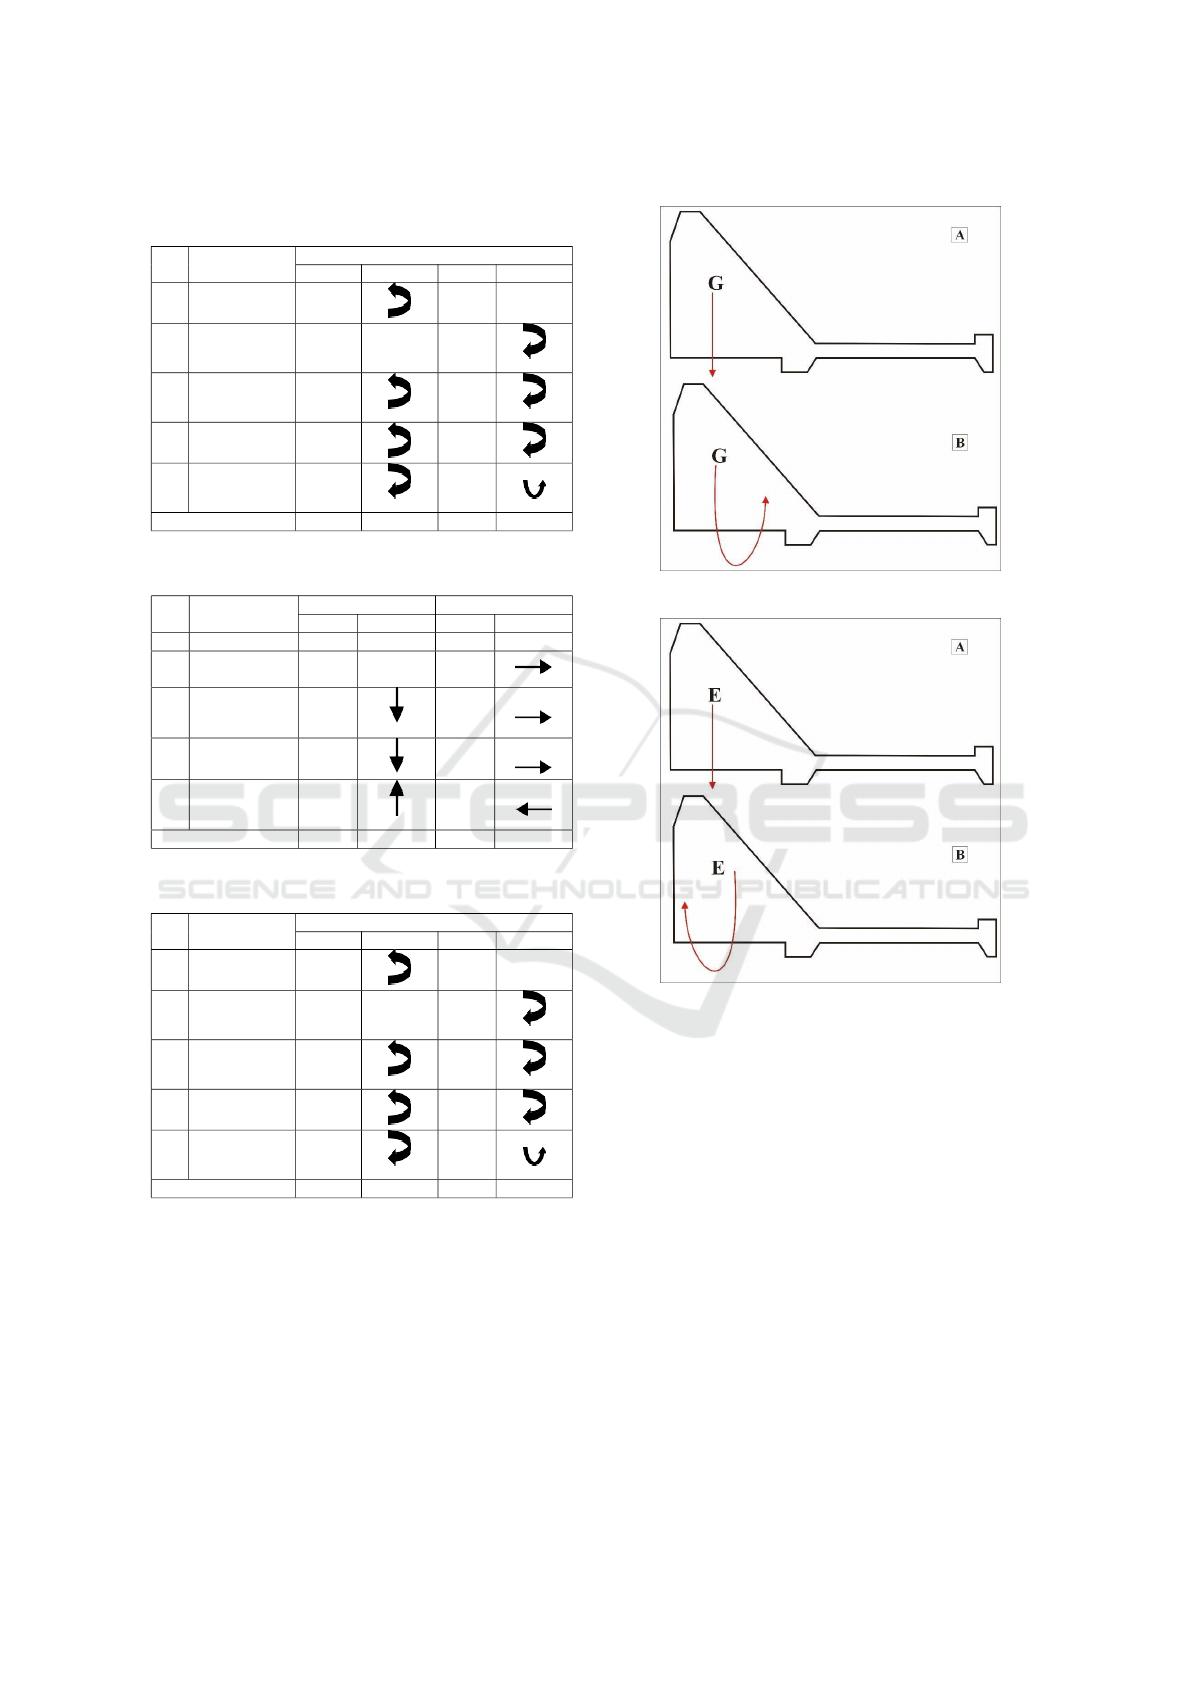
Table 7: b. The forces that worked at Davit Kecil’s Weir in
normal water condition
No Kind of forces
Moment
MT Direction MG Direction
1. Own gravity -180.20
2.
Earthquake
force
17.35
3.
Hydrostatic
pressure
-1.48 24.25
4. Mud pressure -1.15 19.87
5.
Uplift-
pressure
11.33 -32.75
Total -171.50 28.72
Table 8: a. The forces that worked at Davit Kecil’s Weir in
normal water condition
No Kind of forces
Vertical styles Horizontal styles
V Direction H Direction
1. Own gravity -43.07
2.
Earthquake
force
7.69
3.
Hydrostatic
pressure
3.17 15.28
4. Mud pressure 0.2 5.71
5.
Uplift-
pressure
-11.06 -15.27
Total -34.6 -50.75 13.42
Table 9: b. The forces that worked at Davit Kecil’s Weir in
flood water condition
No Kind of forces
Moment
MT Direction MG Direction
1. Own gravity -180.20
2.
Earthquake
force
17.35
3.
Hydrostatic
pressure
-14.95 57.77
4. Mud pressure -1.15 19.87
5.
Uplift-
pressure
15.39 -53.32
Total -180.92 41.67
condition) and -180.208 (flood condition). So, the
vertical direction from this force is rotated to the right
or counter-clockwise (Figure 12).
On the earthquake force, the MG value is 17.35 so
as to turn the left or clockwise (Figure 13).
These hydrostatic forces have a two-moment,
those are MT and MG that have a different direction.
On the normal condition, the MT (righting moment)
value is -1.481 and on the flood condition, the MT
Figure 12: Own gravity on the weir
Figure 13: Earthquake force on the weir
(righting moment) value is -14.950. The vertical
direction of this force is changed by turn the right or
counter-clockwise (Figure 14).
While MG on the normal condition is 24.25 and
on the flood condition is 57.77. So the horizontal
direction from this force is turned the left or clockwise
(Figure 15).
From the table above (6b) (7b), noted that MT
value in both conditions is the same, that is -1.15
on the normal and flood condition. So, the vertical
direction of this force is changed by turn the right or
counter-clockwise (Figure 16).
On the MG, the value of mud pressure is 19.87 on
both conditions. So the horizontal direction this force
is to turn the left or clockwise (figure 17).
On the uplift-pressure, the MT’s value is 11.33 in
normal condition and flood condition is 15.39. So
ICoSET 2019 - The Second International Conference on Science, Engineering and Technology
226
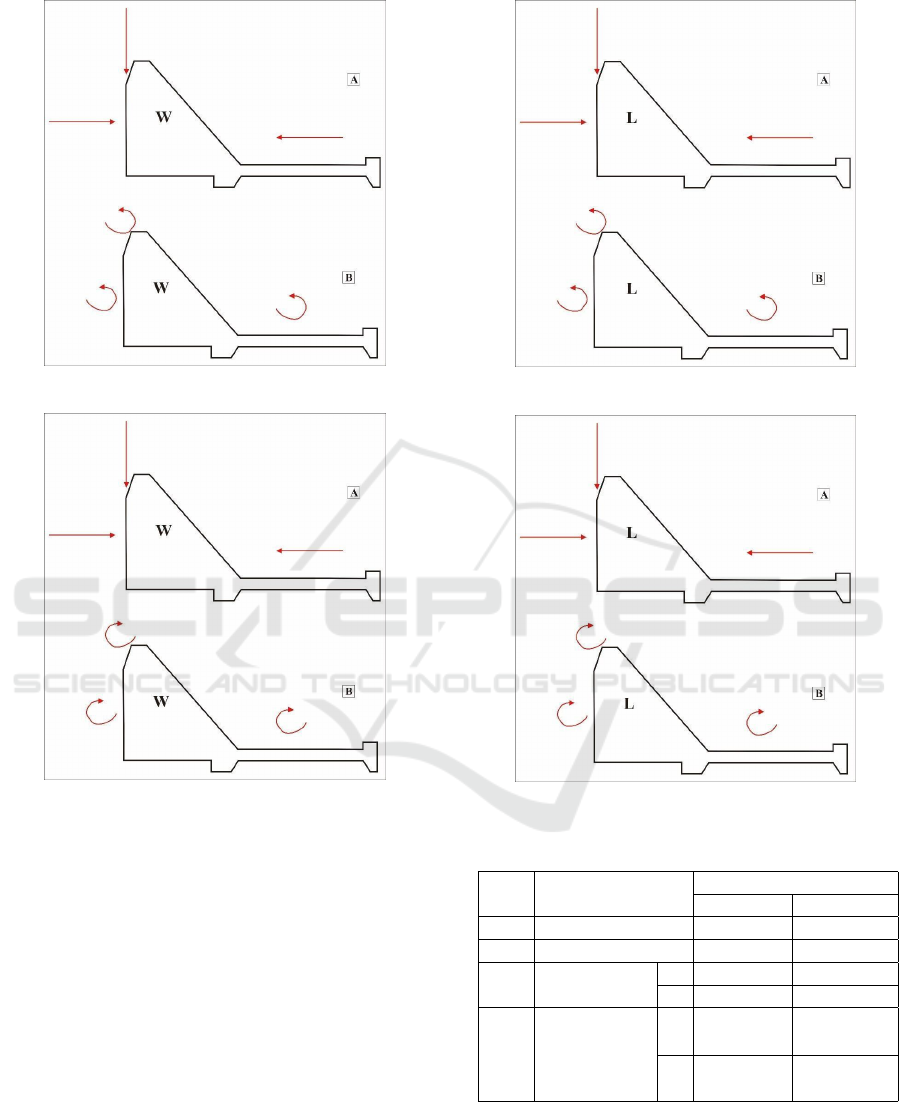
Figure 14: A hydrostatic force of MT
Figure 15: A hydrostatic force of MG
the horizontal direction of MT is turned the right or
counter-clockwise (figure 18).
On the uplift-pressure, the MG’s value is -32.75
in normal condition and flood condition is -53.32. So
the horizontal direction of MG is turned the left or
clockwise (figure 19).
The calculation of weir stability are reviewed from
rolling, sliding, eccentricity and soil bearing capacity
for each water level conditions, there are normal water
condition and flood water condition. The calculation
can be seen in the table below.
Based on the calculation above, the control of
stability weir by rolling in normal and flood water
conditions as strong, that is ≥1,5. Davit Kecil’s weir
is strong to against shear because in the normal water
condition the value is ≥1,5 and flood water condition
is ≥1,00. This weir is also safe to eccentricity control
Figure 16: Mud pressure of MT
Figure 17: Mud pressure of MG
Table 10: The calculation of stability at Davit Kecil’s Weir
in normal water condition and flood water condition
No. Weir stability
Water level conditions
Normal Flood
1. Rolling stability 5.971 -4.341
2. Sliding stability -2.676 3.706
3.
Eccentricity
stability
a 4.127 m -2.744 m
e -0.127 m 1.256 m
4.
Soil bearing
capacity
c
0.391
kg/cm
3
1.232
kg/cm
3
c
0.474
kg/cm3
0.037
kg/cm
3
with value -0,127≥1,333 in normal water condition
and in flood water condition is 1,256≥1,333. The soil
bearing capacity at this weir was done twice in water
level conditions with the terms of value ≤ σ
i jin
is 3,75
Geotechnics Analysis: Soil Hardness on Stability of Davit Kecil’s Weir in Ulu Maras, Kepulauan Anambas, Kepulauan Riau
227
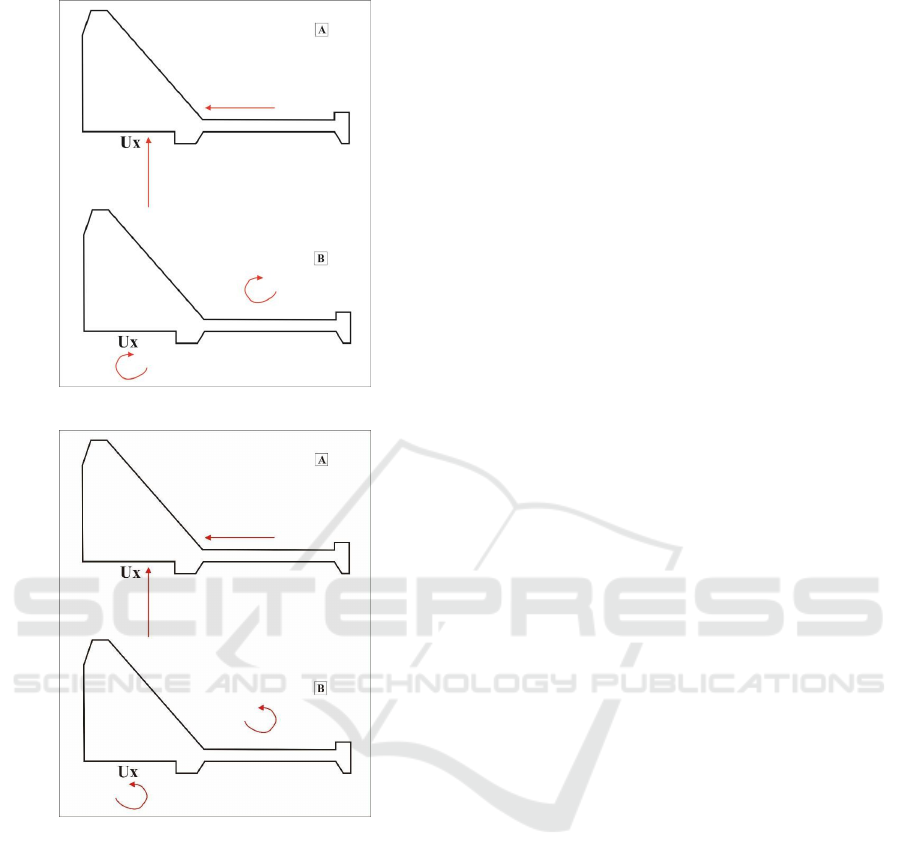
Figure 18: Uplift-pressure of MT
Figure 19: Uplift-pressure of MG
kg/cm
3
. The normal water condition with value σ
1
is
0,391 kg/cm
3
and σ
2
is 0.474 kg/cm
3
, while in flood
water condition with value σ
1
is 1.232 kg/cm
3
and
σ
2
is 0,037 kg/cm
3
. So it is concluded that Davit
Kecil’s weir in 2 water level conditions has fulfilled
that are strongly resist of rolling, strongly resist of
sliding, safe of eccentricity and strongly resist of soil
bearing capacity.
4 CONCLUSION
Based on the result and discussion in the study area
above, then conclusions could be drawn as follows:
• Safety factor to rolling mode is greater than the
minimum safety factor requirement.
• Safety factor to sliding mode is greater than the
minimum safety factor.
• Safety factor to eccentricity mode is safe.
• Safety factor to bearing soil capacity is in the
range of requirement value for wire building.
ACKNOWLEDGMENTS
Thanks to the Department of Public Works and
Housing (Dinas PUPR) Kepulauan Anambas that
giving permission and access to the study area.
REFERENCES
Adama, R. A. (2017). Correlation of Soil Bearing Capacity
with Shear Strength Using Vane Shear and Direct
Shear Stress Tools. Universitas Lampung (Thesis).
Ali, I. M. (2014). Tinjauan Kestabilan Bendung Alopohu di
Kabupaten Gorontalo. Universitas Negeri Gorontalo
(Thesis).
ASTM (2007). Astm d422-63: Standard test method for
particle-size analysis of soils.
Athani, S. S., Solanki, C., Dodagoudar, G., et al. (2015).
Seepage and stability analyses of earth dam using
finite element method. Aquatic Procedia, 4:876–883.
Erman, M. M. and M. (2010). Desain Bendung Tetap untuk
Irigasi. Bandung: Alfabeta.
Gunasti, Z. K. N. S. A. (2016). Kajian teknis dam
sembah patrang kabupaten jember. Jurnal Rekayasa
Infrastruktur Hexagon, 1(1).
Harseno, E. and Daryanto, E. (2008). Tinjauan tinggi
tekanan air di bawah bendung dengan turap dan tanpa
turap pada tanah berbutir halus. Majalah Ilmiah
UKRIM Edisi, 2.
Putra, D. B. E., Choanji, T., et al. (2016). Preliminary
analysis of slope stability in kuok and surrounding
areas. Journal of Geoscience, Engineering,
Environment, and Technology, 1(1):41–44.
Sadono, K. W., Goji, P., Rachdian, E. S., and Tommy,
S. (2017). Analisis geologi teknik pada kegagalan
bendung cipamingkis, bogor. Provinsi Jawa Barat.
Proceeding Seminar Nasional Kebumian ke, 10.
Samodra, H. (1995). Geological Map of The Tarempa and
Jemaja Sheet. Riau.
Sompie, O. B. A., S., D., and Ilyas, T. (2015). (2015).
Pengaruh Proses Konsolidasi Terhadap Deformasi
dan Faktor Keamanan Lereng Embankment (Studi
Kasus Bendungan Kosinggolan),. Prosiding seminar
Teknik Sipil, 1.
ICoSET 2019 - The Second International Conference on Science, Engineering and Technology
228
