
The Community Perception of Traditional Market Services in Pekanbaru
City, Riau Province
Puji Astuti, Febby Asteriani, Eka Surya Pratiwi and Thalia Amanda Putri
Department of Urban and Regional Planning, Universitas Islam Riau, Pekanbaru, Indonesia
Keywords:
Community Perseption, Level of Satisfaction, Modern Market, Traditional Market.
Abstract:
The market existence is one of the most apparent indicators of economic activities.The increasing of modern
market development in Pekanbaru cause changing public perception in shopping activity on the use of tradi-
tional market facilities. The study purpose is identify community perception of trading facilities on tradisional
market to formulate policies relating to improving market services to the community. The analysis technique
used quantitative descriptive analysis. Its analyzing the level of customer satisfaction and assessment of service
condition; complete and price certainty of goods, market comfort, market cleanliness, availability of facilities,
and market security. For traditional market services measured from sellers politeness, sellers readiness and
sellers friendliness. Based on research concluded the level of customer satisfaction in the traditional markets
is not satisfactory and assessment of service conditions is satisfactory.
1 INTRODUCTION
The traditional market is a traditional selling place
(hereditary), where the sellers and buyers meet, the
goods traded are dependent on the request of the
buyer (consumer), the price set is the agreed price
through a bargaining process, the trader as a producer
offers little above the standard price. In general, tra-
ditional markets are places for selling basic needs.
Usually traditional markets are active within certain
time limits, such as morning markets, afternoon mar-
kets, weekend markets and so on. Traditional markets
can be managed by the government or the private sec-
tor, the available facilities consist of wards, booths,
warehouses, shops, booths / kiosks, public toilets and
others around traditional markets. In the traditional
market, the buying and selling process takes place hu-
manely and communicates with high family values.
Traditional market as a city infrastructure that
must be managed regularly and continuously, its con-
dition is highly marginalized by the existence of a
modern market with its complete facilities and ser-
vices. Traditional markets, most of which are admin-
istered by the government, serve the segmentation of
middle-lows with inappropriate physical conditions
such as slum, muddy, crowded, etc (Linda, 2008;
Witell et al., 2011). Traditional markets are one of
the important sectors that support the people’s econ-
omy, the interests of small people to the upper mid-
dle class are accommodated (Wardoyo, 2009). Tra-
ditional markets are places where sellers and buyers
meet and are marked by transactions of sellers and
buyers directly.
Based on data released by the Association of In-
donesian Market Traders (APPSI) in 2005, the growth
of traditional markets was 8.01%, while the growth of
the modern market was 31.4% per year. The condi-
tion of traditional markets is increasingly marginal-
ized with the existence of a modern market with com-
plete facilities and services. Presidential Regulation
of the Republic of Indonesia No. 112 of 2007 con-
cerning the Arrangement and Development of Tradi-
tional Markets, Shopping Centers and Modern Stores
which were followed up by the Minister of Trade Reg-
ulation of the Republic of Indonesia No.53 / M-DAG
/ PER / 12/2008 concerning the Guidelines for the Ar-
rangement and Development of Traditional Markets,
Shopping Centers and Modern Stores is a manifesta-
tion of the government’s response to the conditions
of competition that occur between traditional mar-
kets and modern markets. These regulations regulate
a number of important matters, including the rules
for the provision of compulsory facilities for tradi-
tional and modern shop markets, location and licens-
ing rules, sales system rules and working hours, to
the rules of partnership with suppliers. Rules regard-
ing gradual administrative sanctions also apply to vi-
olations, ranging from written warnings, freezing to
Astuti, P., Rosadi, S., Asteriani, F., Pratiwi, E. and Putri, T.
The Community Perception of Traditional Market Services in Pekanbaru City, Riau Province.
DOI: 10.5220/0009146501690174
In Proceedings of the Second International Conference on Science, Engineering and Technology (ICoSET 2019), pages 169-174
ISBN: 978-989-758-463-3
Copyright
c
2020 by SCITEPRESS – Science and Technology Publications, Lda. All rights reserved
169

revocation of business licenses(Dasgupta et al., 1994;
Bangia et al., 2008).
The recent development of Modern Markets and
Modern Stores in Pekanbaru City has increased
rapidly, resulting in the emergence of various public
perceptions in conducting shopping activities. The
limitation of traditional markets in facilitating the
completeness of facilities and infrastructure is an im-
portant issue in shifting community behavior in shop-
ping activities. This behavior is in the form of con-
sumer perceptions in terms of shopping satisfaction
and an assessment of traditional market service con-
ditions.
The customer’s perception of the quality of a ser-
vice and overall satisfaction has several indicators /
instructions that must be provided. Traders may smile
when they talk about goods or services, they might
say good things about goods or services. A smile is
proof that someone is satisfied, frowning instead re-
flects disappointment. Both of the above smile and
say good things are manifestations or indicators of a
construct called customer satisfaction. Satisfaction is
the level of one’s feelings after comparing the per-
formance / results they feel with their expectations.
While according to (Kotler, 2002) satisfaction is a
feeling of pleasure or disappointment someone who
appears after comparing between perceptions / im-
pressions of the performance (or results) of a prod-
uct and its expectations. The level of satisfaction is a
function of the difference between perceived perfor-
mance and expectations. If the performance is below
expectations, the customer will be disappointed. If
performance is in line with expectations, customers
will be satisfied. Whereas if the performance exceeds
expectations, customers will be very satisfied. Cus-
tomer expectations can be shaped by past experiences,
comments from relatives and promises and market-
ing information and things. Satisfied customers will
be longer, less price sensitive and have good com-
ments. To create customer satisfaction, it must create
and manage a system to obtain more customers and
the ability to retain customers (Hill, 1966; Price et al.,
2015).
According to Sari (2011) to assess the level of
customer satisfaction and assessment of market ser-
vice conditions can be seen from the completeness
of goods, certainty of the price of goods, quality of
goods, market convenience, market cleanliness, fa-
cilities and market security. As for the assessment
of market service conditions, it can be seen from the
courtesy of traders, merchant alertness and merchant
hospitality. To realize a clean, safe and comfortable
traditional market. Need to be supported by the avail-
ability of good facilities and infrastructure. Facilities
are supporting facilities that function for the imple-
mentation and development of economic, social and
cultural life, such as parking facilities, health facili-
ties, facilities of worship. Infrastructure is a complete
physical environment that allows the market environ-
ment to function properly, such as landfills, drainage
networks, sewerage drains, signs.
2 RESEARCH METHODS
Perception is the presumption of something or a cer-
tain social condition based on the social construction
created in the community. Perception is an experi-
ence or assessment of objects, events, or relationships
that are obtained by deducing information or convey-
ing messages (Hariyono, 2007). The market which is
the center of the crowd is perceived by everyone dif-
ferently. As a means of shopping for the community,
the market is able to create perceptions of each visitor
about their own functions and benefits. The results of
this study will explore the perception of community
shopping in the use of trade facilities in Pekanbaru
City.
The purpose of this study is to determine the pub-
lic perception of traditional market services in Pekan-
baru City. The scope of the area in this study is the ad-
ministrative area of Pekanbaru City consisting of ten
traditional markets managed by the Pekanbaru City
Market Service (Pekanbaru, 2013b), namely:
• Sukaramai Market in Jendral Sudirman Street,
Pekanbaru Kota District
• Inpres H. Agussalim Market in H. Agussalim
Street, Pekanbaru Kota District
• Senapelan Market in Jendral Ahmad Yani Street,
Sukajadi District
• Limapuluh Market in Sultan Syarief Kasim Street,
Limapuluh District
• Bawah Market in Saleh Abbas Street, Senapelan
District
• Sail Market in Hangtuah Street, Sail District
• Rumbai Market in Kayangan Street, Rumbai Pe-
sisir District
• Labuh Baru Market in Durian Street, Labuh Baru
District
• Simpang Baru Market in Soebrantas Street, Tam-
pan District
• Cik Puan Market in Tuanku Tambusai Street,
Sukajadi District
ICoSET 2019 - The Second International Conference on Science, Engineering and Technology
170

The approach used in this study uses descriptive
research methods by identifying object of research
through a description, understanding or explanation
of the analysis that is measurable or not measurable.
The field survey was carried out by distributing ques-
tionnaires to the public/buyers on traditional markets
that were carried out in the morning at 06.00 am until
12:30 am on April 8-23, 2015. The hours were chosen
because the majority of traders sell and make buying
and selling transactions to buyer at this time.
The sampling technique used is accidental sam-
pling. According to Sugiyono (2010) accidental sam-
pling is a technique of determining samples based on
chance, that is, anyone who accidentally meets with
a researcher can be used as a sample, if the person
who happened to be found is suitable as a data source.
According to (Arikunto, 2002) the determination of
sampling is if less than 100 is better taken all until
the research is population research. If the number of
large subjects can be taken between 10-15% or 20-
55% or more depending on the ability of researchers
related to time, energy and funds, the area of observa-
tion of each subject because it involves a lot of funds,
and the size of the risk by researchers. The number of
samples to be studied is calculated using the Slovin
formula (Sangaji, 2010):
n =
N
1 + Ne
2
(1)
n = sample size
N = population size
e = critical value (accuracy limit) desired (0-10%)
According to data obtained from Pekanbaru
Central Statistics Agency (BPS) (Pekanbaru, 2013a),
the population of Pekanbaru in 2013 was 999,031
people. Then the amount is calculated into the Slovin
formula with an estimated error of 6% so that it can
be known as follows:
n =
999.031
1+999.031(6%)
2
n =
999.031
1+9943(0.06)
2
n =
999.031
3597.5
n = 277,7400 = 278 people
Based on these calculations the total number of
samples to be taken is 278 respondents, then for 8
traditional markets consists of 28 respondents and 2
markets with 27 respondents. Distribution of ques-
tionnaires was conducted in ten traditional markets in
Pekanbaru City. In carrying out this research, data
collection techniques carried out were the distribution
of questionnaires or interviews directly with respon-
dents, observations or direct observations in the field
to find out market conditions to traders, and documen-
tation. To collect data in this study follows variables
and indicators that have been extracted from theories
about traditional market services as presented in Table
1.
Table 1: Research Variables
Research Ob-
jectives
Variables Indicators
Identify the
level
of customer
satisfaction in
traditional
markets
Identification
of availabil-
ity
and condi-
tion
of facilities
and
infrastructure
1. Completeness
of goods
2. Price Certainity
3. Quality of
Goods
4. Market Conve-
nience
5. Market Cleanli-
ness
6. Complete Facil-
ities
7. Security
Identify as-
sessments of
traditional
market service
conditions.
Identification
of the role
of mar-
ket traders
towards
consumers
1. Courtesy of
merchants
2. Efficacy of
traders
3. Hospitality of
traders
Field surveys are carried out by distributing ques-
tionnaires to the public / buyers. In traditional mar-
kets, this research was conducted in the morning at
06.00 WIB until 12.30 WIB on April 8-23, 2015. The
hour was chosen because the majority of traders sell
and buy and sell transactions to buyers at that hour.
3 RESULTS AND DISCUSSION
3.1 Distribution of Traditional Markets
in Pekanbaru City
Placement of market location will affect the range
of market services for users. Market placement will
also affect the perceptions of community shopping.
Pekanbaru City is a city with a population of 999,031
people. To fulfill their daily needs, the community
conducts buying and selling activities in traditional
markets. Pekanbaru City has ten traditional markets
under the management of the Pekanbaru City Govern-
ment, especially the Pekanbaru City Market Service.
The Community Perception of Traditional Market Services in Pekanbaru City, Riau Province
171
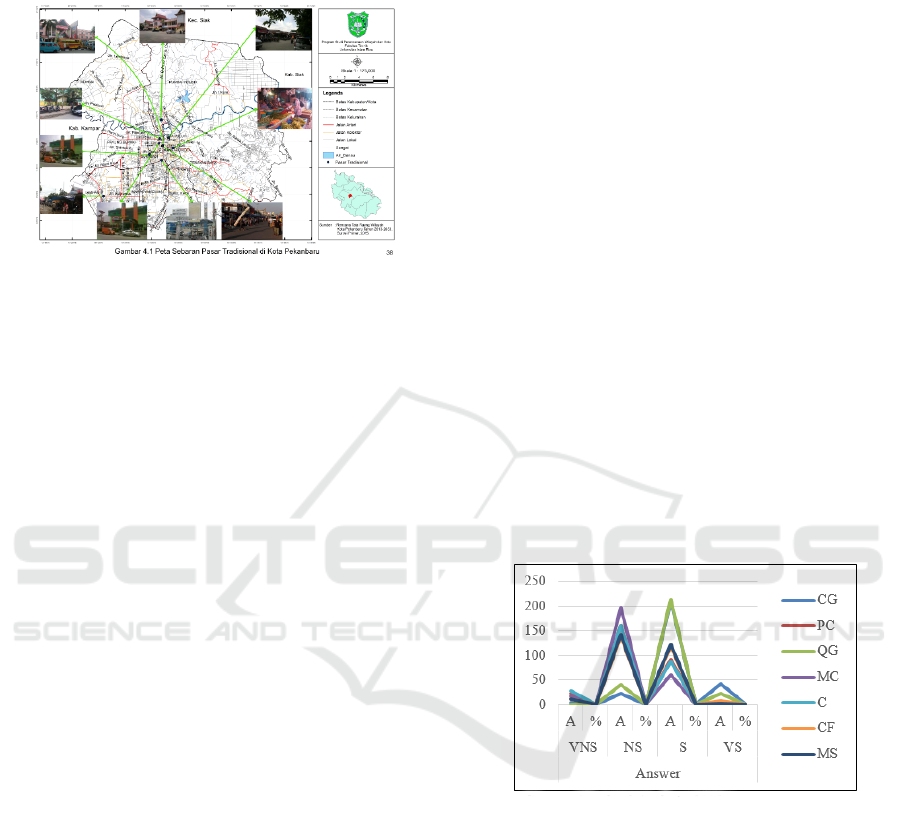
Figure 1 is the distribution of traditional markets in
Pekanbaru City.
Figure 1: Distribution of Traditional Markets Location in
Pekanbaru City
3.2 Characteristics of Respondents
The majority of consumers or respondents are female
(84.98%) are on average over 30 years old (75.54%).
The biggest traditional market user is housewife of
60.43%. The population of Pekanbaru City consists
of Malays, Minang, Javanese, Batak Tribe, the re-
maining various other tribes. Traditional market con-
sumers are dominated by Malays (48.92%) and Mi-
nang (32.37%) with the largest number of family
members owned by consumers (1-5.75%). The in-
come of visitors/buyers in traditional markets is be-
tween Rp. 1,000,000 - 2,900,000 (92.81%) and grad-
uated from senior high school (57.19%).
3.3 Identification of Consumer
Satisfaction Levels in Traditional
Markets
Based on the answers of 278 respondents in all tra-
ditional markets in Pekanbaru City, for completeness
of the items respondents chose 75.54% at the satis-
fying level. This is because the fulfillment of all the
needs of consumers in buying all their needs. For cer-
tainty of the price of goods, highest percentage is at
57.55% where respondents choose unsatisfactory, this
is contrary to the characteristics of traditional mar-
kets, where in the process of bargaining is created
which has no fixed price but consumers here pro-
vide sufficient ratings high for certainty of the price
of goods. This is because the average price agreed
upon by the respondents with all the traders on the
market is almost the same, so the respondents chose
uncertain price.
The level of consumer satisfaction on the quality
of goods can be seen with the highest percentage of
respondents satisfying with a value of 76.98%, where
the respondents rated the basic needs here as having
good quality because basic goods always change with
new and fresh goods fresh supplied from West Suma-
tra Province and North Sumatra Province. For market
convenience the highest percentage of 70.86% of re-
spondents voted unsatisfactory because respondents
rated traditional markets on busy days visitors felt
very hot and jostling which resulted in inconvenience.
The level of customer satisfaction on market
cleanliness, the respondents chose 57.55% to be un-
satisfactory. This happened because respondents con-
sidered the cleanliness of the traditional market was
far from being adequate or satisfying, it was muddy
and smelly. However, in some traditional markets,
cleanliness has been regularly managed, although it
still needs to be improved. For complete facilities the
highest percentage is unsatisfactory with a value of
50.00%. This reflects the still many unsatisfactory
market facilities that can even be said to be inade-
quate. This is one of the weaknesses of the traditional
market. The level of consumer satisfaction with mar-
ket security, respondents chose 51.08% to be unsatis-
factory. This proves that there is still a lack of market
security felt by the respondents, especially the very
vulnerable cases of pickpocketing.
Figure 2: Graph of the Level Satisfaction of Consumer in
Traditional Market, Pekanbaru City
3.4 Assessment of the Conditions of
Service of Traditional Markets
The service quality of market facilities will provide
comfort to consumers who will come to shop. Factors
that become elements of service include courtesy of
merchants, merchant alertness and merchant friendli-
ness. Table 3 shows the community’s assessment of
traditional market services in Pekanbaru City.
Based on the answers of 278 respondents who
were in all traditional markets in Pekanbaru, the as-
sessment of the courtesy of traders in doing service,
the highest percentage was in the satisfactory choice
ICoSET 2019 - The Second International Conference on Science, Engineering and Technology
172
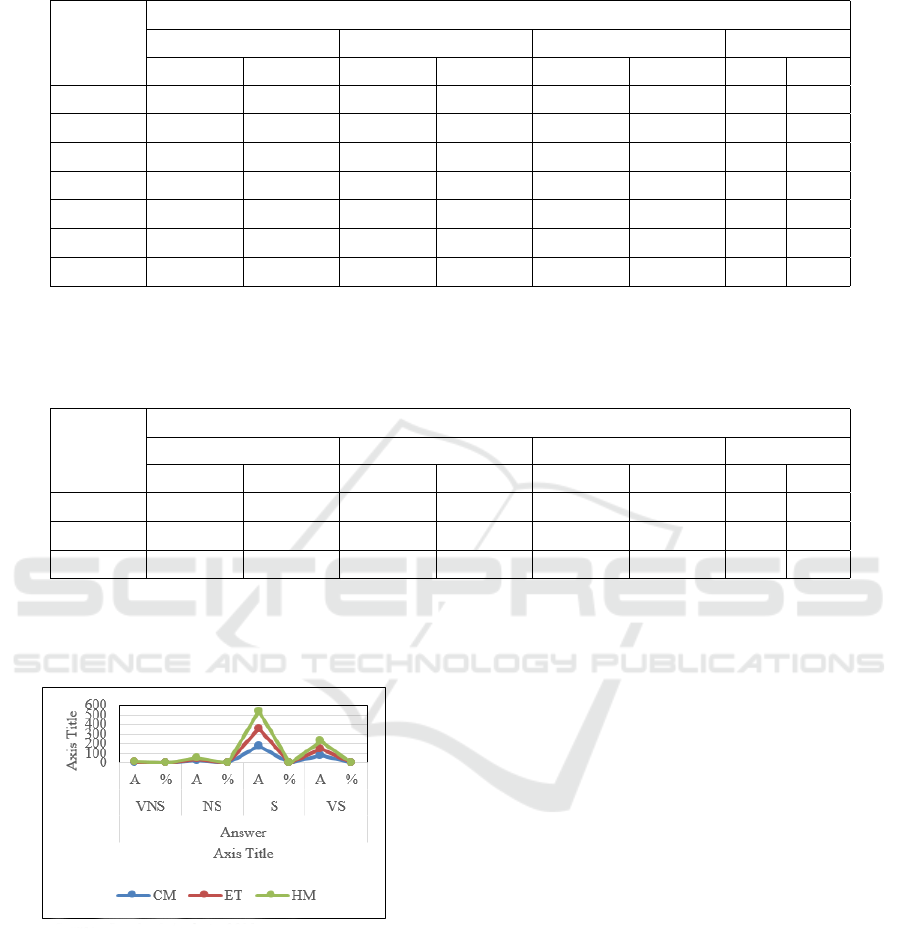
Table 2: Level of Satisfaction of Traditional Market Consumers in Pekanbaru City
SL
Answer
VNS NS S VS
A % A % A % A %
CG 4 1.44 22 7.91 210 75.54 42 15.11
PC 22 7.91 160 57.55 91 32.73 5 1.8
QG 1 0.36 41 14.75 214 76.98 22 7.91
MC 17 6.12 197 70.86 61 21.94 3 1.08
C 28 10.07 160 57.55 87 31.29 3 1.08
CF 12 4.32 139 50 119 42.81 8 2.88
MS 11 3.96 142 51.08 123 44.24 2 0.72
Note:
A: Amount; SL: Satisfaction Level; CG: Completeness of Goods; PC: Price Certainty; QG: Quality of Goods; MC: Market
Convenience; C: Cleanliness; CF: Complete Facilities; MS: Market Security; VNS: Very Not Satisfying; NS: Not Satisfying;
S: Satisfying; VS: Very Satisfying
Table 3: Assessment of Traditional Market Services in Pekanbaru City
ASC
Answer
VNS NS S VS
A % A % A % A %
CM 4 1.44 21 7.55 174 62.59 79 28.42
ET 5 1.8 18 6.47 185 66.55 70 25.18
HM 3 1.08 12 4.32 181 65.11 82 29.5
Note:
A: Amount; ASC: Assessment of Service Conditions; CM: Courtesy of Merchants; ET: Efficacy of Traders; HM: Hospitality
of Merchants; VNS: Very Not Satisfying; NS: Not Satisfying; S: Satisfying; VS: Very Satisfying
Figure 3: Traditional Market Services Assessment Graph in
Pekanbaru City
of 62.82%. This is because the traders are quite polite
in serving the respondents and there is an interaction
that creates intimacy between the traders and buyers
and the traders use neat clothes, good words and al-
ways give a smile to the buyers. the results of the per-
centage to satisfy are quite high at 66.43%. Respon-
dents considered that when the respondents came to
the outlets or kiosks of the merchants, they were swift
and deft in welcoming and explaining the items avail-
able and had a quick response in serving the buyers.
Friendly is one way to attract customers or buy-
ers. This is what traders on the market do. So that
prospective buyers want to buy where they sell. The
assessment of merchant friendliness in service to con-
sumers is at a satisfactory level of 64.98%, where
the respondents are satisfied with the hospitality that
occurs due to direct interaction between sellers and
buyers. The hospitality of the merchants was felt
by consumers when the respondents passed the shops
or shops of the merchants, where they immediately
greeted the respondents to be able to stop by where
they were selling. The hospitality of traders is able to
provide a sense of family and comfort to the respon-
dents or buyers.
4 CONCLUSIONS
Based on the research, the conclusions are as follows:
• The distribution of traditional markets in Pekan-
baru City is in close proximity to the city center.
The Community Perception of Traditional Market Services in Pekanbaru City, Riau Province
173

• The level of community satisfaction with com-
pleteness, quality, safety, cleanliness and comfort
related to the condition of traditional markets in
Pekanbaru City is in a condition that is not satis-
factory and has not met expectations of the com-
munity.
• Community assessment of the merchant condi-
tions services has met criteria expected by the
community.
ACKNOWLEDGEMENTS
This research was supported by Departement of Ur-
ban and Regional Planning, Faculty of Engineering,
Universitas Islam Riau. We thank our colleagues from
Pekanbaru City Governement who provided insight
and expertise that greatly assisted the research, al-
though they may not agree with all of the interpre-
tations/conclusions of this paper.
REFERENCES
Arikunto, S. (2002). Prosedur Penelitian Suatu Pendekatan
Praktek.
Bangia, A., Diebold, F. X., Schuermann, T., and Stroughair,
J. (2008). Modeling liquidity risk with implications
for traditional market risk measurement and manage-
ment.
Dasgupta, C. G., Dispensa, G. S., and Ghose, S. (1994).
Comparing the predictive performance of a neu-
ral network model with some traditional market re-
sponse models. International Journal of Forecasting,
10(2):235–244.
Hariyono, P. (2007). Sosiologi Kota untuk Arsitek.
Hill, P. (1966). Notes on traditional market authority and
market periodicity in west africa. The Journal of
African History, 7(2):295–311.
Kotler, P. (2002). Manajemen Pemasaran, Edisi Millenium,
Jilid 2.
Linda, E. Y. (2008). Persepsi Masyarakat Terhadap
Pelayanan Fasilitas Pasar Kota Batu.
Pekanbaru, B. P. S. P. K. (2013a). Kota Pekanbaru dalam
Angka Tahun 2013. Pekanbaru, BPS Kota Pekanbaru.
Pekanbaru, D. P. K. (2013b). Ekspose Profil Dinas Pasar.
Price, R. A., Wrigley, C., and Straker, K. (2015). Not just
what they want, but why they want it: Traditional
market research to deep customer insights. Qual-
itative Market Research: An International Journal,
18(2):230–248.
Witell, L., Kristensson, P., Gustafsson, A., and L
¨
ofgren, M.
(2011). Idea generation: customer co-creation versus
traditional market research techniques. Journal of Ser-
vice Management, 22(2):140–159.
ICoSET 2019 - The Second International Conference on Science, Engineering and Technology
174
