
Effect of Arthrospira maxima Setchell et Gardner and Chlorella
vulgaris Beijerinck on Eritrhocyte and Thrombocyte Profile of
Hyperglycemia Wistar Rats (Rattus norvegicus Berkenhout, 1769)
Mulyati
1*
, Slamet Widiyanto
1
,
and Lasmini Syariatin
1
1
Laboratory of Animal Physiology, Departement of tropical Biology, Faculty of Biology, Universitas Gadjah Mada,
Sleman, D. I. Yogyakarta, Indonesia
Keywords: Arthrospira maxima, Chlorella vulgaris, Erithrocyte profile, Thrombocyte profile, Hyperglycemia
Abstract: Community diet patterns that tend to be unhealthy with the consumption of fast food can cause metabolic
disorders or metabolic syndromes such as diabetes mellitus. Diabetes mellitus is characterized by a chronic
hyperglycemia condition that is an increase in blood glucose levels and keto-acidosis. Handling of diabetes
mellitus patients using synthetic chemical drugs has dangerous side effects. The aims of this study examines
the effect of microalgae that is suspected of being potential as an alternative medicine for the prevention or
cure of diabetes mellitus. The purpose of this study was to determine the effect of administration of
Arthrospira maxima and Chlorella vulgaris on the erythrocyte and platelet profiles of Wistar rats (Rattus
norvegicus Berkenhout, 1769) hyperglycemia on the induction of DMT2. Twenty Wistar male rats were
divided into 5 groups consisting of three control groups namely healthy controls, hyperglycemia, and drugs,
and 2 treatment groups namely A. maxima and C. vulgaris. DMT2 induction uses a high carbohydrate diet
and a single dose streptozotocin. Erythrocyte and platelet profiles were measured at D0, D15, and D30. Body
weight and blood glucose levels are measured every 10 days. Data were analyzed using One-Way ANOVA.
The erythrocyte profile was low in the control hyperglycemia rat after DM induction of D15. Erythrocyte
profiles in hyperglycemia rat with this microalgae treatment, not significantly increased (p>0.05). Platelet
profile in both the hyperglycemia and treatment groups was not significantly affected (p>0.05). Erythrocyte
profiles in hyperglycemic rats have increased, platelet profile have decreased, and returned to better conditions
after being given A. maxima and C. vulgaris.
1 INTRODUCTION
Healthy food is food that is good in the processing,
cooking, serving, packaging and contains nutrients
that are good function for the body. Foods that are
publicly marketed today are foods that are ready to
eat, good taste, look attractive, prices are relatively
cheap, but the nutritional content is low and
sometimes contains contaminants. Fast food products
are increasingly becoming the menu of choice for
most people rather than traditional foods. Good taste
that appears because there is a high fat content.
Increased fast food that increases without being
balanced with adequate exercise can cause metabolic
syndromes such as obesity and diabetes (Monteiro et
al., 2016).
Metabolic syndrome is a set of factors consisting
of hypertension, hyperglycemia, hyperlipidemia, and
obesity that are closely related to the disruption of
diabetes mellitus (Bonomini, Rodella, & Rezzani,
2015). Hyperglycemia is a condition of high glucose
levels in the blood caused by consumption of high
carbohydrates, stress conditions, and keto-acidosis
(Lanywati, 2001)(Moore, 2008). Diabetes Mellitus
Type 2 (DMT2) with insulin resistance has a high
global pravalence including in Indonesia even
reaching 90% (Anonim, 2014).
Patients with diabetes mellitus are often treated
using synthetic chemical therapy that have side
effects and need to avoid danger. Research on
alternative therapy for the prevention or cure of
diabetes mellitus is currently being done. One
material that is widely studied is microalgae.
Microalgae, especially cyanobacteria, are known to
have therapeutic abilities (Belay, Ota, Miyakawa, &
Shimamatsu, 1993).
Mulyati, ., Widiyanto, S. and Syariatin, L.
Effect of Arthrospira maxima Setchell et Gardner and Chlorella vulgaris Beijerinck on Eritrhocyte and Thrombocyte Profile of Hyperglycemia Wistar Rats (Rattus norvegicus Berkenhout,
1769).
DOI: 10.5220/0009127602090219
In Proceedings of the 2nd Health Science International Conference (HSIC 2019), pages 209-219
ISBN: 978-989-758-462-6
Copyright
c
2020 by SCITEPRESS – Science and Technology Publications, Lda. All rights reserved
209

Chlorella sp. is an algae that can overcome heavy
metals that are diabetagenic such as mercury and
cadmium. Arthrospira maxima also has other
nutritional components such as minerals, vitamins,
chlorophyll, glycolipids, phycocyanin, carotenoids,
tocopherols, linolenic acids, phenolic compounds,
sulfolipids, and Superoxide Dismutase (SOD) as an
antioxidant that is abundant in the activity of Reactive
Oxigen Species (ROS) (Cousens, 2007)(Farag,
Alagawany, El-Hack, & Dhama, 2016). In addition,
this study also uses metformin as an anti-
hyperglycemia agent(Mantzoros, 2006).
In the condition of hyperglycemia, glucose levels
in cell fluid are also high. This situation has the
potential to interfere with the function of cells to
organs, including blood with its components. This is
presumably because erythrocytes exposed to high
glucose will change their character and become easily
damaged and activate platelet function. The purpose
of this study was to determine the effect of
administration of Arthrospira maxima and Chlorella
vulgaris on the erythrocyte and platelet profiles of
Wistar rats (Rattus norvegicus Berkenhout, 1769)
hyperglycemia on the induction of DMT2.
2 METHODS
This research is part of Mulyati (2017) regarding
physiological responses in DMT2 induced rat with
high carbohydrate diet and continued with the
Widiyanto (2018) research concerning the effect of
administration of Spirulina sp. and Chlorella sp. to
the physiological response of White Rat (Rattus
norvegicus Berkenhout, 1769) on the induction of
DMT2. The study was conducted at the UGM Unit IV
Integrated Research and Testing Laboratory (LPPT)
as a place for acclimation, maintenance, treatment,
and testing of blood glucose levels on animal models.
This study is a following by study of hyperglycemia
rat research with induction of high carbohydrate diet
and low dose STZ that took place in May to October
2017 with an ethical clereance certificate numbered:
00097/04 / LPPT / VIII / 2017. Then followed by this
study which began from 11 December 2017 to 11
January 2018 after obtaining approval from the
Animal Ethics Commission Team with certificate
number: 00167/04 / LPPT / I / 2018.
Test animals in this study were white rats (Rattus
norvegicus, Bekenhout 1769) male Wistar strain
obtained from LPPT UGM Unit IV. Rats aged 19
weeks weighing 300-400 grams after being induced
by DMT2 and high carbohydrate diets. Twenty white
rats were acclimated for 7 days and grouped
randomly. Each cage consist of 4 rat.
Animal models are given commercial standard
feed and given reverse osmosis (RO) drinking water.
There are two stages of treatment in this study. The
first stage is the induction of DMT2 by administering
high carbohydrate diet and followed by injection of
30mg/kg.bw low dose streptozotosin (STZ) to obtain
animal models of hyperglycemia for 45 days. The
study continued with the induction of hyperglycemia
using low-dose STZ booster on intraperitonially for
10 days before the treatment of microalgae and
diabetes/metformin drugs.
The dosage given for each microalgae is 2500
mg/kg.bw dissolved in 12 ml of distilled water and
metformin 10 mg/kg.bw dissolved in 4 ml of distilled
water. Body weight and glucose levels are measured
every 10 days. Hematology profiles are measured at
D0, D15, and D30 and tested using a hematology
analyzer. The results of the data were analyzed using
One-Way ANOVA on SPSS 16.0.
Table 1: Grouping animal model
No. Groups Explanation
1. Negative Control (NC) Without treatment
2. Positive Control (PC) Hiperglicemic Control
3 Treatment 1 (M) Metformin 100 mg/kg.bw in doses after hiperglicemia
4. Treatment 2 (AMX) Arthrospira maxima 2500mg/kg.bw in doses after hiperglicemia
5. Treatment 3 (CVL) Chlorella vulgaris 2500mg/kg.bw in doses after hiperglicemia
HSIC 2019 - The Health Science International Conference
210

3 RESULTS AND DISCUSSION
The results of this study present the effect of
consumption of Arthrospira maxima and Chlorella
vulgaris at a dose of 2500 mg/kg.bw on erythrocyte
profiles consisting of RBC, Hgb, HCT, MCV, MCH,
MCHC, and platelet profiles consisting of Platelets,
MPV, PDW, P-LCR, and PCT along with supporting
data in the form of body weight and blood glucose.
The results are presented in tabular and figure form as
follows:
Rat body weight is secondary data that is used as
supporting data for blood chemical levels that have
been tested. While the data of blood glucose levels as
a mark to determine the success of induction of
hyperglycemia. The mean of the data can be
presented in the form of a continue graph which is
presented as figure 1, table 2 and table 3.Negative or
healthy control group increased not significant in
body weight that showed to be stable. This is due to
the fact that rats are given feed and drink in an
adlibitum routinely so that they are growth and
development. Healthy control have undisturbed
metabolism. In the group of treated rats (positive
control, A. Maxima, C. Vulgaris, and Metformin)
weight low increased not significant. This can be due
to the induction of STZ given which makes high
glucose levels.
Blood glucose levels in hyperglycemia group has
higher blood glucose levels compared to negative
control group and shows the success of STZ
induction. Rats glucose levels increase after 3 days
induced hyperglicemia and decrease after 10 days
induced hyperglicemia. Decrease in all groups
occurred insignificantly. According to Yosti's
research (2017), Chlorella vulgaris can reduce blood
glucose levels at a dose of 4 mg/20 g.bw. A. Maxima
was proven to have a protein of 65-70% and high
fiber, vitamins and minerals. The beneficial effects of
spirulina are for the treatment of malnutrition,
obesity, and diabetes mellitus which have been
reported by (Ambrosi, Reinehr, Bertolin, Costa, &
Colla, 2005).
Table 2: Body weight of Wistar rats (Rattus norvegicus Berkenhout, 1769) hyperglycemia treated with A. maxima and C.
vulgaris for 30 days.
Groups
Body Weight (gram)
H 0 H 10 H 20 H 30
NC 358.00 ± 34.52
b,x
370.75 ± 38.95
b,x
376.20 ± 44.77
b,x
385.60 ± 52.93
b,x
PC 276.25 ± 25.66
a,x
289.43 ± 27.43
a,x
290.15 ± 23.31
a,x
296.17 ± 28.13
a,x
M 288.00 ± 30.31
a,x
294.13 ± 41.21
a,x
299.40 ± 42.34
a,x
308.43 ± 43.58
a,x
AMX 300.15 ± 28.67
a,x
304.30 ± 28.89
a,x
299.13 ± 28.39
a,x
302.03 ± 30.75
a.x
CVL 295.10 ± 41.73
a,x
299.35 ± 44.11
a,x
297.93 ± 43.24
a,x
300.95 ± 48.43
a,x
Notation a, b, c to compare between treatment groups on the same day (column), while x, y, z to compare between days on
the same treatment group (row).
Table 3. Blood glucose of Wistar rats (Rattus norvegicus Berkenhout, 1769) hyperglycemia treated with A. maxima and C.
vulgaris for 30 days.
Groups
Blood Glucose Level (mg/dL)
H -7 H 0 H 15 H 30
NC 81 ± 12.69
a,x
87 ± 4.08
a,x
106 ± 10.60
a,x
96 ± 8.77
a,x
y
PC 250 ± 99.95
c,x
296 ± 55.09
b
,x
184 ± 104.98
a,x
186 ± 75.26
a,x
M 237 ± 105.75
bc,x
292 ± 134.32
b,x
193 ± 82.10
a,x
223 ± 127.06
a,x
AMX 190 ± 14.39
bc,x
210 ± 79.19
ab,x
175 ± 62.95
a,x
187 ± 110.62
a,x
CVL 139 ± 33.64
ab,x
277 ± 185.48
b,x
142 ± 62.89
a,x
153 ± 68.16
a,x
Notation a, b, c to compare between treatment groups on the same day (column), while x, y, z to compare between days on
the same treatment group (row).
Effect of Arthrospira maxima Setchell et Gardner and Chlorella vulgaris Beijerinck on Eritrhocyte and Thrombocyte Profile of
Hyperglycemia Wistar Rats (Rattus norvegicus Berkenhout, 1769)
211
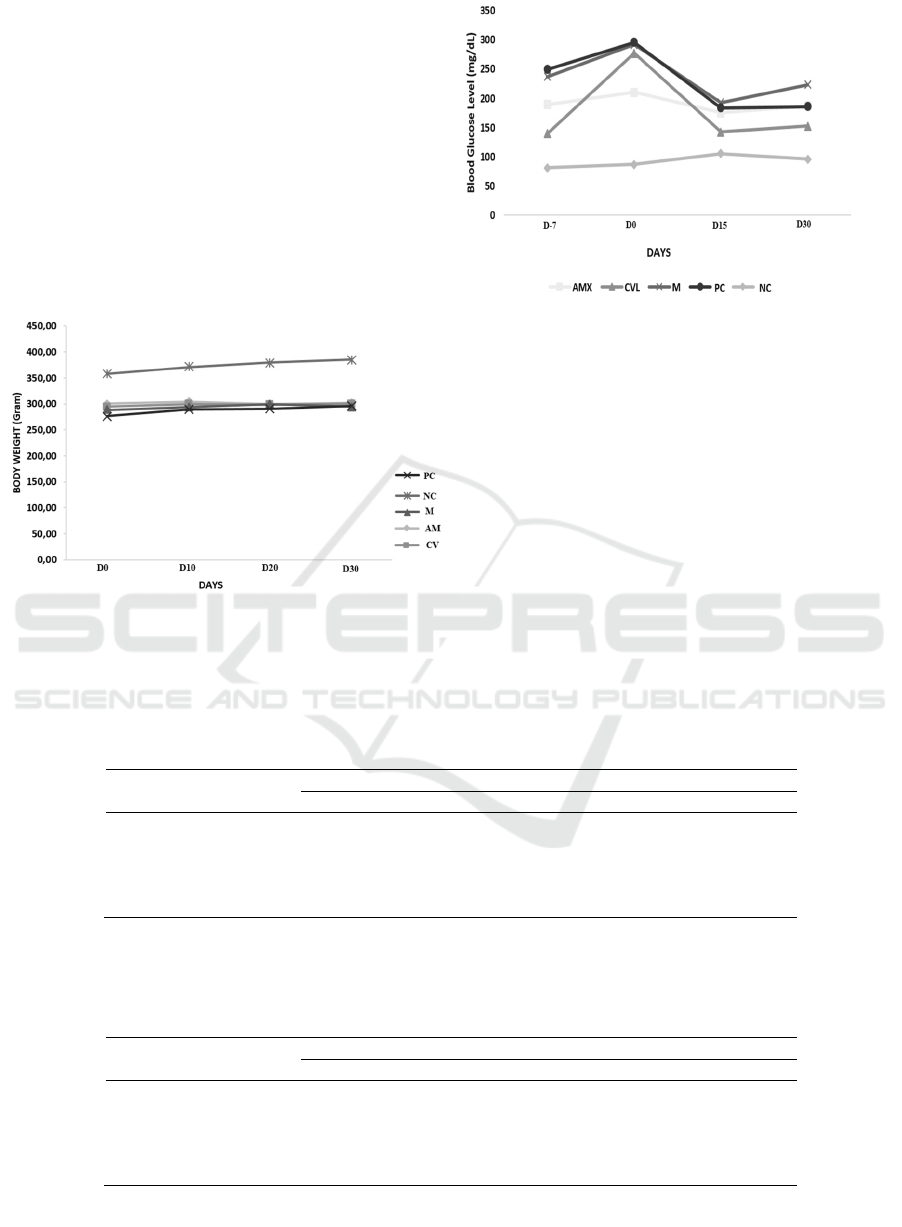
Figure 1: Body weight (a) and Blood Glucose Levels(b) of Wistar Rats (Rattus norvegicus Berkenhout,1769) hyperglycemia
treated with A. maxima and C. vulgaris for 30 days.
Table 4. Red blood cells of Wistar rats (Rattus norvegicus Berkenhout, 1769) hyperglycemia treated with A. maxima and C.
vulgaris for 30 days.
Groups
Days
0 15 30
Healthy control 7.93 ± 0.2
b
,x
7.97 ± 0.31
a,x
7.74 ± 0.32
a,x
Hiperglicemia control 7.76 ± 0.25
b
,x
8.06 ± 0.54
a,x
8.03 ± 0.35
a,x
Metformin 7.32 ± 0.66
a,x
8.08 ± 0.44
a,
y
8.22 ± 0.12
a,
y
Arthrospira maxima 7.91 ± 0.33
b
,x
7.89 ± 0.18
a,x
8.12 ± 0.19
a,x
Chlorella vulgaris 7.68 ± 0.17
b
,x
7.54 ± 0.43
a,x
8.04 ± 0.32
a,x
Notation a, b, c to compare between treatment groups on the same day (column), while x, y, z to compare between days on
the same treatment group (row).
Table 5: Hematocrite levels of Wistar rats (Rattus norvegicus Berkenhout, 1769) hyperglycemia treated with A. maxima and
C. vulgaris for 30 days.
Groups
Days
0 15 30
Healthy Control 43.93 ± 0.90
a,x
43.30 ± 2.46
a,x
43.18 ± 1.05
a,x
Hiperglicemia Control 42.63 ± 2.22
a,x
45.23 ± 2.61
a,x
44.13 ± 2.34
a,x
Metformin 42.90 ± 2.47
a,x
45.37 ± 2.68
a,x
47.45 ± 1.47
a,x
Arthrospira maxima 42.55 ± 3.91
a,x
44.80 ± 0.82
a,x
45.80 ± 1.27
b
,x
Chlorella vulgaris 42.78 ± 0.75
a,x
42.83 ± 2.07
a,x
44.08 ± 1.77
a,x
Notation a, b, c to compare between treatment groups on the same day (column), while x, y, z to compare between days on
the same treatment group (row).
HSIC 2019 - The Health Science International Conference
212
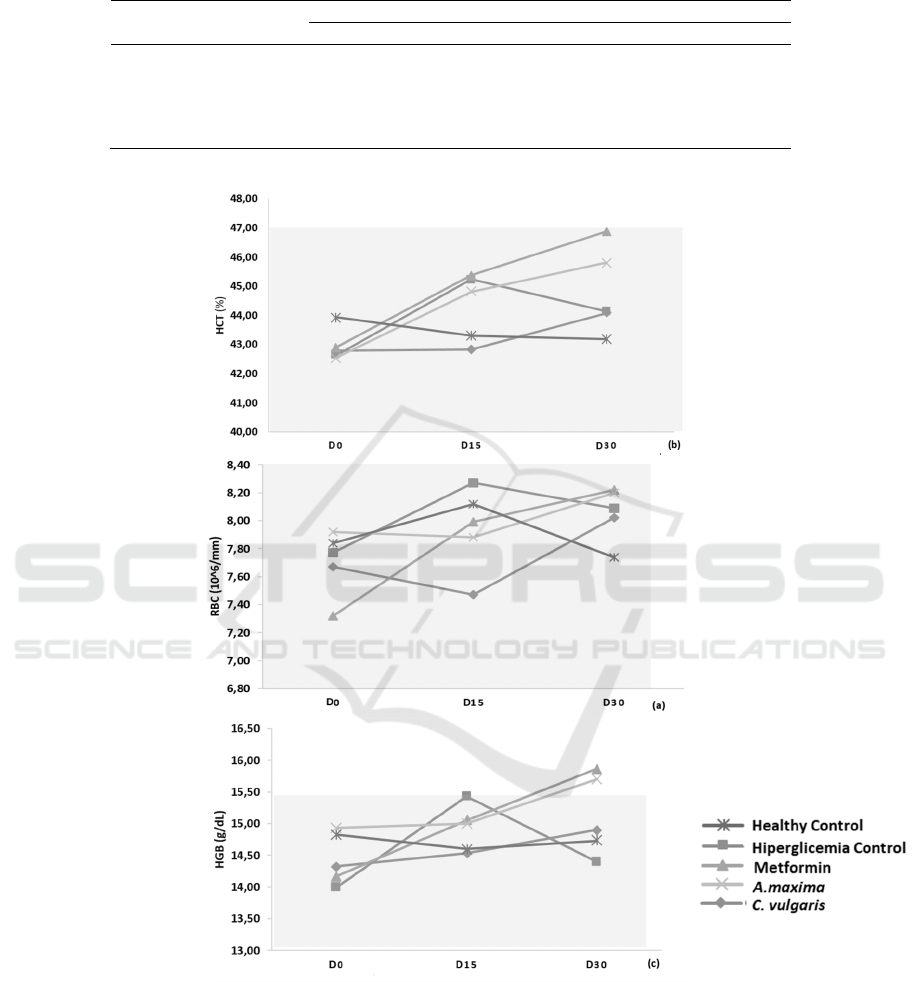
Table 6. Hemoglobine levels of Wistar rats (Rattus norvegicus Berkenhout, 1769) hyperglycemia treated with A. maxima and
C. vulgaris for 30 days.
Groups
Days
0 15 30
Healthy control 14.98 ± 0.47
a,x
14.53 ± 0.40
a,x
14.70 ± 0.32
a,x
Hiperglicemia control 14.25 ± 1.01
a,x
15.40 ± 0.62
a,x
14.68 ± 0.66
a,x
Kontrol obat 14.50 ± 0.82
a,x
15.48 ± 0.98
a,x
y
15.85 0.5
b
,
y
Athrospira maxima 14.25 ± 1.51
a,x
15.23 ± 0.46
a,x
15.63 0.40
b
,x
Chlorella vulgaris 14.30 ± 0.41
a,x
14.45 ± 0.45
a,x
14.50 ± 0.82
a,x
Notation a, b, c to compare between treatment groups on the same day (column), while x, y, z to compare between days on
the same treatment group (row).
Figure 2: Red blood cells (a), Hematocrit levels (b), and Hemoglobin levels (c) Wistar rats (Rattus norvegicus, Berkenhout
1769) hyperglycemia with the treatment of Chlorella vulgaris and Arthrospira maxima for 30 days. Note: the blue box in
Fig.2 shows the normal region of that level.
Based on reference data (Syariatin & Mulyati,
2017) a normal RBC range of 6.03-8.4 x 10⁶ cells/uL
is obtained. Figure 2a shows that hiperglicemia rats
group have increased but are still in the normal range.
Other groups experienced fluctuations in RBC values
but were still in the normal range and no significant
difference (p>0.05) on the average number of red
blood cells affected by the factors and overall time.
Groups of rats treated with metformin had significant
differences in H0, H15, and H30 (p<0.05). This
Effect of Arthrospira maxima Setchell et Gardner and Chlorella vulgaris Beijerinck on Eritrhocyte and Thrombocyte Profile of
Hyperglycemia Wistar Rats (Rattus norvegicus Berkenhout, 1769)
213

shows that the administration of metformin 10
mg/kg.bw. can increase the RBC value and return as
normal. Administration of C. vulgaris and A. Maxima
at a dose of 2500 mg/kg.bw for 30 days was classified
as being able to increase the total number of
erythrocytes even though it was not significant
(p<0.05).
Based on data (Syariatin & Mulyati, 2017) a
normal range of hematocrit values was obtained
between 34.6-47%. Fig. 2b shows that in all groups
fluctuations in hematocrit values occurred. According
to Emami's research shows that PVC in diabetics has
decreased when compared to non-diabetics. The
decrease in PCV in diabetics is possible due to
dehydration and protein accumulation (Emami &
Olfati, 2017). Figure 14 shows that in D0 the
hyperglycemia induced rat group was not
significantly different from the negative / healthy
control group. In D15 the DM control mice
experienced a significant increase and decreased after
H15. This increase can be caused by correlating with
the RBC value which shows the red blood cell
production is still experiencing. But after that the
HCT decreased due to the rat successfully inducing
hyperglycemia and not receiving antidiabetic
treatment. The possibility of rats dehydrated and
characterized by a condition that is thicker blood.
Decreased HCT value correlates with RBC value
which also decreases after D15, this is due to the
kidney failing to produce erythropoietin, and an
increase in non-enzymatic reaction to glycosylation
of RBC membrane protein, and both of these are also
considered to be anemic factors (Emami & Olfati,
2017).
Based on data (Syariatin & Mulyati, 2017), the
normal Hb range is between: 11.5-15.4 g/dL. These
results indicate that Hb levels are positively
correlated with RBC values and HCT values.
Hyperglycemia group of rats, on D0-D15 has
increased, this is possible because hyperglycemia rats
are still producing erythropotein. Whereas before
D15, rats in the DM group experienced decreased Hb
levels. This is because hyperglycemic mouse
hemoglobin is bound to high blood sugar levels in the
blood stream (glycated). Hyperglicemia conditions
can lyse blood cells and reduce hemoglobin levels in
erythrocytes due to Reactive Oxygen Species (ROS)
which cause oxidative stress. The persistent condition
of hemoglobin and high glycosylation is a result of
hyperglycemia associated with structural and
functional changes in hemoglobin molecules (Hb),
osmotic disorders, and cytoplasmic viscosity in
cells(Alamri et al., 2019). Part of the glycated
hemoglobin is the heme protein associated with the
duration and level of hyperglycemia.
Table 7: Mean corpuscular Hemoglobine levels of Wistar Rats (Rattus norvegicus Berkenhout, 1769) hyperglycemia treated
with A. maxima and C. vulgaris for 30 days.
Groups
Days
0 15 30
Healthy control 18.88 ± 0.66
a,x
18.86 ± 0.96
a,x
19.00 ± 0.43
a,x
Hiperglicemia control 18.50 ± 0.88
a,x
21.65 ± 1.00
a,x
18.28 ± 1.00
a,x
Metformin 18.95 ± 1.13
a,x
18.38 ± 1.28
a,x
19.03 ± 0.87
a,x
A. maxima 18.68 ± 1.16
a,x
19.30 ± 0.93
a,x
19.30 ± 1.18
a,x
C. vulgaris 18.65 ± 0.71
a,x
19.20 ± 0.80
a,x
18.05 ± 1.39
a,x
Notation a, b, c to compare between treatment groups on the same day (column), while x, y, z to compare between days on
the same treatment group (row).
Table 8: Mean corpuscular Hemoglobine concentration levels of Wistar rats (Rattus norvegicus Berkenhout, 1769)
hyperglycemia treated with A. maxima and C. vulgaris for 30 days.
Groups
Days
0 15 30
Healthy control 34.08 ± 0.74
a,x
33.58 ± 0.99
a,x
34.05 ± 0.29
a,x
Hiperglicemia control 33.40 ± 0.63
a,x
34.10 ± 0.91
a,x
33.28 ± 0.90
a,x
Metformin 33.80 ± 0.59
a,x
32.30 ± 3.01
a,x
33.40 ± 0.42
a,x
A. maxima 33.45 ± 0.99
a,x
34.00 ± 0.50
a,x
34.15 ± 1.05
a,x
C. vulgaris 33.43 ± 0.86
a,x
33.78 ± 0.78
a,x
32.90 ± 1.01
a,x
Notation a, b, c to compare between treatment groups on the same day (column), while x, y, z to compare between days on
the same treatment group (row).
HSIC 2019 - The Health Science International Conference
214
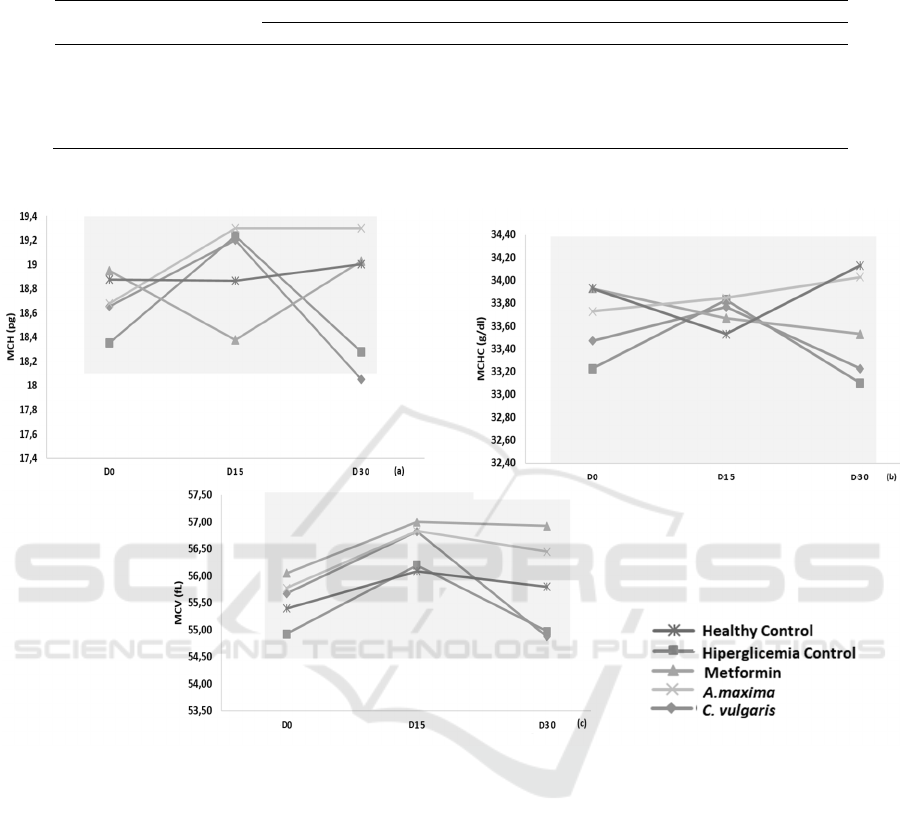
Table 9: Mean Corpuscular Volume Levels of Wistar Rats (Rattus norvegicus Berkenhout, 1769) hyperglycemia treated with
A. maxima and C. vulgaris for 30 days.
Groups
Days
0 15 30
Healthy control 55.40 ± 1.49
a,x
56.09 ± 1.28
a,x
55.80 ± 0.97
a,x
Hiperglicemia control 54.93 ± 1.70
a,x
56.20 ± 1.96
a,x
54.98 ± 1.98
a,x
Metformin 56.05 ± 2.10
a,x
57.00 ± 2.45
a,x
56.93 ± 1.56
a,x
A. maxima 55.78 ± 1.76
a,x
56.84 ± 2.16
a,x
56.45 ± 2.25
a,x
C. vulgaris 55.68 ± 0.80
a,x
56.83 ± 1.88
a,x
54.88 ± 2.59
a,x
Notation a, b, c to compare between treatment groups on the same day (column), while x, y, z to compare between days on
the same treatment group (row).
Figure 3: MCH (a), MCHC (b), and MCV levels (c) Wistar rats (Rattus norvegicus, Berkenhout 1769) hyperglycemia with
the treatment of Chlorella vulgaris and Arthrospira maxima for 30 days. Note: the blue box in Figure 3 shows the normal
region of every level.
Based on the results of the data (Syariatin &
Mulyati, 2017) the normal range of MCH values is
between 18.1-20.20 pg. All groups experienced
fluctuations and were still in the normal range. Fig.3
shows that fluctuations occur but are still in the
normal range (p>0.05). In the hyperglycemia group
MCH values increased before D15 and decreased
after D15. In the metformin group, MCH decreased
before D15, due to the induction of hyperglycemia
and increased after D15 which showed that
metformin could control the effects of hyperglycemia
thereby increasing hemoglobin levels. Indicated by
the value of MCH on D30, where the value of MCH
A. maxima has more potential to increase the value of
MCH in the blood.
Based on research (Syariatin & Mulyati, 2017) the
normal MCHC value ranges between 31.22-36.0%.
Figure 4b shows that all groups are still in the normal
range. In the DM control group, there was an increase
in the value of MCHC before D15 for 25 days of STZ
re-injection, this increase was possible because the
mice experienced still being able to do erythropoetin
production and again decreased after D15 because the
rats became more
chronic. In the treatment of
microalgae, the results shown in graph A. Maxima
show results that are more efficient than C. vulgaris.
This can be seen in A. maxima increasing
continuously from H0 to H30 and at H30 approaching
the MCHC value in the healthy control group.
Effect of Arthrospira maxima Setchell et Gardner and Chlorella vulgaris Beijerinck on Eritrhocyte and Thrombocyte Profile of
Hyperglycemia Wistar Rats (Rattus norvegicus Berkenhout, 1769)
215

Based on these data the normal range of MCV
values is obtained between 53.27-58.5 fL. At the D0
the MCV values of all groups increased and
decreased after D15. Increases and decreases in MCV
values are still in the normal range. This shows that
there is no significant effect on changes in the value
of MCV after microalgae treatment. Based on Figure
3 and Table 9 group A. maxima shows a graph that is
close to the value of the metformin treatment group.
This shows that A. maxima is far more potential to
increase the value of MCV than C. vulgaris. Based on
these results, based on the value of MCH, MCHC,
and MCV are positively correlated. A. maxima has
more potential to improve hematological parameters
and has higher Fe levels than C. vulgaris.
Table 10: Platelets total levels of Wistar rats (Rattus norvegicus Berkenhout, 1769) hyperglycemia treated with A. maxima
and C. vulgaris for 30 days.
Groups
Days
0 15 30
Healthy control 947.5 ± 128.26
a,x
952 ± 102,94
a,x
913.5 ± 116.866
a,x
Hiperglicemia control 874.25 ± 158.95
a,x
1031.75 ± 72.43
a,x
1035.75 ± 150.59
a,x
Metformin 812.75 ± 137.70
a,x
1207.25 ± 525.38
a,x
906.25 ± 102.48
a,x
A. maxima 804.25 ± 154.50
a,x
991 ± 100.191
a,x
878.5 ± 170.814
a,x
C. vulgaris 924 ± 92.34
a,x
1016.25 ± 86.55
a,x
849 ± 166.163
a,x
Notation a, b, c to compare between treatment groups on the same day (column), while x, y, z to compare between days on
the same treatment group (row).
Table 11: Platelet Distribution Weidth (PDW) levels of Wistar rats (Rattus norvegicus Berkenhout, 1769) hyperglycemia
treated with A. maxima and C. vulgaris for 30 days.
Groups
Days
0 15 30
Healthy control 7.32 ± 0.53
a.x
7.27 ± 0.51
a.x
7.35 ± 0.57
a.x
Hiperglicemia control 7.62 ± 0.43
a.b,c,x
7.52 ± 0.50
a.x
7.90 ± 0.92
a.x
Metformin 8.03 ± 0.29
a.b,x
8.28 ± 0.57
b
,x
7.825 ± 0.35
a.x
A. maxima 8.075 ± 0.39
c.x
7.73 ± 0.49
a.b,x
7.525 ± 0.40
a.x
C. vulgaris 7.43 ± 0.25
a.b,x
7.30 ± 0.14
a.x
7.825 ± 0.09
a.
y
Notation a, b, c to compare between treatment groups on the same day (column), while x, y, z to compare between days on
the same treatment group (row).
Table 12: Mean Platelet Volume (MPV) levels of Wistar rats (Rattus norvegicus Berkenhout, 1769) hyperglycemia treated
with A. maxima and C. vulgaris for 30 days.
Groups
Days
0 15 30
Healthy control 6.5 ± 0.24
a.x
6.52 ± 0.22
a.x
6.62 ± 0.41
a.x
Hiperglicemia control 6.7 ± 0.22
a.b,x
6.62 ± 0.32
a.x
6.93 ± 0.57
a.x
Metformin 7.07 ± 0.28
b
,c,x
7.05 ± 0.34
b
,x
6.83 ± 0.26
a.x
A. maxima 7.47 ± 0.49
c.
y
6.8 ± 0.25
a.b,x
6.68 ± 0.22
a.x
C. vulgaris 6.65 ± 0.17
a.b,x,y
6.55 ± 0.13
a.x
6.85 ± 0.13
a.
y
Notation a, b, c to compare between treatment groups on the same day (column), while x, y, z to compare between days on
the same treatment group (row).
Table 13: PLCR Levels of Wistar Rats (Rattus norvegicus Berkenhout, 1769) hyperglycemia treated with A. maxima and C.
vulgaris for 30 days.
Groups
Days
0 15 30
Healthy control 4.25 ± 0.49
a.x
4.57 ± 0.97
a.x
4.85 ± 1.55
a.x
Hiperglicemia control 5.23 ± 0.58
a.x
4.67 ± 1.12
a.x
5.82 ± 2.59
a.x
Metformin 6.97 ± 1.03
b
.x
6.95 ± 1.57
b
.x
5.55 ± 1.34
a.x
A. maxima 7.35 ± 1.96
b
.x
5.55 ± 1.05
a.b.x
5.25 ± 0.78
a.x
C. vulgaris 4.90 ± 1.02
a.x
4.5 ± 0.68
a.x
5.67 ± 0.54
a.x
Notation a, b, c to compare between treatment groups on the same day (column), while x, y, z to compare between days on
the same treatment group (row).
HSIC 2019 - The Health Science International Conference
216
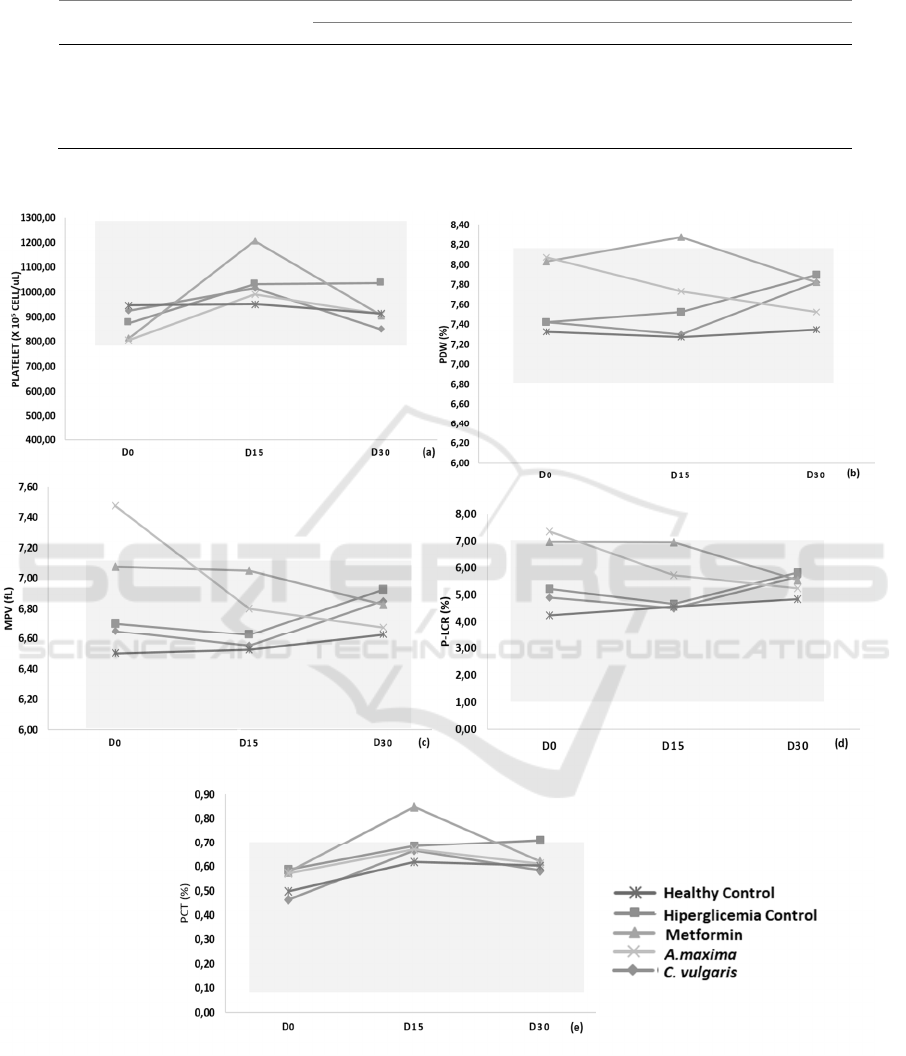
Table 14: Plateletcrit (PCT) levels of Wistar rats (Rattus norvegicus Berkenhout, 1769) hyperglycemia treated with A. maxima
and C. vulgaris for 30 days.
Groups
Days
0 15 30
Healthy control 0.50 ± 0.50
a.x
0.62 ± 0.05
a.x
0.60 ± 0.05
a.x
Hiperglicemia control 0.59 ± 0.59
a.x
0.68 ± 0.09
a.x
0.71 ± 0.07
a.x
Metformin 0.58 ± 0.58
b
.x
0.85 ± 0.36
a,x
0.62 ± 0.09
a.x
A. maxima 0.57 ± 0.57
b
.x
0.67 ± 0.03
a.x
0.61 ± 0.10
a.x
C. vulgaris 0.46 ± 0.27
a.x
0.67 ± 0.06
a.x
0.58 ± 0.12
a.x
Notation a, b, c to compare between treatment groups on the same day (column), while x, y, z to compare between days on
the same treatment group (row).
Figure 4: PLT (a), PDW (b), MPV (c), P-LCR (d), and PCT (e) Wistar rats (Rattus norvegicus, Berkenhout 1769)
hyperglycemia with the treatment of Chlorella vulgaris and Arthrospira maxima for 30 days. Note: the blue box in Figure 4
shows the normal region of every level.
Based on these data, the normal range of PLT
values can be obtained between 814-1399 x 105 cells
/ µL. Based on the results of this study indicate that
platelet values are still in the normal range. The figure
Effect of Arthrospira maxima Setchell et Gardner and Chlorella vulgaris Beijerinck on Eritrhocyte and Thrombocyte Profile of
Hyperglycemia Wistar Rats (Rattus norvegicus Berkenhout, 1769)
217

4a shows that the hyperglycemia group has platelets
that have increased continuously from D0 to D30.
Moreover, it can show that the immune condition of
diabetic-induced rat can still respond well. The
metformin treatment showed that at D0 to D15,
platelets experienced an insignificant increase. In the
treatment control given microalgae, it is known that
the administration of A. maxima and C. vugaris both
increased in D0 to D15. After D15, the platelets both
experienced a decrease, this suggests that A. maxima
and C. vulgaris have the potential to reduce levels of
platelet induced hyperglycemia rats.
Based on Figure 4b this study obtained a baseline
ranging between 5.18-9.17%. PDW values under
normal conditions indicate that platelets contained in
the blood generally have the same size. While the
high PDW value indicates that the platelet has a large
size variation, there are disorders that affect the
platelet. Based on Figure 4b it is shown that in
hypergicemia control on days D0 to D30 have
increased (p>0.05) constantly. This shows that there
are variations in the form of platelets which indicate
interference with the platelet. In the group of mice
that received microalgae treatment and antidiabetic
drugs experienced insignificant differences (p>0.05).
After D55, the normal range between 5.4-6.7 fL
was obtained. In this study, the normal range of MPV
values was obtained between 6.1-7.1 fL. In the DM
group, it was shown that
after D15 the MPV
experienced an increase. This shows that large
platelets are changing. The metformin group showed
a decrease after D15. Likewise in group A. maxima.
The A.maxima group had results at D30 approaching
healthy control values. Group A. maxima is far more
effective at reducing MPV values.
Normal range of P-LCR values was obtained
between 2.9-6.7%. The DM control group shows that
based on the difference in days, the graph shows a
decrease before D15 and an increase after D15
(p>0.05). The metformin group decreased after D15.
This shows that metformin has the ability to restore
the platelet condition of hyperglycemia induced mice.
In group A. maxima tends to have a graphic pattern
that is almost the same as the metformin group. A.
maxima group experienced a decrease from D0 to
D30. An increase in P-LCR can indicate increased
platelet activity due to viral marrow suppression,
platelet destruction that is mediated by antigens,
antibodies consumption of peripheral platelets or
viral replication in platelets which then causes
thrombocytopenia.
At the beginning of this study, after D55 was
obtained the normal range value in the healthy control
group of rat between 0.16-0.68%. In the Figures and
Tables it is shown that in the hyperglycemia group the
rat experienced a non-significant increase from D0 to
D30 and at D30 the PCT value was higher among the
other groups. In the metformin group the mice
experienced an increase before D15 and decreased
toward the healthy control group after D15. In groups
A. maxima and C. vulgaris experienced a slight
increase after D15 approached the results of
metformin at D30.
4 CONCLUSIONS
This research conclude that erythrocyte profiles in
hyperglycemic rats have increased, platelet profile
have decreased, and returned to better conditions after
being given A. maxima and C. vulgaris.
ACKNOWLEDGEMENTS
We would like to say thanks to RTA programe for
facilitating this publication of this research study.
Thanks to who has supported this research.
REFERENCES
Alamri, B. N., Bahabri, A., Aldereihim, A. A.,
Alabduljabbar, M., Alsubaie, M. M., Alnaqeb, D., …
Al-Rubeaan, K. (2019). Hyperglycemia effect on red
blood cells indices. European Review for Medical and
Pharmacological Sciences.
https://doi.org/10.26355/eurrev_201903_17259
Ambrosi, M. A., Reinehr, C. O., Bertolin, T. E., Costa, J. A.
V., & Colla, L. M. (2005). Revista de ciências
farmacêuticas básica e aplicada = Journal of basic and
applied pharmaceutical sciences. In Revista de Ciências
Farmacêuticas Básica e Aplicada (Vol. 29). Retrieved
from http://serv-
bib.fcfar.unesp.br/seer/index.php/Cien_Farm/article/vi
ewArticle/453
Anonim. (2014). Situasi dan Analisis Diabetes. Jakarta.
Belay, A., Ota, Y., Miyakawa, K., & Shimamatsu, H.
(1993). Current knowledge on potential health benefits
of Spirulina. Journal of Applied Phycology.
https://doi.org/10.1007/BF00004024
Bonomini, F., Rodella, L. F., & Rezzani, R. (2015).
Metabolic Syndrome, Aging and Involvement of
Oxidative Stress. Aging and Disease, 6(2), 109.
https://doi.org/10.14336/AD.2014.0305
Cousens, G. (2007). There is a cure for diabetes: the tree of
life 21-day+ program. Retrieved from
https://www.google.com/books?hl=id&lr=&id=Ayg1
YaZ2APAC&oi=fnd&pg=PR11&dq=There+Is+a+Cur
e+for+Diabetes:+The+Tree+of+Life+21-
HSIC 2019 - The Health Science International Conference
218

Day%2B+Program.+North+Atlantic+Books.+Berkele
y&ots=OTRymYvke_&sig=Dwr0FxsDd3Ep7eRXoY
RzOb5i0lo
Emami, S., & Olfati, A. (2017). Effects of Dietary
Supplementing of Spirulina Platensis and Chlorella
Vulgaris Microalgae on Hematologic Parameters in
Streptozotocin-Induced Diabetic Rats. Iranian Journal
of Pediatric Hematology and Oncology.
Farag, M. R., Alagawany, M., El-Hack, M. E. A., & Dhama,
K. (2016). Nutritional and healthical aspects of
Spirulina (Arthrospira) for poultry, animals and human.
International Journal of Pharmacology.
https://doi.org/10.3923/ijp.2016.36.51
Lanywati, E. (2001). Diabetes Mellitus, Penyakit Kencing
Manis. Jakarta: Kanisius.
Mantzoros, C. S. (Ed.). (2006). Obesity and Diabetes.
https://doi.org/10.1007/978-1-59259-985-1
Monteiro, C. A., Cannon, G., Levy, R., Moubarac, J.-C.,
Jaime, P., Martins, A. P., … Parra, D. (2016). NOVA.
The star shines bright. World Nutrition.
Moore, T. (2008). Living Safely with High Blood Sugar.
New York: Lulu Press.
Syariatin, L., & Mulyati. (2017). Erythrocyte Profile in
Wistar Rats (Rattus norvegicus Berkenhout, 1769)
Hyperglicemia in Type 2 DM Induction. Yogyakarta.
Effect of Arthrospira maxima Setchell et Gardner and Chlorella vulgaris Beijerinck on Eritrhocyte and Thrombocyte Profile of
Hyperglycemia Wistar Rats (Rattus norvegicus Berkenhout, 1769)
219
