
The Performance of 3D Multi-slice Branched Surface Reconstruction on
CPU-GPU Platform
Normi Abdul Hadi
1
and Norma Alias
2
1
Faculty of Computer and Mathematical Sciences, Universiti Teknologi MARA, 40450 Shah Alam, Malaysia
2
Ibnu Sina Institute, Universiti Teknologi Malaysia, 81310 Skudai, Johor
Keywords:
Spline, CPU-GPU, Parallel Processing.
Abstract:
In this paper, a CPU-GPU algorithm to generate composite contour for 3D branching surface is presented.
The composite contour is generated based on the data points from based and branched contours and located in
between the two contours. Distance calculation is one of the processes in composite contour generation which
consumes the most CPU time, therefore, this process is chosen to be executed on the GPU. The developed
composite contour generation method on the CPU-GPU platform is then applied on CT images of Stanford
bunny and human pelvic with three different number of curve points per segment. These samples generate 12
composite contours in total. The performance of the developed algorithm is measured based on the processing
time and the speedup. The result shows that the CPU-GPU algorithm has improved the speedup as high as
150 times.
1 INTRODUCTION
In medical imaging, the studied object such as organs
are typically stored as 2D contours with evenly spaced
cross sectional images called slices (Sunderland et al.,
2015). Two commonly used multi-slice images
are Computed Tomography (CT) and Magnetic
Resonance Images (MRI). CT scan plays a significant
role in a wide range of applications such as medical
diagnosis, security, and manufacturing (Ziabari et al.,
2018).
In medical diagnosis, the reconstructed 3D image
from CT scan must be in high resolution to assist
clinical examinations (Kainz et al., 1901) for example
to get the precise location as well as the size of
tumour (Sentana et al., 2018). The 3D visualization
of the image must be easily understood for treatment
planning and further analysis (Ge, 2018; Sunderland
et al., 2015). The challenges in handling CT scan
images are the amount of data to be considered and
the branched contours in some image slices. The
amount of data is in terms of the number of pixels
in each image slice which is usually 256times256
or 512times512, and the number of image slices
which can exceed a hundred slices. Thus, the 3D
image reconstruction process requires a powerful
processor to ensure the process can be run efficiently
with a sufficient amount of data within the optimal
processing time.
CT scan images of real-life objects such as hand,
heart and bone cannot avoid a branching contour
situation where the number of contours in a slice is
not the same as the adjacent slice (Sunderland et al.,
2015). This situation is also known as multi-furcating
surfaces (Joshi and Bhatt, 2019).
Graphical Processing Unit (GPU) was originally
developed to calculate the 3D graphics in Central
Processing Unit (CPU). Presently, the use of GPU
has been expanded to be used in scientific calculation
to save computational time (Hosokawa et al., 2015).
Each GPU consists of hundreds of cores that calculate
the given tasks in parallel. Thus, it is suitable
for a huge number of calculations which cannot be
afforded by CPU to accelerate the calculation process
and increase the accuracy of the result (Kainz et al.,
2015). On the other hand, a small amount of data
should be processed in the CPU only to avoid idle
time in GPU.
Since CPU and GPU have different abilities
to process the data, numerous research have been
carried out to combine these two processors in the
same algorithm, for example in generating 2D font
(Abdul Hadi, 2019) and 3D image (Hadi, 2018;
Hadi and Alias, 019a). This algorithm is named
as CPU-GPU and hybrid computing (Sentana et al.,
2018). The illustration of GPU is given in Figure 1
Hadi, N. and Alias, N.
The Performance of 3D Multi-slice Branched Surface Reconstruction on CPU-GPU Platform.
DOI: 10.5220/0009092700490054
In Proceedings of the Second International Conference on Science, Engineering and Technology (ICoSET 2019), pages 49-54
ISBN: 978-989-758-463-3
Copyright
c
2020 by SCITEPRESS – Science and Technology Publications, Lda. All rights reserved
49
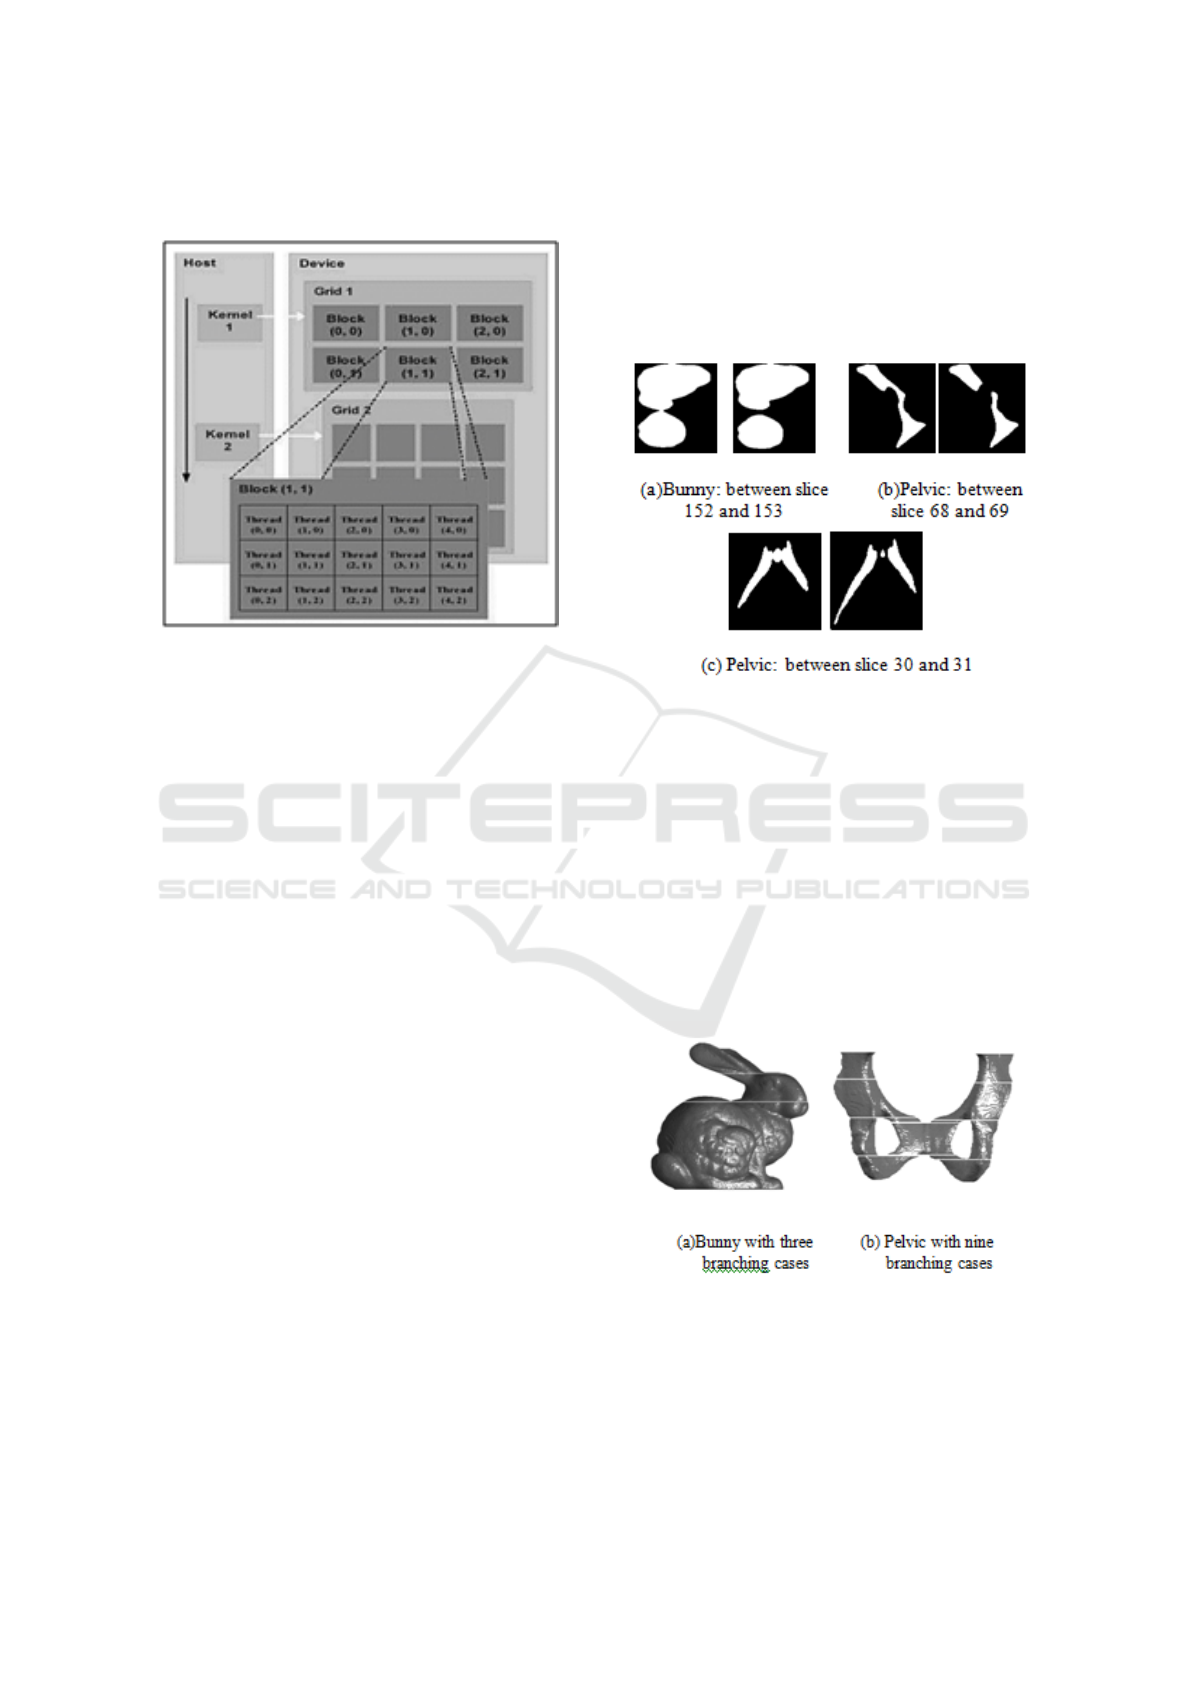
(Alias and Kamal, 2017)
Figure 1: The GPU illustration
The host and device in Figure 1 is the CPU and
GPU, respectively. Each task is assigned to the device
through a kernel from the host. A GPU consists of a
number of grids with each grid containing a certain
number of blocks, and each block having hundreds of
threads. A thread communicates with another thread
in a block by high- speed shared memory, and other
blocks by global memory (Alias et al., 2016; Hadi and
Alias, 019b).
In this paper, the CPU-GPU algorithm is
developed in the branching surface reconstruction
process. Details of the method is will be discussed
in section 2. The performance of the developed
algorithm is then analyzed in section 3. This paper
is concluded in section 4.
2 MATERIALS AND METHOD
2.1 CT Scan Images
This study employs two sets of CT scan images
obtained from (Kels and Dyn, 2011) which are
Stanford bunny and human pelvic. The Stanford
bunny data, consisting of 254 slices, is the most
widely used data in 3D image reconstruction
provided by Stanford Computer Graphics Laboratory,
Stanford University (“Computer Graphics at Stanford
University,” n.d.). Human pelvic data consists of
257 slices but only bottom part of the pelvic, which
consists of 141 slices is considered in this work. All
considered images have undergone the pre-processing
stage to convert the original grayscale images to
binary images.
The number of branching cases in both datasets
are three for bunny and nine for pelvic. An example
of branching case for each dataset are shown in the
following figure.
Figure 2: CT images with branching cases
In Figure 2, there are two types of branching
cases: (a) and (b) one-to-two case, and (c) is
one-to-three case. This makes the 3D surface of
the image discontinuous at the branching slice. The
reconstructed surface with discontinuous surface at
the branching slice is shown in Figure 3.
The branching slices have divided the 3D image
to five parts for bunny, and twelve parts for pelvic.
Therefore, to join these parts, a new contour known
as composite contour is introduced to fit in between
the separated part of the image.
discontinuous parts
Figure 3: 3D surface with discontinuous branching parts
2.2 Composite Contour Generation
Composite contour is a generated contour using
curve points from based and branched contours and
ICoSET 2019 - The Second International Conference on Science, Engineering and Technology
50
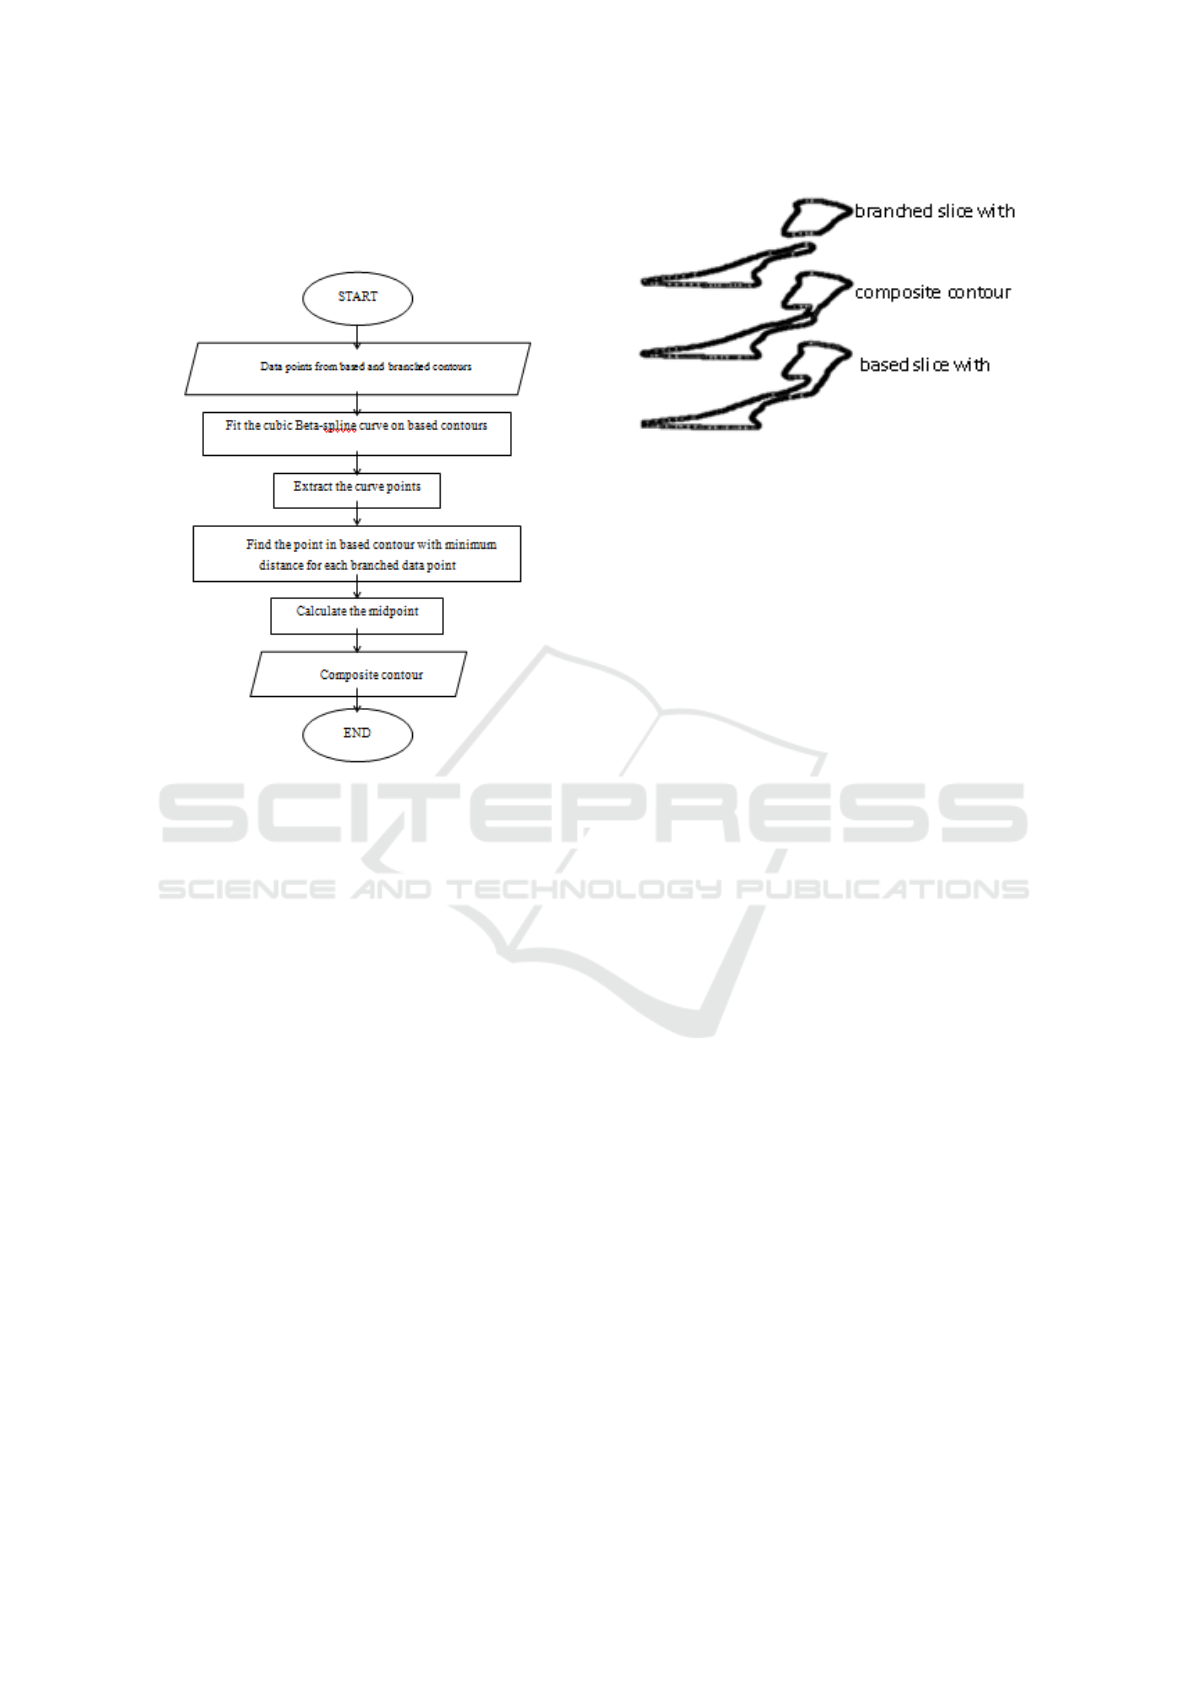
located in between those contours. The flowchart of
composite contour generation is as follows:
Figure 4: The flowchart for composite contour generation
The first step is the cubic beta-spline curve fitting
to all data points in the based contours. Beta-spline is
a reliable curve developed by Brian A. Barsky in 1981
(Barsky, 1981) based on G2 condition. This condition
makes the beta-spline curve always continuous and
smooth, independent of the distribution of the control
points. The equation of cubic beta-spline curve (Hadi,
2018) is as follows:
F(t) = [T ][M][V ] (1)
[T ] is the matrix of parameter t with 0<t<1, [V ] is the
set of 4×4 control points, and [M] is the beta-spline
basis function (refer (Halim et al., 2018)). Then,
the required ith curve points for each curve can be
extracted by F(t
i
). After that, distances between
each data points in the branched contours to the curve
points in the based contours are calculated. The
pair of points (based-branched) with the minimum
distance is selected as the potential composite contour
data points. Finally, the midpoint between each
pair of points is appointed as the data point for the
composite contour.
Figure 5 shows the datapoints of based and
branched contours, and the generated composite
contour.
The number of extracted curve points in the
branched contour must be sufficient to ensure the
Figure 5: Based, branched and composite data points
accuracy of the generated composite contour. Fewer
curve points produces a smaller number of data
points in the composite contour and less accurate
reconstructed image. However, the processing time
to calculate the distance between each branched data
point to each based curve points is also increased.
Therefore, this study has employed the GPU to handle
the process.
2.3 Composite Contour Generation on
GPU
Basically, the GPU is employed at the chosen step
in the CPU process. From the flowchart in Figure 3,
only one process is executed on the GPU, which is the
distance calculation process. The earlier processes are
executed on the CPU, and the extracted curve points
are transferred to the GPU to calculate the required
distance. Finally, the calculated distance is gathered
in the CPU to calculate the midpoint. The generated
composite contour is treated as other contours to
fit beta-spline surface. The equation of beta-spline
surface is extended from the cubic beta-spline curve
equation in (1) with parameters u and v as follows:
S(u, v) = [T ][M][V ][M]
T
[U] (2)
where [V ] is the 16×4 control points. The
performance of the developed algorithm is discussed
in the following section.
3 RESULT
The employed CPU is Intel (R) XEON (R) (2.10GHz)
with 2 processors, and the GPU is NVIDIA
Tesla K20c running on Windows 10 64-bit. The
performance is measured in terms of the processing
time for the whole composite contour generation
process and speedup. The data for bunny and pelvic
is combined in the same analysis
The Performance of 3D Multi-slice Branched Surface Reconstruction on CPU-GPU Platform
51
3.1 Processing Time
Processing time is the time taken for a process to
be completed. This paper compares processing time
between CPU-alone and the developed CPU-GPU
algorithm for different number of curve points per
curve segment. There are twelve branching cases
for bunny and pelvic, and the processing time is
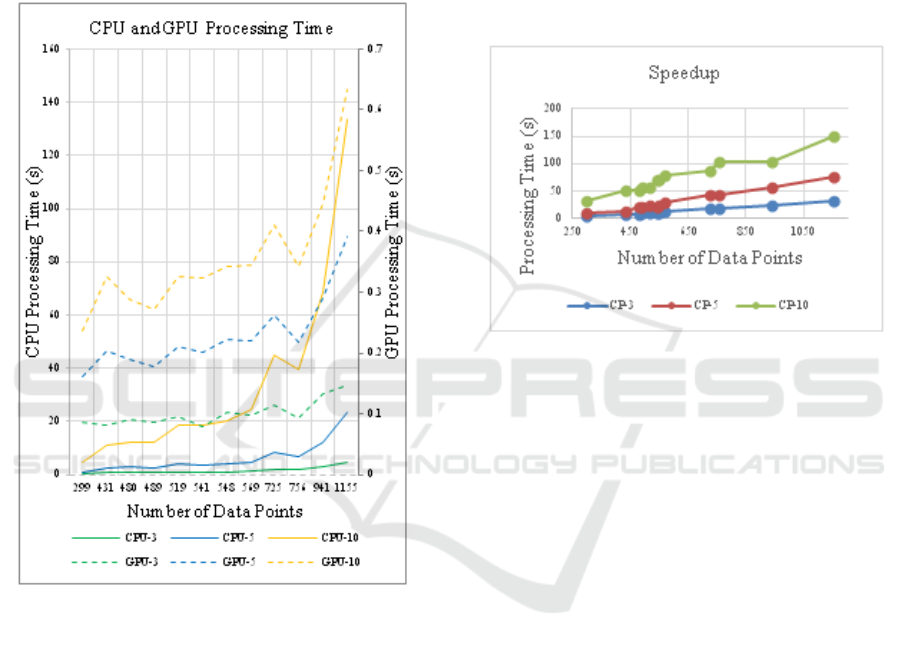
combined and compared in Figure 6.
Figure 6: CPU and GPU processing time for different
number of curve points
CPU-3, CPU-5 and CPU-10 (represented by solid
lines) are the CPU-alone execution time for 3, 5
and 10 curve points per curve segment, respectively.
GPU-3, GPU-5 and GPU-10 (represented by dashed
lines) are the time consumed by the CPU-GPU
algorithm. The number of curve segments for each
branching case is presented at the x-axis. Processing
time for GPU is the total execution time including the
communication between CPU and GPU.
Based on Figure 6, both CPU and GPU processing
time are increased with the increment of the number
of curve points. For 1155 data points for example,
the increment of curve points from 3 to 10 points per
segment has increased the CPU processing time 24×
from 4.59s to 110.41s. Although the GPU processing
time has also increased, which is only 4.97× which is
still low. This shows that the GPU can still afford
more data compared to the CPU. Furthermore, the
sudden increment in CPU time suggests that the CPU
has reached its limit.
3.2 Speedup
The speedup is calculated as time for CPU per time
for GPU to show how fast the GPU is as compared to
the CPU. The speedup for the developed CPU-GPU
algorithm is shown in Figure 7.
Figure 7: Speedup for three different number of curve
points per segment
From Figure 7, all three curves have almost linear
shape curves. This shows that the speedup of the
developed algorithm is getting better when larger
number of data points is considered. The position of
CP-10 curve is also higher than CP-5 and CP-3 which
shows that the speedup is better when the number of
curve points per segment is increased. This is because
the GPU has hundreds of threads to do the task. The
best speedup from the figure is 150 for CP-10 which
shows that the GPU has accelerated the processing
time 150×.
3.3 Reconstructed 3D Images
The developed algorithm is applied on two datasets of
CT scan images: bunny and pelvic. The reconstructed
surface with branching slice has been shown in Figure
3.
Figure 8 shows the same reconstructed 3D images
as in Figure 3 but with composite contour. Based
on the figure, separated parts for both figures have
been joined smoothly using cubic beta-spline surface.
Stanford bunny is a widely used data for 3D
image reconstruction. Thus, the comparison of the
reconstructed bunny in this paper is compared to a
previous similar work by (Abdul Hadi et al., 2013),
as shown in Figure 9.
ICoSET 2019 - The Second International Conference on Science, Engineering and Technology
52
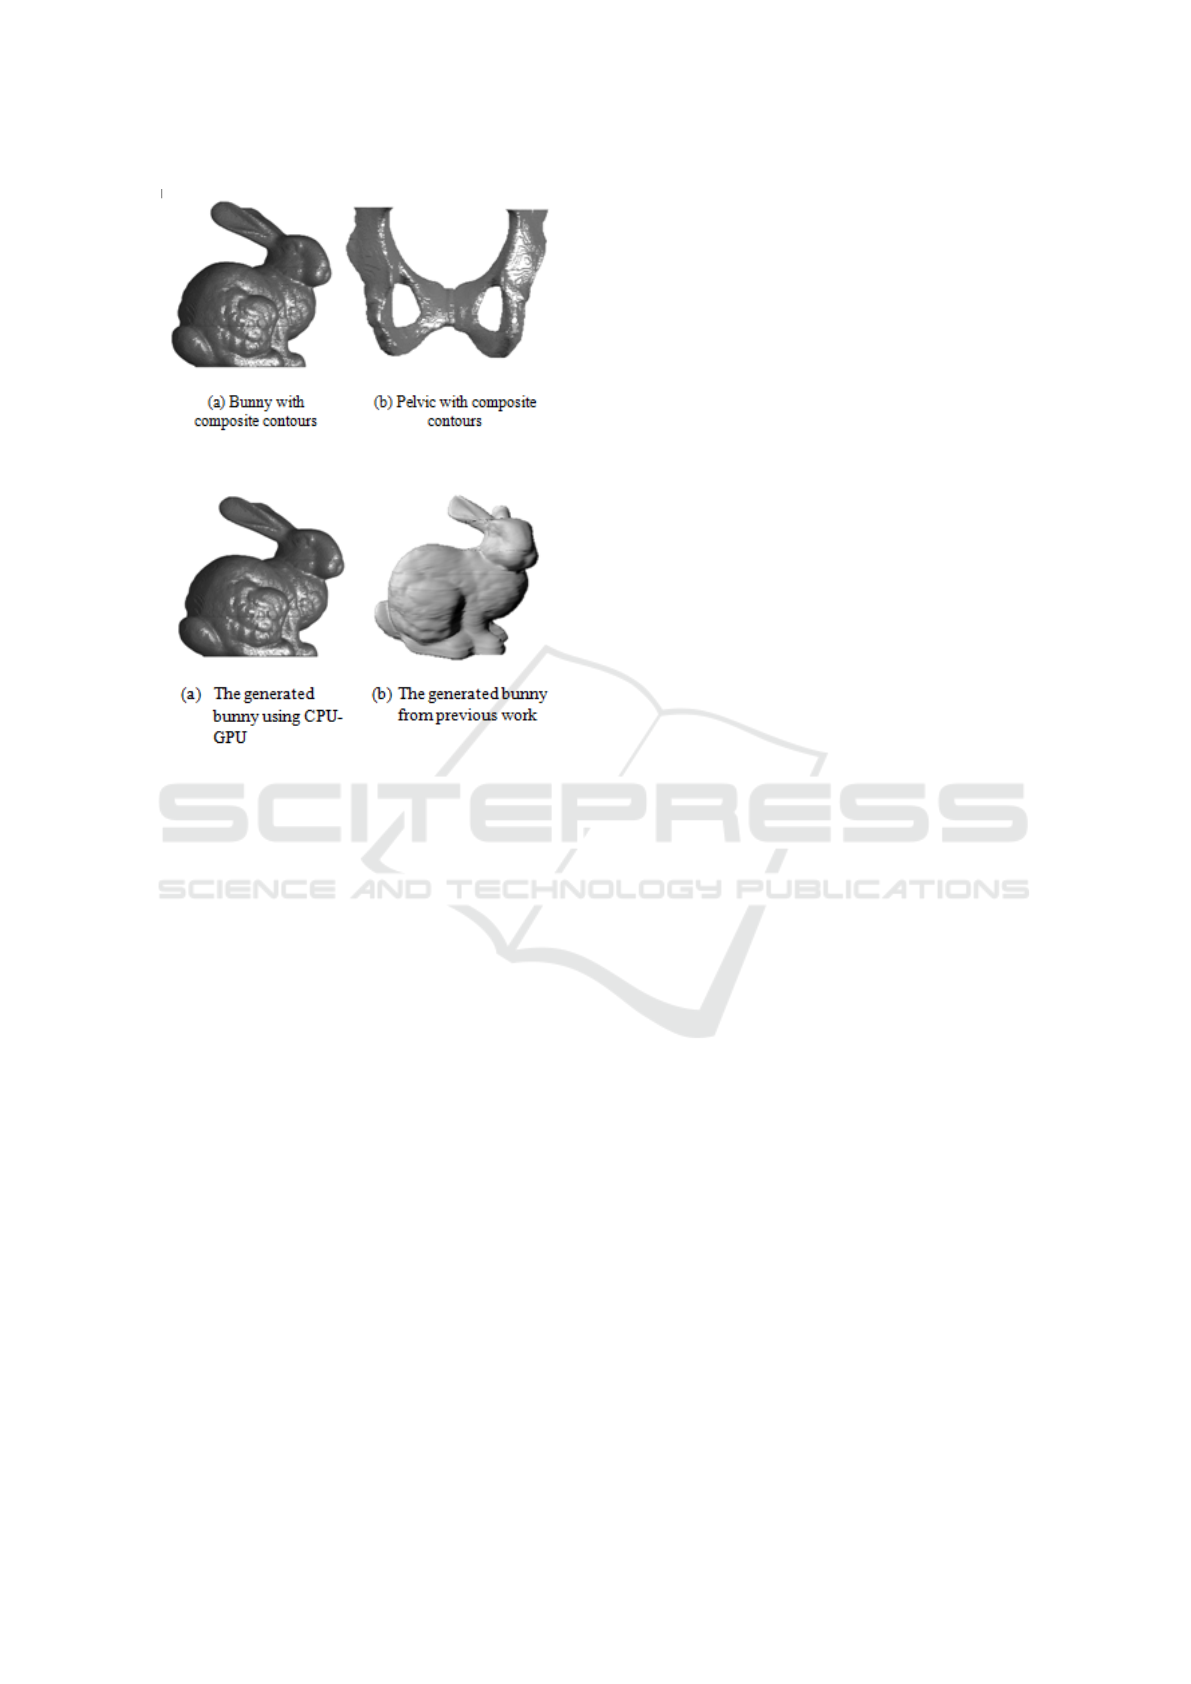
Figure 8: reconstructed surface with composite contours
Figure 9: The reconstructed surface with composite
contours
Figure 9(a) shows the generated bunny using the
method developed in this paper, and Figure 9(b) is the
generated bunny using CPU-alone by (Abdul Hadi,
Ibrahim, Yahya, & Md Ali, 2013). In Figure 9(a), the
texture on the bunny body and paws are clearer. This
is because Figure 9(a) consists of 500 surface points
per slice, while Figure 9(b) has only 75 surface points
per slice due to the memory limitation of the CPU.
The CPU limitation also has disadvantage in
generating composite contour. Thus, some branching
part for example ear in Figure 9(b) is not smoothly
joined and can be obviously seen.
4 CONCLUSION
In this paper, an algorithm for generating composite
contour on the CPU-GPU platform has been
developed. The composite contour occurs when
the adjacent image slices have different number of
contours. The decrement of the processing time and
the improvement of the speedup of the developed
algorithm suggest that the CPU-GPU platform is
suitable to be employed in the composite contour
generation since the process involves huge number of
data points.
The capability of GPU also allows the number
of surface points to be high enough to produce the
smoothed and accurate surface. Furthermore, the
fitted cubic beta-spline surface has high continuity
(G2) to confirm the continuity of the surface.
For future research, more process will be
considered to be executed on the GPU. Further
analysis of the performance will also be studied to
ensure the quality of the developed method.
ACKNOWLEDGMENTS
This study is supported by Ministry of Education,
Malaysia, Universiti Teknologi MARA and Universiti
Teknologi Malaysia. Normi Abdul Hadi is a
researcher of Universiti Teknologi Malaysia under the
Postdoctoral Fellowship Scheme.
REFERENCES
Abdul Hadi, N. (2019). Digital khat calligraphy using
beta-spline curve on cpu- gpu platform.
Abdul Hadi, N., Ibrahim, A., Yahya, F., and Ali, J.
(2013). Composite contour generation for beta-spline
surface reconstruction. AIP Conference Proceedings,
1522:435–440.
Alias, N. and Kamal, M. H. A. (2017). Integration
of a big data emerging on large sparse simulation
and its application on green computing platform.
ARPN Journal of Engineering and Applied Sciences,
12(12):3817–3826.
Alias, N., Mohsin, H. M., Nadirah, M., Mustaffa, S.,
and Reyaz, R. (2016). Parallel artificial neural
network approaches for detecting the behaviour of
eye movement using cuda software on heterogeneous
cpu-gpu systems. Jurnal Teknologi, 78(12-2).
Barsky, B. A. (1981). The beta-spline: A local
representation based on shape parameters and
fundamental geometric measures.
Computer Graphics at Stanford University. (n.d.), .
Ge, T. (2018). Optimization of gpu-accelerated iterative ct
reconstruction algorithm for clinical use.
Hadi, N. (2018). Big data simulation for surface
reconstruction on cpu-gpu platform. In Journal
of Physics: Conference Series, volume 1192, page
012006. IOP Publishing.
Hadi, N. A. and Alias, N. (2019a). 3-Dimensional Human
Head Reconstruction using Cubic spline surface
on CPU-GPU Platform. International Conference
Proceedings Series by ACM.
Hadi, N. A. and Alias, N. (2019b). 3-Dimensional Human
Head Reconstruction Using Cubic Spline Surface on
CPU-GPU Platform. Proceedings of the 2019 4th
International Conference on Intelligent Information
Technology, 16–20. ACM.
The Performance of 3D Multi-slice Branched Surface Reconstruction on CPU-GPU Platform
53

Halim, S. A., Halim, M. S. A., and Hadi, N. A. (2018).
Surface reconstruction from computed tomography
(CT) image of human head with the effect of noise.
AIP Conference Proceedings, 2013.
Hosokawa, F., Shinkawa, T., Arai, Y., and Sannomiya, T.
(2015). Benchmark test of accelerated multi-slice
simulation by GPGPU. Ultramicroscopy, 158:56–64.
Joshi, K. and Bhatt, A. (2019). Experiments with t-mesh
for constructing bifurcation and multi-furcation using
periodic knot vectors. Computer-Aided Design and
Applications, 16:382–395.
Kainz, B., Steinberger, M., Wein, W.,
Kuklisova-murgasova, M., Malamateniou, C.,
Keraudren, K., and . . . Rueckert, D. (1901).
Corrupted Stacks of 2D Slices. 34(9).
Kels, S. and Dyn, N. (2011). Reconstruction of 3D objects
from 2D cross-sections with the 4-point subdivision
scheme adapted to sets.
Sentana, I. W. B., Jawas, N., and Wardani, A. E. (2018).
Hybrid cpu and gpu computation to detect lung
nodule in computed tomography images. In 2018
Third International Conference on Informatics and
Computing (ICIC), pages 1–6. IEEE.
Sunderland, K., Woo, B., Pinter, C., and Fichtinger, G.
(2015). Reconstruction of surfaces from planar
contours through contour interpolation. Medical
Imaging, (9415.).
Ziabari, A., Ye, D. H., Srivastava, S., Sauer, K. D.,
Thibault, J.-B., and Bouman, C. A. (2018). 2.5d deep
learning for ct image reconstruction using a multi-gpu
implementation. 2018 52nd Asilomar Conference on
Signals, Systems, and Computers, pages 2044–2049.
ICoSET 2019 - The Second International Conference on Science, Engineering and Technology
54
