
Gait Analysis and Falls between Persons with Knee Osteoarthritis
and Non-Knee Osteoarthritis
Laras Hapsari, Widjajalaksmi Kusumaningsih, Tirza Z. Tamin
Department of Physical Medicine and Rehabilitation, Dr. Cipto Mangunkusumo General Hospital, Faculty of Medicine,
University of Indonesia, Jakarta, Indonesia
Keywords: Gait Analysis, Falls, Non-Obesity, Knee Osteoarthritis.
Abstract: Persons with knee osteoarthritis have a twenty-five percent higher risk of falling. It is important to evaluate
the change of the walking pattern that leads to inadequate balance. This is a preliminary study with a cross-
sectional design in 20 subjects men and women aged 50-70 years old. By consecutive sampling, the subjects
were divided into 2 groups, non-obesity knee osteoarthritis (NOKO) group, and non obesity non
osteoarthritis (NONO) group. TUG test and temporospatial gait analysis without EMG reading were done
on each subject. An independent T-test is used to determine the difference of the two groups. NOKO group
has differences in temporospatial gait parameters and TUG time, than NONO group. NOKO group have
prolonged TUG, smaller step length, smaller stride length and more steps per minute than NONO group, but
not statistically significant (p > 0.05). There were differences in Gait Patterns and Fall Risk between Non
Obesity Knee OA and Non Obesity Non Knee OA patients.
1 INTRODUCTION
Falls can lead to major health problems. Around 30-
40% of people have a history of falling. One of the
many factors for falling risk is Osteoarthritis (OA).
In Indonesia, the prevalence of OA reached 74,48%
from all rheumatic cases in 2004, where 69% is a
woman and 87% are knee OA cases (IRA, 2014).
Osteoarthritis (OA), known as joint degenerative
disease, is typical of biochemical and morphological
changes in synovial membranes, joint cartilages, and
bones. The knee is a weight-bearing joint, that is
why the knee is the most commonly affected by OA.
The etiology of OA is multifactorial and a
combination of local and systemic factors. Old age,
overweight to obesity, knee injury, overuse of joints,
bone density, muscle weakness, and joint laxity
plays an important role in knee OA
(Losina, 201).
Around 50% of 65 years of people and over give
radiological features according to osteoarthritis,
where 10% of men and 18% of women show clinical
symptoms of OA, and about 10% experience
disabilities because of their OA, and older the
possibility to get OA is higher. (Losina et al.,
2011).
The knee OA population has a 25% higher risk
of falling. Several factors such as balance deficit and
weakness of the lower limb muscles which
ultimately cause changes in walking patterns can
contribute to the risk of falling in knee OA (Pater
ML et al., 2019). That is why the purpose of this
study is to observe changes in walking patterns and
see if there is a balance disturbance that can be seen
through step length, stride length, step width,
number of steps in certain time and track, and
walking speed. So that medical staff can determine
the abnormalities of the walking pattern and help
them to correct it to reduce the risk of falling on
knee OA patients.
2 METHODS
2.1 Ethical statement
This study was approved by the Medical Ethics
Committee of the faculty of medicine, University of
Indonesia (19-08-0953/Aug 2019). All participants
read and signed a written consent form.
248
Hapsari, L., Kusumaningsih, W. and Tamin, T.
Gait Analysis and Falls between Persons with Knee Osteoarthritis and Non-Knee Osteoarthritis.
DOI: 10.5220/0009088902480251
In Proceedings of the 11th National Congress and the 18th Annual Scientific Meeting of Indonesian Physical Medicine and Rehabilitation Association (KONAS XI and PIT XVIII PERDOSRI
2019), pages 248-251
ISBN: 978-989-758-409-1
Copyright
c
2020 by SCITEPRESS – Science and Technology Publications, Lda. All rights reserved
2.2 Participants
This study uses a cross-sectional design approach.
Around 20 patients (male and female) were
participated and evaluated. Selected patients were
those who meet the following criteria; age between
50 to 70, Normoweight BMI
(< 23 kg/m2, WHO for Asia Pacific BMI
Classification), knee OA (grade 1-3) and non-knee
OA without other lower limb abnormality or
problem, able to walk as far as 10 m.
2.3 Measurements
Balance and risk of falls were assessed with Time
Up and Go (TUG) and gait analysis through the
walking test. The first test requires the patients to sit
on a chair and when instructed start to stand, walk
forward along the 3 m track, turn at the end of the
track, walk back to the chair, and finally sit on the
chair again, while the examiner measures the time
needed to complete the task using a stopwatch
(Barry E et al., 2014).
The second test consisted of patients walking
along a 10-meter long pathway of cloth on a flat
floor. Patients were asked to sit in a chair, immerse
their feet in blue ink, and were instructed to stand up
and start walking along the pathway at their normal
speed while the examiner calculated their walking
time using a stopwatch. Meanwhile step width, step
length, and stride length can be obtained by
measuring the distance on the footprints using a
ruler and number of steps by counting the number of
steps in the first minute (Xiangping Li et al., 2012).
2.4 Statistical Analysis
All the data that have been obtained are processed,
presented, and then analyzed using the SPSS
program and performed using the independent t-test.
The SPSS Statistics version 21 was used for all
statistical analyses. A P-value ≤0.05 was considered
significant. Besides, descriptive analysis was used to
assess the mean and standard deviation (SD) of all
variables.
3 RESULTS
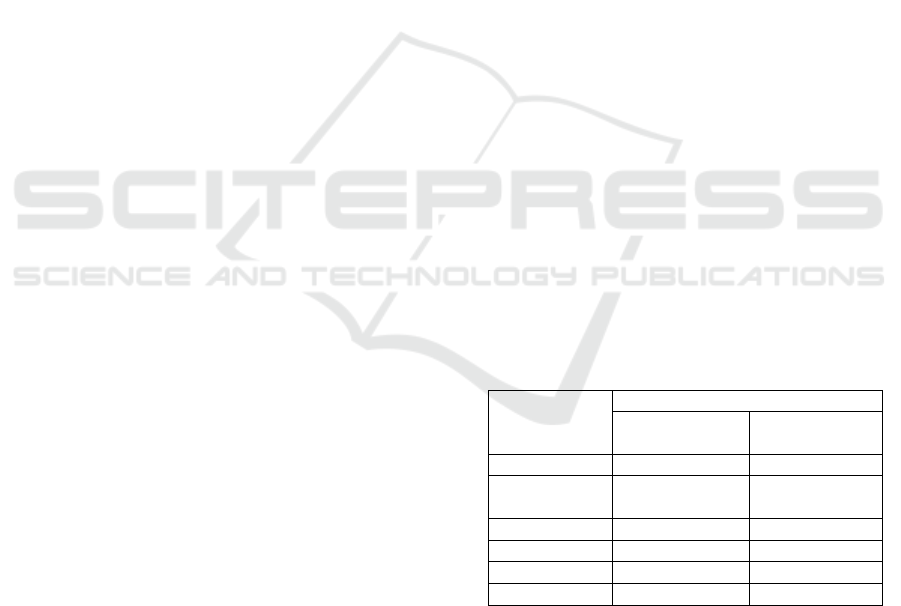
Table 1 illustrates the means of characteristics of
subjects used in this study. Among 20 people who
have participated in this study, there were 3 (30%)
men and 7 (70%) woman from non obesity non
osteoarthritis (NONO) group, and 2 (20%) men and
8 (80%) woman from non obesity knee osteoarthritis
(NOKO) group. The mean age from all the
participants in both groups was 58 and 64 years old.
The mean score for BMI was 20.71kg/m2 and
21.87kg/m2. From table 1, it can be concluded that
the subject dominantly female, with non obesity
knee osteoarthritis (NOKO) group, KL mostly
grades 2 and 3.
Meanwhile, Table 2 illustrates the mean values
of the Gait features on non obesity non osteoarthritis
(NONO) group and non obesity knee osteoarthritis
(NOKO) group subjects and the result of
Independent t-test. The TUG test results of non-
obesity non osteoarthritis (NONO) group mean
scores were 10.026 seconds and now obesity knee
osteoarthritis (NOKO) group were longer 11.98
seconds.
There were some differences in the mean score
between the two groups. For step width in non
obesity non osteoarthritis (NONO) group was
16.1cm and non obesity knee osteoarthritis (NOKO)
group was 14.7cm. Step length in non obesity non
osteoarthritis (NONO) group was 49.9cm and non
obesity knee osteoarthritis (NOKO) group was
45cm, stride length in non obesity non osteoarthritis
(NONO) was group 104.5cm and non obesity knee
osteoarthritis (NOKO) group was 93.95cm, cadence
73x/min in non obesity non osteoarthritis (NONO)
group and 77.7x/min for non obesity knee
osteoarthritis (NOKO) group , and walking speed for
non obesity non osteoarthritis (NONO) group was
0.63m/s and 0.61m/s for non obesity knee
osteoarthritis (NOKO) group.
Table 1: Characteristics of subjects.
Variable
Groups
Non-knee OA
N=10
Knee-OA
N=10
Gender Man 30% 20%
Gender
Woman
70% 80%
Age (years) 58.30 ± (7.33) 64.30 ± (5.25)
Weight (kg) 50.15 ± (6.37) 53.80 ± (4.04)
Height (m) 1.55 ± (0.07) 1.56 ± (0.05)
BMI (kg/m
2
) 20.71 ± (2.36) 21.87 ± (1.06)
Based on the data shown in table 2, there were
differences between non obesity knee osteoarthritis
(NOKO) group and non obesity non osteoarthritis
(NONO) group. It can be seen that non obesity knee
osteoarthritis (NOKO) group have prolonged TUG,
smaller step length, smaller stride length, and more
steps per minute (cadence) than non obesity non
Gait Analysis and Falls between Persons with Knee Osteoarthritis and Non-Knee Osteoarthritis
249
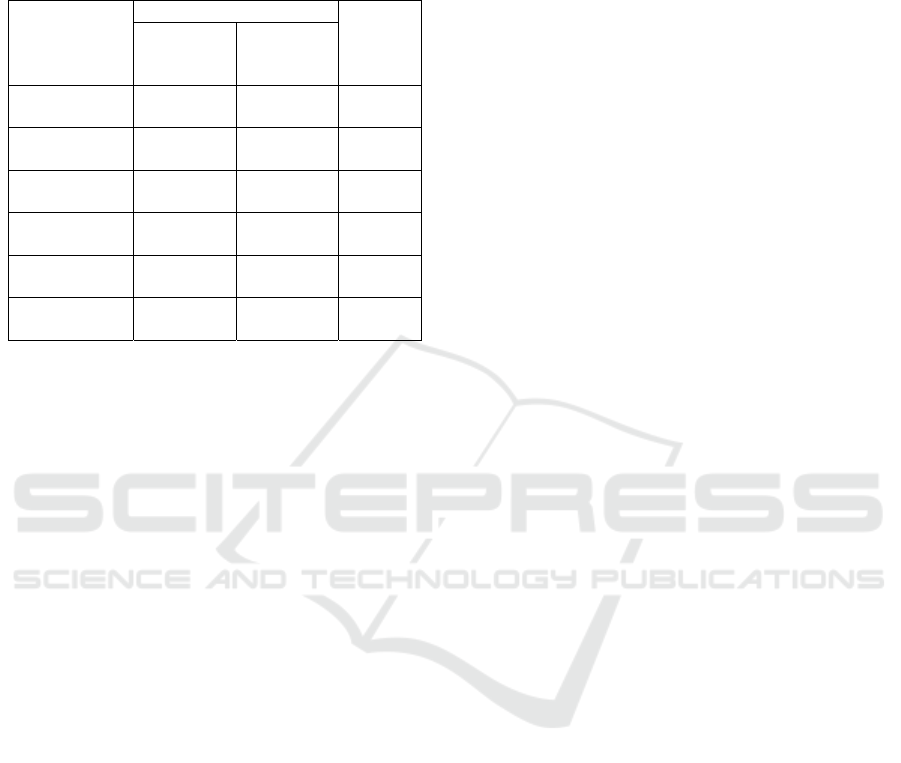
osteoarthritis (NONO) group, although not
statistically significant (p > 0.05).
Table 2: Gait features and Independent t-test result in
Non-knee OA and knee OA patients.
Variable
Gait features
Groups
p-value
Non-knee
OA
N=10
Knee-OA
N=10
TUG (second)
10.026 ±
2.12
11.98 ±
2.23
0.545
Width (cm)
16.1 ±
3.85
14.7 ±
3.32
0.396
Step Length
(cm)
49.9 ±
8.97
45 ±
11.74
0.308
Stride Length
(cm)
104.5 ±
12.03
93.95 ±
19.85
0.168
Cadence
(x/minutes)
73 ±
19.22
77.7 ±
13.66
0.536
Walking
Speed (m/s)
0.636 ±
0.19
0.613 ±
0.15
0.773
4 DISCUSSIONS
This study is preliminary. And according to our
knowledge, there are still very few studies discuss
this topic. The results in this study show that there
was a difference in Gait Patterns and Fall Risk in
Non-Obese Knee OA and Non-obese non Knee OA
patients, althoughnotstatisticallysignificant. This is
not in line with Khalaj N et al. (2014) study, where
total of 60 subjects participated in the study (20
male, 40 female) with the age of participants ranged
from 50 to 69 years showed that there is a significant
difference between three groups (healthy, mild knee
OA, and moderate knee OA) in all the test. In
general, the findings of Khalaj study supported that
individuals with bilateral knee OA had impaired
balanced compared to healthy controls, and this
impairment was more pronounced in moderate knee
OA patients (Khalaj N et al. 2014).
One of the explanatory factors for the variation
of gait patterns in individuals with knee OA is the
severity of knee pain. Pain associated with
osteoarthritis of the knees increased the propensity
to trip on an obstacle, and the greater the pain is
associated with greater risk of falls. However, one
study illustrated that knee pain is associated with
poor balance in individuals with muscle weakness
(Khalaj N et al. 2014). This can be measured
through TUG test, where the subjects on the knee-
OA group will take a longer time to complete the
task compared to the non-OA group.
The differences in the result are because the
subjects in this study were non-obese, which means
there was no burden on the knees which plays the
role of weight-bearing joints. So it will not be that
hard to support the weight of the body and results.
There is a weakness or limitation on this study, it
is the lack of subjects, when all the subject needed
were 20 in each group subject which is 40 subjects
in total, however, this study can only collect 20
subjects in total (10 each), so that the results are not
as expected. The low participation in this study is
influenced by many things including the difficulty of
finding participants who met all inclusion criteria.
Another disadvantage of this study is the use of
calico cloth in the 10 m pathway test which is less
sensitive in assessing walking parameters when
compared to the gait analyzer.
5 CONCLUSIONS
The purpose of this study is to see gait patterns in
patients to reduce the high risk of falling. Improving
the postural stability of older adults with knee OA
has become an important challenge for the medical
practitioner. Establishing these data have
implications in planning rehabilitation programs and
will enable the practitioner to customize their
rehabilitation strategies.
The results in this study show that there was a
difference in Gait Patterns and Fall Risk between
two groups with every 10 subjects, although not
statistically significant. Therefore further study with
more subjects needed to determine the difference in
gait patterns and the risk of falling in the subjects.
REFERENCES
Indonesian Rheumatology Association, 2014. Diagnosis
dan Penatalaksanaan Osteoartritis. Rekomendasi IRA
untuk Diagnosis dan Penatalaksanaan Osteoartritis.
Losina E, Walensky RP, Reichmann WM, Holt HL,
Gerlovin H, Solomon DH, et al, 2011. Original
Research Impact of Obesity and Knee Osteoarthritis
on Morbidity and Mortality in Older Americans. Ann
Intern Med. 26(154):217–26.
Khalaj N., et al, 2014. Balance, and Risk of Fall in
Individuals with Bilateral Mild and Moderate Knee
Osteoarthritis. Plos One. vol 9.
Pater ML, Rosenblatt NJ, Grabiner MD, 2019. Knee
osteoarthritis negatively affects the recovery step
following large forward-directed postural
perturbations. J Biomech [Internet]. 49(7):1128–33.
KONAS XI and PIT XVIII PERDOSRI 2019 - The 11th National Congress and The 18th Annual Scientific Meeting of Indonesian Physical
Medicine and Rehabilitation Association
250

Available
from:http://dx.doi.org/10.1016/j.jbiomech.2016.02.048
Barry E, Galvin R, Keogh C, Horgan F FT, 2014. Is the
Timed Up and Go test a useful predictor of the risk of
falls in community-dwelling older adults: A
systematic review and meta-analysis. BMC Geriatr.
14(1):1–14.
Xiangping Li, Bin Shu, Dingguo Miu, Wangling Jiang
DT, 2012. Review on the Clinical Application of Gait
Analysis. Forensic Sci. 2(1):36–9.
Gait Analysis and Falls between Persons with Knee Osteoarthritis and Non-Knee Osteoarthritis
251
