
A Simulation Study of Downhole Water Sink Guidelines Plot Application
using Real Field Data
Praditya Nugraha
Universitas Papua, Sorong, West Papua
Keywords:
Downhole Water Sink, Simulation Study, Guidelines Plot, Water Coning.
Abstract:
One solution for water coning problem is Downhole Water Sink (DWS) system. A dual completion system
is used to produce the oil perforated zone and the water separated zone separately. Pressure drawdown in the
water zone is used to oppose pressure drawdown in the oil zone so the water-oil contact is remained stable
and prevents the water coning. A DWS guideline plot proposed by Marhaendrajana and Alliyah is used as a
basis in application of DWS by using real field data. This research aimed to apply the DWS guideline plot
to get the benefit of DWS which is controlling the water coning problem. A geological reservoir model has
been upscaled and history-matched into a representative dynamic reservoir model used in this study. The
simulation is conducted by applying 5 scenarios in DWS application considering the number of active wells
and the variation of flow rate in this reservoir. DWS guideline plot and its application using real field data gave
good results in increasing oil recovery with some concern related with the amount of water produced in water
perforated zone. The best scenario which is using DWS in high and medium rate wells group gave 16.24%
recovery factor.
1 INTRODUCTION
Water almost always co-exist with our desired fluids
in a reservoir, therefore, it is expected to produce
a certain amount of water during production. The
amount of water produced is usually referred to as
the water cut. The highwater cut will lower the oil
production rate and increase the water treatment cost.
This problem arises in a water drive reservoir and
water injection in waterflooding operations. Water
which has higher mobility than oil tends to bypass the
oil flow and cause water coning. A lot of research
has been conducted on studying critical production
rates and water breakthrough time to control water
coning (Chaperon et al., 1986; Abass et al., 1988;
Høyland et al., 1989). On the other hand, economical
production rates also need to be considered when
production rates are limited. Downhole water sink
(DWS) was introduced for controlling water coning
without limiting the oil production rate below its
critical rate (Wojtanowicz et al., 1991).
This paper presents a simulation study of DWS
guideline application using real field data. The basic
concept of DWS and its guideline will be covered
briefly. Then, the field data and some assumptions
used are presented before the result is summarized.
2 DOWNHOLE WATER SINK
TECHNOLOGY
One technology to overcome water coning problem
is Downhole Water Sink technology (DWS). DWS
is a dual completion application technology where
the oil zone and water zone are produced separately.
This concept was proposed by Wojnatowicz in
1991 (Wojtanowicz et al., 1991) and then called
as Downhole Water Sink for the first time in
1997 (Shirman and Wojtanowicz, 1997). An equal
pressure drawdown is created in water perforated
zone to prevent water coning and to create a stable
oil-water contact, so oil can be produced from
the top perforation while water is produced from
the bottom completion. Astutik (2006) has listed
several studies that showed the DWS application
successfully worked to preventwater coning and
increase oil production without water breakthrough.
Those studies included numerical studies and field
application. However, most of those studies were
focused on comparing DWS with conventional
completion technique.
Marhaendrajana and Alliyah proposed a guideline
for DWS design (Marhaendrajana, Sukarno, and
Alliyah, 2008) which incorporates parameter
Nugraha, P.
A Simulation Study of Downhole Water Sink Guidelines Plot Application using Real Field Data.
DOI: 10.5220/0009065500310034
In Proceedings of the Second International Conference on Science, Engineering and Technology (ICoSET 2019), pages 31-34
ISBN: 978-989-758-463-3
Copyright
c
2020 by SCITEPRESS – Science and Technology Publications, Lda. All rights reserved
31
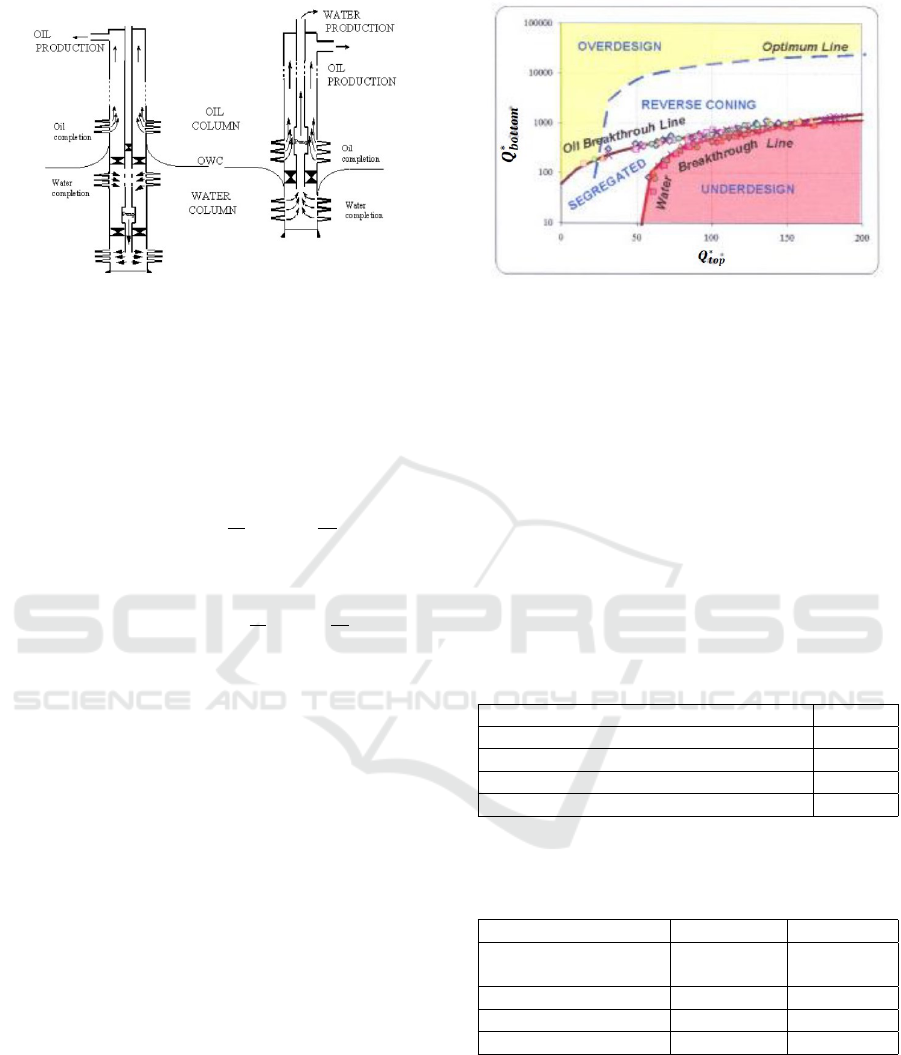
Figure 1: Schematic of Downhole water sink (taken from
(Wojtanowicz, 2006)). A. DWS water drainage-injection.
B. DWS water drainage-production.
affecting water coning such as permeability
anisotrophy (k
v
/k
h
)and perforation interval (h
p
/h
o
).
Where Qtop* and Qbottom* are respectively :
Q
∗
top
= Q
top
+
10
α1
k
v
k
h
α2
h
p
h
o
α3
(1)
Q
∗
bottom
= Q
bottom
+
10
β1
k
v
k
h
β2
h
p
h
o
β3
(2)
Where : α1=2.401433, α2=0.518346, α3=1.283428;
and β1=3.227316, β2=0.842945, β3=1.567493.
The preferable condition is where instead of water
coning, the oil coning happened or called as reverse
coning. The segregated and reverse coning phase
in the DWS guideline plot become the guideline to
determine the production rate in the oil zone (Qtop)
and the water zone (Qbottom).
3 SIMULATION AND FIELD
DATA
The simulation and field data used are from a
Jurassic reservoir in China (Huawei et al., 2013).
A reservoir dynamic model has been upscaled from
geological model and well history-matched with its
production history data. The model was built using
PETREL and run using ECLIPSE. Production history
data showed that water production rose rapidly and
become a major problem. This reservoir has 4 major
layers (Y71, Y81, Y82, and Y91) with an average
permeability of 100 mD and average porosity 14.5%.
Figure 2: DWS Guideline Plot (taken from
(Marhaendrajana et al., 2008).
Table 1 and Table 2 summarized the reservoir and
oil properties.
In this reservoir there are 81 vertical wells and 1
horizontal well. At the end of history matching 12
wells are converted to be water injector wells. 15
years of production years is used as the basis for the
development strategy.
The oil recovery factor at the end of history
matching is 7.26%. From Figure 3, the remaining oil
saturation for each layer is still quite high which is 0.6
inthe green color region.
Table 1: Rock Properties (taken from Huawei et.al., 2013).
Rock Characteristics
Porosity, % 14.5
Horizontal permeability, millidarcy (mD) 100
Kv/Kh 0.1
Compressibility, 1/bar 0.00055
Table 2: Fluid Properties (taken from Huawei et.al., 2013).
Oil Water
Density, kg/m3
14.5
1000
(32.15
◦
API)
Viscosity, cp 8.88 0.5494
FVF 1.13 1.014
Compressibility, 1/bar 4.16 x 10⁻⁵
At first, it was needed to optimize the water
injection scheme to maintain reservoir pressure
above the bubble point pressure while increasing the
recovery factor (RF). The optimization resulted in
recovery factor of 14.94%. The optimized water
injection case will be used as our base case in
implementing DWS.
ICoSET 2019 - The Second International Conference on Science, Engineering and Technology
32
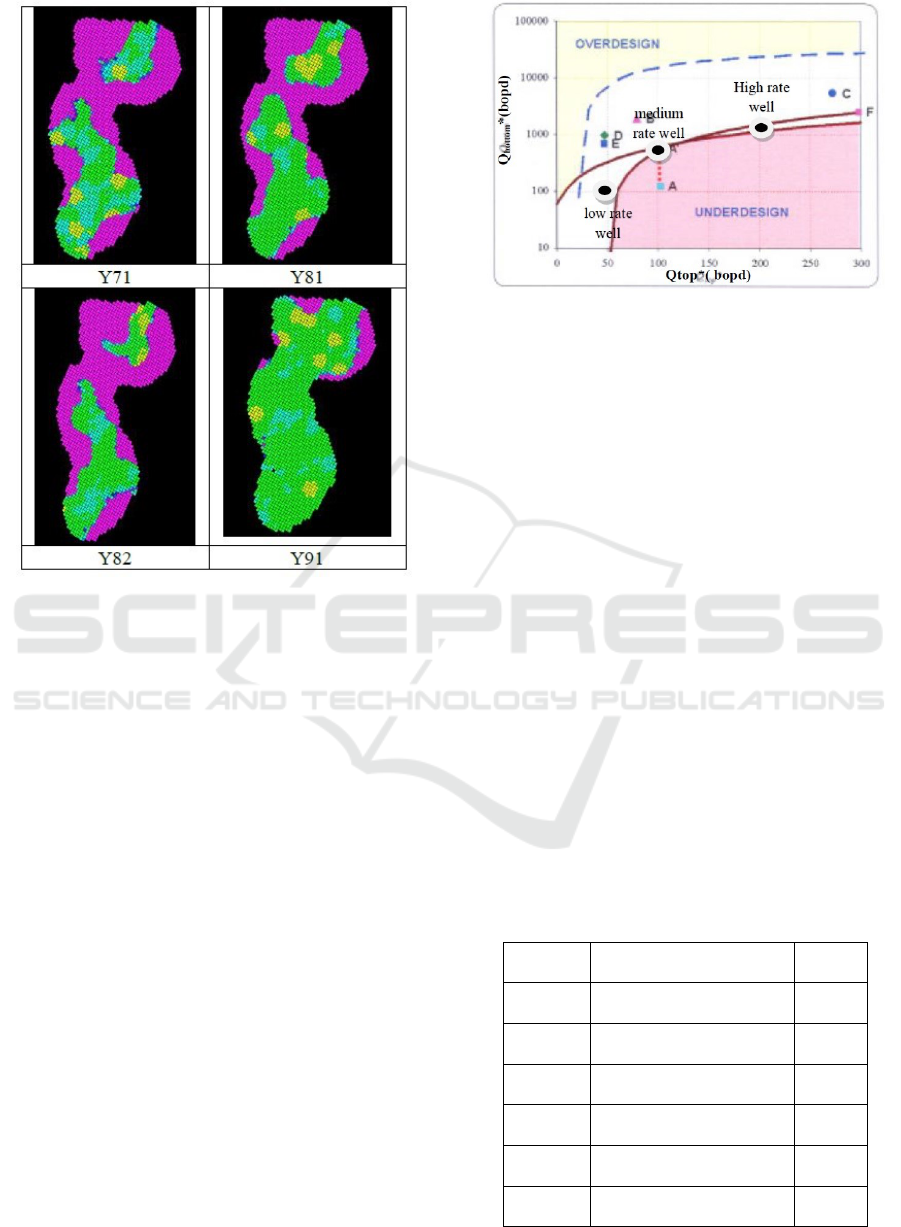
Figure 3: Remaining oil saturation at the end of history
matching (So initial for development).
4 DWS GUIDELINE PLOT
APPLICATION
For employing DWS concept in the reservoir
simulation, a well with DWS is two wells in the same
location with different perforation intervals. One
perforation will perforate the oil zone while the other
one will perforate the water zone in the same well.
The production rate for the water zone is higher than
in the oil zone to keep a good Oil-Water Contact
(OWC) in straight line or to make the oil and water
in segregated phase.
In applying the DWS technology, the wells
are sorted into three groups. High rate wells
(production rate > 15 m
3
/day), medium rate wells
(production rate between 10-15 m
3
/day), low rate
wells (production rate < 10 m
3
/day). There are 5
cases conducted in this simulation study to evaluate
which case gives the highest recovery factor. The
operation condition for DWS (Qtop and Qbottom)
are determined by 3 chosen operation conditions for
each sorted group of different production rate (high,
medium, and low).
High – Qtop* = 200bopd, Qbottom* = 1000bopd
Medium – Qtop* = 100bopd, Qbottom* = 800bopd
Figure 4: DWS Operation condition for each group
well.(modified from Marhaendrajana, Sukarno, and
Alliyah, 2008).
Low – Qtop* = 50bopd, Qbottom* = 100bopd
For Case 1, 8 wells from high rate wells group were
using DWS with Qtop = 30 m3/day and Qbottom =
160 m3/day.
For Case 2, 5 wells from medium rate wells
group were using DWS with Qtop = 15 m3/day and
Qbottom = 80 m3/day.
For Case 3, 10 wells from low rate wells group
were using DWS with Qtop = 8 m3/day and Qbottom
= 30 m3/day.
For Case 4, DWS was implemented in high rate
wells and medium rate wells and did nothing for the
low rate wells.
For Case 5, DWS was implemented in each group
of well, high rate, medium rate and low rate.
Qtop and Qbottom used in each group wells were
calculated from the DWS guideline plot. The values
also have been converted from SIunit (International
System of unit) in reservoir data unit (China using SI
unit) into field unit in DWS guideline plot. After the
simulation, the results are presented in Table 3.
Table 3: Simulation Study Results.
Case Scenario RF
(%)
Base
case
Optimized Water
Injection
14.94
Case 1 Base case + DWS high
rate
15.37
Case 2 Base case + DWS
medium rate
15.23
Case 3 Base case + DWS low
rate
14.66
Case 4 Base case + DWS high
and medium rate
16.24
Case 5 Base case + DWS high,
medium and low rate
16.15
A Simulation Study of Downhole Water Sink Guidelines Plot Application using Real Field Data
33

From the results, case 4 gave the highest recovery
factor with only DWS application in high and medium
rate. This shows that DWS application in low
rate wells did not give significant water drainage
in reducing water coning. These results correlate
with DWS operation condition for the low group
rate which is located at segregated zone (Figure
4). Segregated inflow production can only be
achieved for a relatively low flow rate. In the field
operations, reverse coning has been used mostly
in the reversed coning mode of DWS production
(Shirman and Wojtanowicz, 1997). While on other
hand, the preferred oil coning provides additional
constrain in terms of water treatment capacity
as the more water will produce in conjunction
with higher water production rate in water zone.
DWS water drainage-injection mode can be used to
overcome this excess water problem (Figure 1A.)
The water drainage was pumped into water zone
below the water drainage perforated zone. This
approach has already been applied in real fields such
as Greater Burgan Field (Al-Fadhli et al., 2019)
and North Kuwait (Anthony and Al-Mosaileekh,
2016). But in general, the DWS guideline plot
provide a good approximate operating condition
in DWS application.In its application, the Qtop*
and Qbottom* can be optimizedfor each well with
different production rates. The grouped production
rates are used to simplify the simulation considering
the number of wells in this field. Production rate
should be a screening criterion in DWS application.
An adequate flow rate is needed to operate DWS in
reverse coning region to optimize the benefit of DWS.
5 CONCLUSIONS
From this study, we observe that DWS guideline
plot gave good approximate operation condition in
terms of production rate in oil zone (Qtop) and
water zone (Qbottom). Grouped production rate
wells can be used to simplify the implementation of
DWS application as different production rate need
different DWS operation condition. Reverse coning
region is the preferred operation condition for DWS
application. Screening of production rate is needed
to make sure DWS application in reverse coning
operation region. In DWS application,economic
evaluation is needed to make sure the incremental
oil production can cover the investment of additional
water treatment capacity as more water will be
produced. DWS water drainage-injection mode can
be used as alternative to overcome excessive water
production.
ACKNOWLEDGMENTS
This work is partially from the author’s Master
Thesis at Institut Teknologi Bandung (ITB). The
author also would like to thank Dr.AmegaYasutra
from ITB for his guidance, Prof. Ning Zhengfu
from China University of Petroleum-Beijing (CUPB)
for providingthe data used in this study andhis PhD
students in helping author understanding the data.
REFERENCES
Abass, H., Bass, D., et al. (1988). The critical production
rate in water-coning system. In Permian Basin Oil
and Gas Recovery Conference. Society of Petroleum
Engineers.
Al-Fadhli, W., Kurma, R., Kovyazin, D., and Muhammad,
Y. (2019). Modeling and simulation to produce thin
layers of remaining oil using downhole water sink
technique for improved oil recovery. a case study in
greater burgan field.
Anthony, E. and Al-Mosaileekh, S. (2016). Downhole water
sink technology improves recovery and rates from
strong water drive reservoirs in north kuwait – a pilot
case study.
Astutik, W. (2007). A study of down-hole water sink (dws)
technology - optimum dws design in vertical well
considering reservoir parameters.
Chaperon, I. et al. (1986). Theoretical study of coning
toward horizontal and vertical wells in anisotropic
formations: subcritical and critical rates. In SPE
annual technical conference and exhibition. Society
of Petroleum Engineers.
Høyland, L. A., Papatzacos, P., Skjaeveland, S. M., et al.
(1989). Critical rate for water coning: correlation
and analytical solution. SPE Reservoir engineering,
4(04):495–502.
Huawei, Z. et al. (2013). Pengyang Jurassic Oilfield :
Fine Reservoir Description Reservoir Study. Reseacrh
Report, China University of Petroleum-Beijing.
Marhaendrajana, T., Sukarno, P., Alliyah, I., Geologi,
H., Buniayu, S. B. T. K., Di Daerah, S. P.
S. K., and Cilacap, J. T. (2008). Oil production
enhancement using bottom-hole water sink: A
guideline for optimum design application. Proceeding
for Simposium Nasional & Kongres IX Ikatan Ahli
Teknik Perminyakan Indonesia (IATMI), Jakarta,
pages 15–17.
Shirman, E. and Wojtanowicz, A. (1997). Water
coning reversal using downhole water sink-theory and
experimental study.
Wojtanowicz, A., Xu, H., Bassiouni, Z., et al. (1991).
Oilwell coning control using dual completion with
tailpipe water sink. In SPE Production Operations
Symposium. Society of Petroleum Engineers.
Wojtanowicz, A. K. (2006). Down-hole water sink
technology for water coning control in wells.
Wiertnictwo, Nafta, Gaz, 23(1):575–586.
ICoSET 2019 - The Second International Conference on Science, Engineering and Technology
34
