
Analysis of Porosity and Permeability on Channel Deposit Sandstone
using Pore-gas Injection and Point Counting in Sarilamak Area, West
Sumatra
Bayu Defitra, Tiggi Choanji and Yuniarti Yuskar
Department of Geological Engineering, Universitas Islam Riau, Pekanbaru, Indonesia
Keywords:
Emulsion, Local Demulsifier, Palm Oil, Bottle Test
Abstract:
Porosity and permeability is one of important factor to determine the quality of reservoir. Eight samples of
sandstone channel deposit that made into core had been established to determine the porosity and permeability
for the quality of reservoir using Pore-Gas Injection and Point Counting Method. This study is focusing
on measuring and finding relationship between porosity and permeability, and shows an analog for reservoir
based on surface data. The effective porosity ranged from 0.5% - 24.8% classified into negligible – very
good porosity, the visible porosity ranged from 3.36% - 18.32% classified into poor – good porosity, and the
effective permeability ranged from 1.376 mD – 363 mD classified into tight – very good permeability, there
are differences between porosity and permeability which caused by grain size, sorting, and compaction of
sandstone. The average result of porosity and permeability classified as good reservoir.
1 INTRODUCTION
Porosity and permeability are things that cannot be
separated from rocks, porosity and permeability are
also things that are mutually related to each other
whose discussion will be interconnected. In the
exploration of petroleum or groundwater, porosity
and permeability are important factors in determining
the quality of a rock reservoir, this caused porosity
and permeability can determine the amount of fluid
present in rocks and the ability to drain fluid
(Koesoemadinata, 1980).
Sandstones are the most widely distributed
reservoir rocks on earth, and about 60% of all
reservoir rocks are sandstones (Nichols, 2009).
Based on the appearance and condition on the
field, the study area was included in the distal
fan subfasies of the Brani Formation (Wibowo and
Fardiansyah, 2016)
Sandstone on this area shows a channel deposit
that analog to the fluvial channel on recent conditions
(Choanji et al., 2019; Yuskar and Choanji, 2017) and
which porosity and permeability are usually affected
by local structure (Choanji et al., 2018)
The purpose of this study was to determine
how the conditions of porosity and permeability
in sediment sandstones in sarilamak area, west
sumatraprovince which have same characteristic
or analog to the sand reservoir on Ombilin and
Central Sumatra Basin. This study is focusing on
measuring and finding relationship between porosity
and permeability on channel deposit sandstone at
Brani Formation (Figure 1).
Figure 1: Map of Study Area
26
Defitra, B., Choanji, T. and Yuskar, Y.
Analysis of Porosity and Permeability on Channel Deposit Sandstone using Pore-gas Injection and Point Counting in Sarilamak Area, West Sumatra.
DOI: 10.5220/0009064700260030
In Proceedings of the Second International Conference on Science, Engineering and Technology (ICoSET 2019), pages 26-30
ISBN: 978-989-758-463-3
Copyright
c
2020 by SCITEPRESS – Science and Technology Publications, Lda. All rights reserved

2 METHODOLOGY
There are eight samples of channel deposit of
sandstone which are cored and analysis using porosity
and permeability tools (Figure 2).
2.1 Porosity
This study using Pore-Gas Injection and Point
Counting Method for determination the porosity in
eight channel deposits sandstone on Brani Formation.
2.1.1 Pore Gas-Injection
Pore Gas-Injection was conducted using Helium
Porosimeter had been used to determine the effective
porosity of eight samples. This method is using
helium gas which has become nature of helium gas
that can easily enters the pore cavity and also this
dry gas produce no chemical reactions which will
cause changes in the physical properties of the core so
that the existing porosity will be disrupted (Dandekar,
2006). Eight samples had established to determining
the effective porosity using the following equation:
v
b
=
1
4
πd
2
h (1)
v
sp
=
1
4
πd
2
sp
h
sp
(2)
v
sop
=
1
4
πd
2
sos
h
pop
(3)
DV = (
Pcc
Poc
−1)v
sp
(4)
GR = (
Pcc
Poc
−1)v
b
(5)
v
g
= (v
sop
− GR) +DV (6)
b
p
= v
v
− v
g
(7)
ρ
g
= (8) (8)
Øe f f = 100% (9) (9)
Where, d is core diameter, h is core height, dsp is
steel plug diameter, hsp is steel plug height, dsop is
steel out plug diameter, hsop is steel out plug height,
pcc is close core pressure, poc is open core pressure,
mc is core weight, vb is rock volume, vsp is steel plug
volume, vsop is steel out plug volume, DV is dead
volume, GR is Gauge Reading, vg is grain volume,
vp is pore volume, ρgis groin density, and Ø eff is
effective porosity.
2.1.2 Point Counting
Petrographic method for calculating the percentage
of elements or minerals contained in a rock sample
was formed into a thin section. This method is
explained by Chayes (1968) and Griffiths (1967),
then developed by (Demirmen, 1972) called point
counting cell models. This method was also used
to determine the visible porosity using the following
equation :
Visiblexorosity =
TotalPoreonCell
TotalCell
X100% (10)
The effective porosity and visible porosity
estimated in laboratory classified by classification
of porosity by Koesoemadinata (1980) into
Negligible/Very Poor 0 - 5 % , Poor 5 - 10 %,
Fair 10 - 15 %, Good 15 - 20 %, Very good 20 - 25 %
, and Excellent > 25 %.
2.2 Permeability
2.2.1 Pore Gas-Injection
Method for permeability analysis was conduct using
Gas Permeater which had been used to determine the
effective permeability. This Method using nitrogen
gas which more easily enters the pore cavity and
no chemical reactions that will cause changes in the
physical properties of the core so that the existing
porosity will be disrupted (Handwerger et al., 2011).
Eight samples had established to determining the
effective permeability using the following equation:
Q = (High Flow - Lol Fwow) (11)
∆P = (P
1
− −P
2
) (12)
A = 2πr(r + h) (13)
K =
µQL
A(∆P)
(14)
Where, r is core radius, h is core height, Q is flow
rate, ∆P is Pressure, A is section area, µ is Viscosity,
and K is Permeability.
The effective permearility estimated in labobatiry
classified by classification of permeabiloty by
Koesoemadinata (1980):
• Tight < 5 mD
• Fair 5 - 10 mD
• Good 10 - 100 mD
• Very good 100 - 1000 mD
• Excellent >1000 mD
Analysis of Porosity and Permeability on Channel Deposit Sandstone using Pore-gas Injection and Point Counting in Sarilamak Area, West
Sumatra
27
3 RESULT AND DISCUSSION
Based on laboratory work, the porosity and
permeability of eight channel deposits sandstone
showing difference of value. The following result of
the porosity and permeability:
3.1 Porosity
3.1.1 Pore Gas-Injection
The effective porosity of eight channel deposits
sandstone had been estimated using Helium
Permeameter in range from 0.5% - 24.8%, the
effective porosity belonging to negligible – very
good porosity. Core 2C and core 3A has the
smaller effective porosity because the rock has been
compacted and has poor sorting. The summary of
effective porosity shows in Table 1.
3.1.2 Point Counting
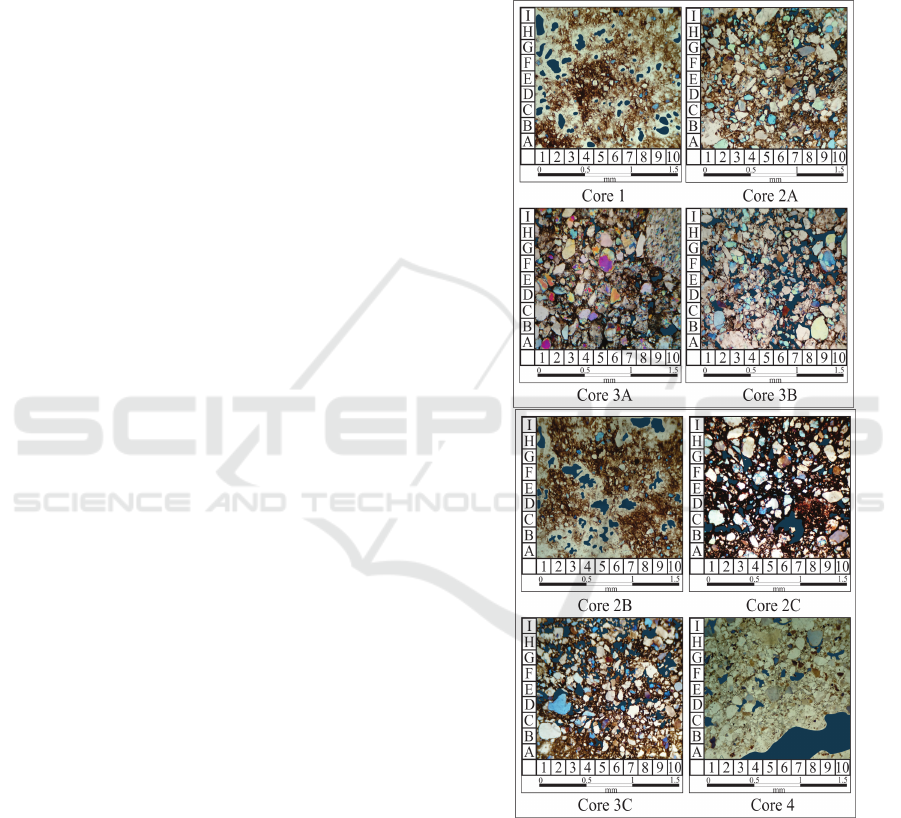
Based on thin section of eight channel deposits
sandstone (Figure 2) the visible porosity had been
estimated using grid cell ranged from 3.36% -
18.32%, the visible porosity belonging to negligible
– good porosity. The summary of visible porosity
shows in Table 2.
3.2 Permeability
3.2.1 Pore Gas-Injection
The effective permeability of eight channel deposits
sandstone had been estimated using Gas Permeameter
in range from 1.376 mD – 363 mD the effective
permeability belonging to tight – very good
permeability. Core 2C and core 3A has the
smaller effective permeability because the rock has
been compacted and has poor sorting. The summary
of effective permeability shows in Table 2.
According the result of laboratory work of
effective porosity, visible porosity, and effective
permeability, it classified for potential reservoir as
shown in Table 4.
Figure 2: Thin Section of Eight Channel deposits Sandstone
(visible porosity marked by dark blue color).
ICoSET 2019 - The Second International Conference on Science, Engineering and Technology
28

Table 1: Summary of Effective Porosity.
CNre
oumber
d
(cm)
h (cm)
mc
(gr)
DV(cm3) GR(cm3)
Vg
(cm3)
Vp(cm3)
ρg(gr/cm3)
Ø
effective
(%)
Visisle
Porobity
(%)
1
3.1
7.9
178.72 0.077 0.32 67.067 7.467 3 12.52 13.28
2A
3.3 3.6 88.37 0.70 0.435
33.915
3.135
2.9
10.18 7.84
2B
3.1
7.9
174.25 0.084 0.33 67.064 7.464
2.92
12.53 11.68
2C 3.3 7.6
198.53
0.118 0.47
66.985
5.868 3.05 3 5.76
3A 3.3 4.6 106.33 1.044
0.95 39.514 0.194
2.7
0.5 3.36
3B
2.9
8.2 124.57 0.78 3.40 67.57 13.43 2.3 24.8 18.32
3C 3 7.3
89.88
0.37
0.902
61.008
9.408
1.74
18.23 13.6
4
3.1 7.6 107.85 0.46 1.705 66.065 8.735
1.9
15.23
16.96
Table 2: Summary of Effective Permeability.
roCe
Number
d
(cm)
h
(cm)
A
(cm2)
Q
(cm3/s)
(cP)
P
(atm)
K
(mD)
1
3.1
7.9 92
3.342 0.018 0.13 40
2A
3.3 3.6 54.40 0.518 0.018 0.068
9
2B
3.1
7.9 92
3.418 0.018
0.095
56
2C 3.3 7.6
95.85
0.567 0.018 0.588 1.376
3A 3.3 4.6 54.40 1.538 0.018 0.560
4
3B
2.9
8.2 87.88
19.855
0.018 0.260 128
3C 3 7.3
82.9 3.90
0.018 0.017 363
4
3.1 7.6
89.07
17.84 0.018 0.300
91
Table 3: The Result of Laboratory Work for Potential Reservoir of Eigth Channel Deposits Sandstone.
Core
Number
Efsective
Porofity
(%)
Visible
Porostiy
(%)
effemtive
PErmeability
(cD)
Porosity
Condition
Permeability
Condition
PRtential
oeservoir
1
12.52 13.28 40
Fair
Good
Fair
2A
10.18 7.84
9
Fair Fair Fair
2B
12.53 11.68 56
Fair
Good
Fair
2C 3 5.76 1.376
Neglilibge Tight
Poor
3A 0.5 3.36
4
Negligible Tight
Poor
3B 24.8 18.32 128
Very
Good
Veoy Gord
Very
Good
3C 18.23 13.6 363 Good
Very Good
Very
Good
4
15.23
16.96 91
Good Good Good
Analysis of Porosity and Permeability on Channel Deposit Sandstone using Pore-gas Injection and Point Counting in Sarilamak Area, West
Sumatra
29

The porosity classified as negligible porosity is
core 2C (3%) and 3A (0.5%), fair porosity is core 1
(12.52%), core 2A (10.18%) and core 2B (12.53%),
good porosity is core 3C (18.23%) and core 4
(15.23%), only core 3B (24.8%) that classified as
very good porosity. The permeability classified as
tight permeability is core 2C (1.376 mD) and core 3A
(4 mD), fair permeability is core 2A (9 mD), good
permeability is core 1 (40 mD), core 2B (56 mD),
and core 4 (91 mD), very good permeability is core
3B (128 mD) and core 3C (363Accordind the value
of porosity and permeability can be conclude into a
potential reservoir by Koesoemadinata (1980) is core
3B, core 3C, core 4 because has good – very good in
porosity and permeability.
4 CONCLUSION
The result shows that this channel deposits
sandstone has the effective porosity which ranged
from 0.5% - 24.8% that classified as negligible –
very good porosity, however the visible porosity
showed value 3.36% - 18.32% which classified into
negligible – good porosity, effective permeability in
study area ranged from 1.376 mD – 363 mD. The
difference result from the value of the porosity and
permeability in study area caused by the compaction,
sorting, grainsize of the sandstone which different
between channels. According the value of porosity
and permeability in study area, can be conclude as
potential reservoir are only three core (3B, 3C, and 4)
cause has good – very good porosity and permeability.
ACKNOWLEDGMENTS
Authors would say thanks to all of the field team,
and also Department of Geological Engineering,
Universitas Islam Riau for giving support for this
study.
REFERENCES
Choanji, T., Rita, N., Yuskar, Y., and Pradana, A. (2018).
Analog study of fluid flow on deformation band at
petani formation, riau, indonesia. In MATEC Web of
Conferences, volume 159, page 01034. EDP Sciences.
Choanji, T., Yuskar, Y., Putra, D. B. E., and Cahyaningsih,
C. (2019). Clustering Slope Stability Using
Dem Lineament Extraction And Rock Mass Rating
In Pangkalan Koto Baru. WEST SUMATRA,
INDONESIA. Int. J. Geomate, 17.
Dandekar, A. Y. (2006). Petroleum reservoir rock and fluid
properties. Boca Raton, FL?: CRC/Taylor & Francis.
Demirmen, F. (1972). Operator error in petrographic
point-count analysis: A theoretical approach.
Mathematical Geology - MATH GEOL.
Handwerger, D. A., Keller, J., and Vaughn, K. (2011).
Improved Petrophysical Core Measurements on Tight
Shale Reservoirs Using Retort and Crushed Samples.
SPE Annu. Tech. Conf. Exhib.
Koesoemadinata, R. P. (1980). Geologi Minyak dan Gas
Bumi. InstitutTeknologi Bandung, Bandung.
Nichols, G. (2009). Sedimentology and stratigraphy. J.
Chem. Inf. Model. 53, 53(419.).
Wibowo, A. and Fardiansyah, I. (2016). Alluvial – fluvial
architecture of synrift deposits: An observation from
the outcrops of brani fm. Ombilin Basin, West
Sumatra. Ber. Sedimentol, 36.
Yuskar, Y. and Choanji, T. (2017). Uniqueness deposit of
sediment on floodplain resulting from lateral accretion
on tropical area. J. Geosci. Eng. Environ. Technol. 2,
2(14.).
ICoSET 2019 - The Second International Conference on Science, Engineering and Technology
30
