
Prototype the Economic of Coconut Farmer Household in Indragiri Hilir
Municipality, Riau Province
Heriyanto
1
, Asrol
1
and Detri Karya
2
1
Department of Agribusiness, Faculty of Agricultural, Universitas Islam Riau, Pekanbaru, Indonesia
2
Department of Management, Faculty of Economics, Universitas Islam Riau, Pekanbaru, Indonesia
Keywords:
Impact, Economic Decisions, Coconut Farmer Households.
Abstract:
Coconut farming is the main livelihood of the majority of households in Indragiri Hilir. Although the
penetration of oil palm plantations has entered the region, the existence of palm, coconut smallholders,
in particular, is still maintained. In order to maintain the existence of the coconut as a commodity with
a great contribution to the economy Indragiri Hilir, it is necessary to alignments economic policy. This
study was conducted with the aim of analyzing the impact of economic policies on household economic
decisions coconut farmers associated with the production, allocation of working time, income, consumption,
and investment. Simultaneous equations econometric approach with two stages least square method (2SLS)
was used to answer the research objectives. The result of the analysis showed that the increase in coconut
prices and the hired labor in coconut farming impact contrary to the policy of increasing wages. Increasing
the price of coconut and the use of hired labor a positive impact on farm household economy in terms of
increased production, income, household consumption, and investment, but a negative impact on the allocation
of working time. Meanwhile, wage increases have a negative impact on production, income, consumption
and business investment, but a negative impact on the allocation of working time. Therefore, the policy of
increasing the price of coconut through the government’s efforts to encourage an increase in the price of
coconut through the coconut pricing policies or to realize the strong bargaining position of farmers against
market structures tend to be oligopsony needs to be done. In addition, it is also necessary to encourage
household persuasive farmers to be more focused on making coconut farming by allocating more time working
on his coconut farm.
1 INTRODUCTION
The mining sector still provides the largest
contribution to GRDP of Riau Province, but with a
declining trend, which is 51.49 percent in 2008 to
45.48 percent in 2012. Resource mining, especially
oil and gas, which includes unrenewable resources
with a downward trend suggests that this sector can
not rely on contribution to long-term development.
It is, therefore, necessary in addition to efforts to
develop mining resources (especially oil and gas) in
order to realize sustainable economic growth.
Based on the GDRP without oil and gas of
Riau Province (BPS Riau Province, 2018) shows
the agricultural sector is the sector with the
largest contribution, which is 31.57 percent of total
GDRP, respectively, followed by trade, hotels, and
restaurants 17.09 percent, and the industrial sector
processing 17.09 percent. A plantation subsector
with the largest contribution compared with other
agricultural subsectors. Contributions subsector
plantations 44.37 percent of the total GDP of
agriculture, followed by forestry subsector 27.41
percent, the food crops subsector 11.22 percent, the
fisheries subsector 11.14 percent, and the livestock
and the results subsector 5.85 percent.
Three plantation crops which a mainstay in the
development of agriculture in the Riau Province
are oil palm, coconut, and rubber. Acreage and
production of palm oil are the biggest, followed
by coconut and rubber. Acreage and production
of palm oil are likely to increase. Meanwhile,
acreage and production of coconut and rubber tend
to decrease. Data of acreage and production of
three major plantation commodities in Riau Province
respectively presented in Tables 1 and 2
Coconut and rubber are the commodities that have
been cultivated for generations by the people in the
Heriyanto, ., Asrol, . and Karya, D.
Prototype the Economic of Coconut Farmer Household in Indragiri Hilir Municipality, Riau Province.
DOI: 10.5220/0009059800690078
In Proceedings of the Second International Conference on Social, Economy, Education and Humanity (ICoSEEH 2019) - Sustainable Development in Developing Country for Facing Industrial
Revolution 4.0, pages 69-78
ISBN: 978-989-758-464-0
Copyright
c
2020 by SCITEPRESS – Science and Technology Publications, Lda. All rights reserved
69
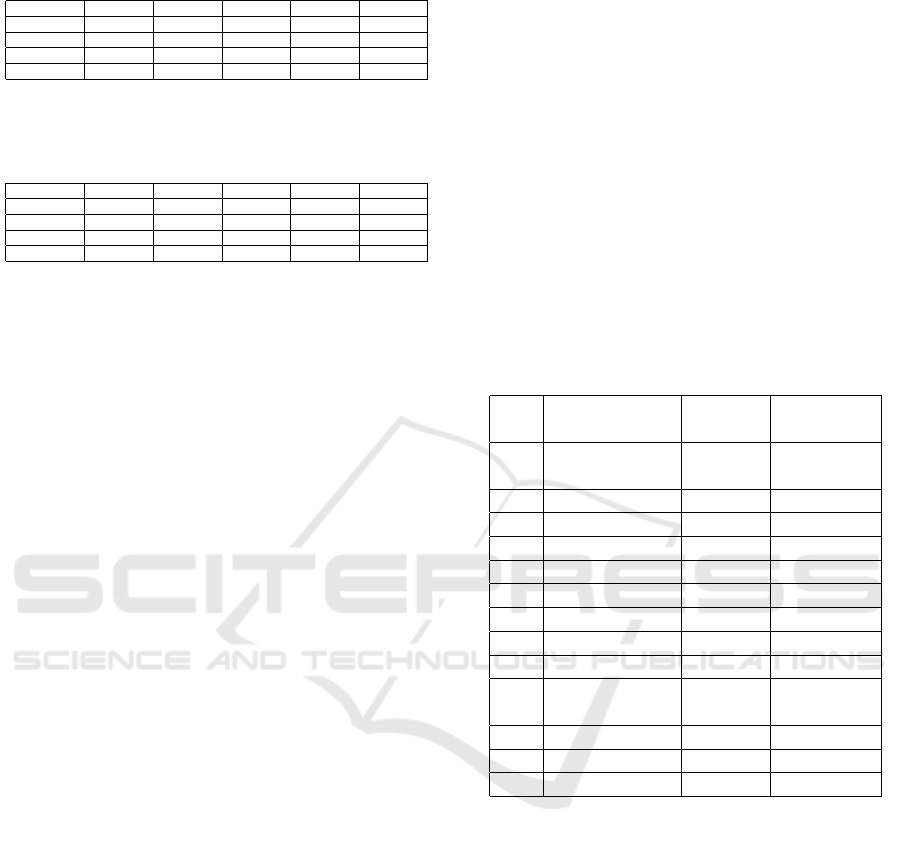
Table 1: The Area of Three Major Commodities Crops in
the Riau Province, 2013-2017
Commodity 2013 2014 2015 2016 2017
Coconut 521,038 521,792 520,260 516,895 515,168
Rubber 504,139 500,851 505,264 502,906 501,788
Palm Oil 2,258,553 2,372,402 2,399,172 2,411,820 2,424,545
Others 118,082 118,924 119,018 119,591 118,688
Source: Central Bureau of Statistics of Riau Province,
2018
Table 2: The Production of Three Major Commodities
Crops in the Riau Province, 2013-2017
Commodity 2013 2014 2015 2016 2017
Coconut 481,087 473,221 427,080 421,654 421,465
Rubber 333,069 350,476 354,257 367,261 374,465
Palm Oil 7,047,221 7,343,498 7,570,854 7,761,293 7,841,947
Others 304,802 302,796 143,230 356,740 383,134
Source: Central Bureau of Statistics, of Riau
Province, 2018
Riau Province. However, in the last two decades,
people like hypnotized to massively develop oil palm,
while the benefits of coconut and rubber are not the
same as the benefits of palm oil. In other words,
the products of coconut, rubber and palm oil have
economic benefits or its own market share. Therefore
earnest efforts need to be done so that people continue
to develop coconut and rubber as a commodity that
has high economic value for the social welfare and
the economic resilience of Riau Province.
This study focused on the effort to assess
conditions in the household economy coconut farmers
because it is believed to still potential developed as
one of the community’s main source of livelihood in
the Riau Province, especially coastal communities.
It is based on the idea that natural coastal areas are
prime habitat for the development of coconut.
This study was conducted in Indragiri Hilir
municipality because it has a land area and the largest
oil production compared to other municipality/cities
in Riau Province. Acreage and production of coconut
in Indragiri Hilir 440.821 hectares and 298.599
tonnes, respectively (Table 3).
The success in the development of coconut
farming is largely determined by the economic
efficiency of households involved in the business.
The success of these households not only resulted
in increased household income but can contribute
to national revenue and providing employment
opportunities. Activities of households include
consumption and production are carried out
simultaneously. Theoretically, households as
consumers aim to maximize their utility, while as
producers to maximize profit (Lipsey et al., ).
To achieve the desired objectives, households as
consumers and producers should be able to make
choices and take the right decision in conducting
economic activities. Decisions taken include: (1)
the decision to allocate working time and earnings in
the activities of coconut farming and other business,
and (2) the decision in the activities of private
consumption.
Decision-making by households is very directly
related to internal factors households, include:
education level of the head and household members,
age and work experience at the head of the household
business activity are practiced as well as other internal
factors. In addition, household economic decisions
are also influenced by external factors, such as wages,
input prices, and output prices. Various actions taken
by households and the prevailing economic policies
will greatly affect economic decision making coconut
farmer households.
Table 3: The Distribution Area and Production of Coconut
According to the Municipality/City in the Riau Province in
2017
No.
Municipality
/City
Area
(Ha)
Production
(Ton)
1.
Kuantan
Singingi
2,761 1,925
2. Indragiri Hulu 1,828 250
3. Indragiri Hilir 440,821 298,599
4. Pelalawan 16,789 17,430
5. Siak 1,628 1,193
6. Kampar 1,714 529
7. Rokan Hulu 1,139 620
8. Bengkalis 10,020 9,728
9. Rokan Hilir 5,362 4,412
10.
Kepulauan
Meranti
31,453 27,384
11. Pekanbaru 15 9
12. Dumai 1,638 876
Total 515,168 362,955
Source: Central Bureau of Statistics of Riau Province,
2018
Various studies on household economies have a
lot to do in Indonesia, among others: Firstly, a
study on the economic analysis of industrial finished
products rattan household with two stages least
squares method (2SLS) conducted by (Elinur, ).
Secondly, study on the household economy analysis
to develop a theory of agricultural household model
through the interrelation between the technological
aspects of conservation and non-food consumption
by a 2SLS method performed by (Koestiono, 2004).
Thirdly, (Priyanti et al., 2007) conducted a study
on the economic model of farmer households in
crop-livestock integration system. Finally, (Husin
and Sari, 2011) conducted a study on the economic
behavior of coconut farmer households in the
ICoSEEH 2019 - The Second International Conference on Social, Economy, Education, and Humanity
70

allocation of labor, production, and consumption in
Prabumulih, also using 2SLS.
In general, this study aimed to analyze the impact
of economic policies on the economy of coconut
farmer households in Indragiri Hilir. Specifically, the
objective of this study was to analyze the internal
and external factors that affected the allocation of
work time, income and consumption expenditure of
household coconut farmers.
2 THEORY OF HOUSEHOLD
ECONOMIC
Household economic model initiated by Neoclassical
economic theory. Later this model was developed
by Chayanov then called model Chayanov (Chen and
Dunn, 1996). Furthermore, the model of the economy
continues to grow through research conducted by
(Becker, 1965), (Barnum and Squire, ) and (Singh
et al., 1986).
Neoclassical economic theory is the beginning of
a basic model with a unit of household economic
analysis underlying this theory is a microeconomic
analysis at the level of consumers and producers. The
model developed by integrating Kasyanov between
production and consumption decisions to analyze the
farmer households (Chen and Dunn, 1996). The
household economic models can be used to analyze
the economic behavior of agricultural companies
entirely using the allocation of working time and
sell the entire production is generated to the market.
In contrast to the subsistence agriculture that relies
on labor in the family so that there is no market
surplus. The household economic model based
on the theory of households with an integrated
treatment between the production and consumption
decisions (Barnum and Squire, ). (Singh et al.,
1986) initiated a model household that can be used
to analyze the household farmer and the household
in addition to agriculture. The assumptions used in
this model is that the household has always worked
with maximizing utility, where utility derived from
the consumption of goods produced by households,
goods purchased in the market and the leisure.
Research on the economic of households
conducted simultaneously, in general use the
household economic model formulated by Becker
(1965). Becker (1965) formulate an agricultural
household model which integrates the activity of
production and consumption as a whole and the use
of labor in the household. There are a number of
assumptions used in the economic model of these
households, namely:
• The satisfaction of households to consume is
not only determined by the goods and services
acquired in the market but is also determined
by a variety of commodities produced in the
household,
• An element of satisfaction is not only goods and
services, but including time,
• The time and the goods or services can be used as
a production factor in the production of household
activity
• Households act as producers and consumers.
In accordance with the theory of household
behavior developed by Becker (1965), that the utility
does not depend on the number of goods and
services purchased, but rather by the number of
commodities household-they produce, include: the
quality and quantity of children, dignity, recreation,
companionship, affection, health status and marital
status, then this assumption is the basis of household
economic models Becker. Mathematically, the model
household Becker formulated as follows:
U = f (z) (1)
Z = g(X,t) (2)
Where:
U = utility
Z = household commodities
X = market commodities
t = non-work activity
The household members will always maximize
the utility to maximize its income constraints and Z
with certain time constraints. Mathematically, it can
be formulated as follows:
Max Z = x(x
1
,x
2
,...,x
m
;t
1
,t
2
,...,t
k
;E) (3)
Subject to:
∑
m
p
i
x
i
=
∑
k
w
j
I
j
+ v (4)
I
j
+t
j
= T (5)
Where
x
i
= market commodity i
p
i
= price of market commodity i
t
j
= leisure
I
j
= working time
Prototype the Economic of Coconut Farmer Household in Indragiri Hilir Municipality, Riau Province
71

T = total time
V= property income
With substitute of equation (5) to equation (4),
then:
Σ
m
p
i
x
i
+ Σ
k
w
j
t
j
= Σ
k
w
j
T + v = s (6)
Equation S is called constraint of a full income
because S is full income.
Assumptions proposed by Becker is that the
decline in the total output of household did not
make one in the household members become better
off and some members of the household become
worse off. In other words, what matters is the
total output of the household, so that every member
of the household willing to cooperate in managing
time and commodity markets in order to maximum
Z households. To maximize Z households, there
requirements (Necessary condition) that must be met
such as the following equation:
MPt
j
= (∂Z/∂t
i
)
MPt
j
= (∂Z/∂t
i
)
=
W
i
W
j
, for all 0 < t < T (7)
If the allocation of working time of household
member k = T, then:
MPt
k
MPt
j
=
µk
W
j
(8)
Where: µ
k
≥ W
k
is shadow price of time k.
MPx
i
MPt
j
=
P
i
W
j
, , for all x
i
> and 0 < t
j
< T (9)
Meanwhile, Singh et al. (1986) suggest that
household utility is a function of consumption of
goods produced by household, consumer goods
purchased in the market, and leisure. Mathematically,
formulated as follows:
U = u(X
∂
,X
m
,X
1
) (10)
Where:
X
a
= consumption goods produced by household
X
m
= consumption goods purchased in the market
X
1
= leisure
The difference between the model Becker (1965)
and models Singh (1986) was on the income equation,
the satisfaction-maximizing household income and
faced with the constraints of time, but on a model
developed by Singh et al. (1986) not only faced
with two obstacles, but also incorporate production
constraints in the model.
These constraints consecutive ranging from
income constraints, the allocation of time and
production, formulated as follows:
P
m
X
m
= p
a
(Q − X
∂
) − w(L − F) (11)
T = X
1
+ F (12)
Q = q(L,A) (13)
Where:
P
m
= price of good purchased in the market
Pa = price of good produced by household
(Q − X
a
) = surplus production to be marketed
w = wages
L = total of labor
F = family worker
T = household working time
A = fixed input (land)
From equation (11), when the element (L-F)
positive means that households hire labor outside the
family, otherwise if (L-F) negative means households
supply labor outside the family. Third constraints
faced by the household can be unified by distributing
the time constraints (equation 12) and production
(equation 13) into a revenue constraint (equation 11),
so that the resulting equation 14 below:
P
m
X
m
+ p
∂
x
∂
+ wX
1
= wT + π (14)
π = P
∂
Q(L,A) − w(L − F) (15)
Where:
π = Profit
The equation on the left side (14) is the total
expenditure of households on goods (X
m
and X
a
)
and time (X1) are consumed, and the right side
shows the development of the concept of full income
developed by Becker (1965), where the value of the
time available (wT ) explicitly noted. Singh et al.
(1986) to expand the model Becker (1965) to include
the measurement of the level of business profits,
namely π = PAQ - wL (equation 15), where the entire
workforce is calculated based on market wages.
From equation (10) and (14) can be stated that the
households in maximize satisfaction can have a level
of consumption of goods purchased on the market
(Xm), goods produced by households (Xa), the time
consumed by households (X1) and energy labor (L)
used in production activities. Taking into account
the use of labor input, the condition of the first-order
condition can be derived as follows:
ICoSEEH 2019 - The Second International Conference on Social, Economy, Education, and Humanity
72

P
∂
∂Q/∂L = W (16)
From equation (10) and (14) can be stated that
the households in satisfaction-maximizing can have
a level of consumption of goods purchased on the
market (Xm), goods produced by households (Xa),
the time consumed by households (X1), and labor
(L) used in production activities. Taking into account
the use of labor input, the condition of the first-order
condition can be derived as follows:
L
∗
= L
∗
(w, p
∂
,A) (17)
Then equation (17) substituted into the right side
of the equation (14) produces a full income when
profit is maximized through the choice of labor input.
Thus, equation (14) can be written as follows:
P
m
X
m
+ P
∂
X
∂
+ wX
l
= Y
∗
(18)
Where: Y
∗
= Full income when maximum profit.
Equation (18) is now a new constraint in the
model, the results of calculation of the first-order
condition in succession against Xm, Xa, and X1 as
follows:
∂U/∂X
m
= τp
m
(19)
∂U/∂X
∂
= τp
∂
(20)
∂U/∂X
1
= τw (21)
p
m
X
m
+ p
∂
X
∂
+W X
1
= Y
∗
(22)
Referring to the stages in the completion of the
equation (16), by simultaneously solving, resolving
equation (19) to (22) generates a demand function as
follows:
X
m
= X
m
(p
m
, p
∂
,w,Y
∗
) (23)
X
∂
= X
∂
(p
∂
, p
m
,w,Y
∗
) (24)
X
1
= X
1
(w, p
m
, p
∂
,Y
∗
) (25)
From equation (23), (24) and (25), we can say
that the amount of demand (consumption) of goods,
goods, and services is a function of the price of
the goods, the price of other goods, wages, and full
income when the maximum profit.
From equation (24), if the assumed price of
goods produced by households increased, it will
have an impact on the household income gains,
mathematically expressed as follows:
dX
a
d p
a
=
d p
a
d p
a
+
∂X
a
∂X
a
∂Y
∗
∂X
a
(26)
The first element on the right side of equation
(26) is expressed as the effect of price changes,
which in the case of normal goods had a negative
slope, meaning that if the price increases, the
demand for these goods and services will comply.
Meanwhile, the second on the right side declare the
income effect, meaning that if the price of goods
produced household increases, the income earned that
household will increase, so does the full household
income will increase.
In analyzing the economic to note two things:
Firstly, it should be emphasized that the price of
goods and services consumed by households is
considered the market price. Secondly, it should
be ensured that the behavior of households in the
activity of production and consumption is separable
(separate) or non-separable (simultaneously). If the
equations of production, the allocation of working
time and consumption are included in the model
are separable, the estimated system of equations of
production and consumption can be done separately,
for example, analyze the system of equations of
production with an educated guess through profit
function or a function of cost, while the system of
equations consumption by using approaches Almost
Ideal Demand System (AIDS) (Sadoulet and De
Janvry, 1996). Whereas, if the system of equations of
production and consumption as well as the allocation
of working time labor is nonseparable, then the
more complex estimation techniques need to be done.
Estimation among others can be done by using a
Two-Stage Least Square (2SLS) or Three-Stage Least
Square (3SLS).
3 RESULT AND DISCUSSION
3.1 Research Location and Time
The study was conducted in February 2017 until
December 2017 in Indragiri Hilir, Riau Province, with
sampling locations in four districts, namely Mandah,
Pulau Burung, Enok, and Keritang. Location of study
was determined by deliberate consideration that this
area is an area that has a fairly extensive coconut
plantation in Indragiri Hilir.
3.2 Data and Sampling Techniques
The data collected in this study include primary and
secondary data. The primary data obtained from
Prototype the Economic of Coconut Farmer Household in Indragiri Hilir Municipality, Riau Province
73
interviews with respondents, namely coconut farmer
households. Secondary data was collected from the
Plantation Office, the Central Bureau of Statistics and
other sources. Secondary data used to support the
primary data and refine the analysis in this study.
The sampling was done by multi-stages purposive
sampling. The number of samples taken for
household coconut farmers deliberately taken in the
area Indragiri Hilir which of the 12 districts, selected
four districts that have a population of households
coconut farmers are pretty much the Mandah, Pulau
Burung, Enok, and Keritang. For each district was
selected three villages, and each village took as many
as 15 samples, so that the number of samples taken
to local households, the coconut is as many as 180
samples.
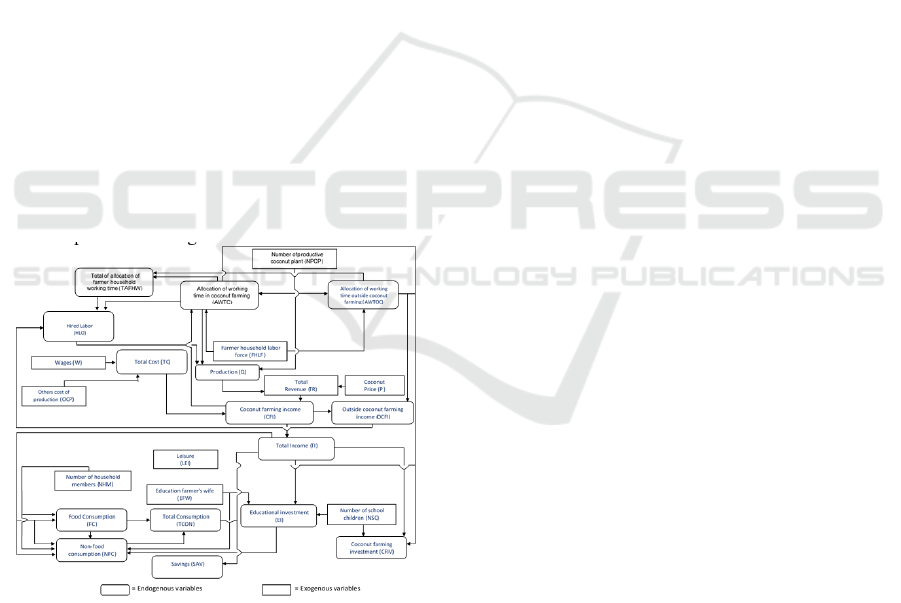
3.3 Model Specification
The first stage in the study with the econometric
approach is a model specification. At this stage
can be illustrated a diagram of the relationship
between the variables entered into the model, which
then formulated into a number of the equation
of structural and identity (Koutsoyiannis, 1977;
Interligator, 1978). Simplification of the economic
model of coconut farmer households in Indragiri Hilir
is presented in Figure 1 below.
Figure 1: Simplification of Economic Model of Coconut
Farmer households
3.4 Model Identification and Method of
Estimation
Models are built to be identified first and then
estimated. Identification of the model is done by order
condition, according to the formula:
(K–M ) ≥ (G–1) (27)
Where:
K = total variables in the model (endogenous and
exogenous variables)
M = number of endogenous and exogenous
variables in the equation are identified
G = number of equations (the number of
endogenous variables).
If (K-M) > (G-1), then the equation is
overidentified; if (K-M) = (G-1), the equation is
exactly identified; and if (K-M) < (G-1), then
the equation is unidentified (Koutsoyiannis, 1977;
Interligator, 1978).
The identification results of the economic model
of coconut farmer households is overidentified (K =
27, M = 4 and G = 16). Based on the results of
this identification, the most appropriate estimation
method is used the Two-Stage Least Square (2SLS).
Needs to be informed that the level of significance is
used in discussing the results of this study using the
tolerance level of Significantly, up to 20 percent (α =
20%).
3.5 Model Validation and Simulation
Model validation was conducted in order to determine
whether a model is valid is used for simulation
analysis. Validation of the model performed in this
study using the statistical criteria, ie RMSE (Root
Mean Square Error), RMSPE (Root Mean Square
Percent Error), U-Theil and UM-Bias (Pindyck and
Rubinfeld, 1991).
In the economic model of coconut farmer
households in Indragiri Hilir, economic policies
simulated include:
• an increase in the coconut price by 13 percent,
• an increase in the wages by 14 percent, and
• an increase in the hired labor by 6 percent.
4 RESULT AND DISCUSSION
4.1 Results of Model Estimation
The results of the estimation of the economic model
of coconut farmer households in this study are quite
good as seen from the coefficient of determination
(R
2
) of every equation in the model. The coefficient
of determination is ranged from 0.4407 to 0.9753
by F test statistic values are quite high (34.48 to
ICoSEEH 2019 - The Second International Conference on Social, Economy, Education, and Humanity
74

2313.56) and significantly different from zero at the
1 percent level. The coefficient of determination of
the smallest (less than 0.5) is only found in household
food consumption equation. However, in general,
exogenous variables are included in each equation
better able to explain the endogenous variables.
Table 4 presents the results of testing on 16
equations in the economic model of coconut farmers
household in Indragiri Hilir. From Table 4, it can be
stated that the overall sign estimated parameters as
expected.
The results of estimation indicate that coconut
production is positively influenced but not responsive
to changes in the number of productive coconut
plant, the allocation of working time in coconut
farming, and hired labor. From the aspect of the
allocation of work, time can be stated that: Firstly,
allocation of working time in coconut farming is not
responsive to changes in the coconut farming income
(positive), the allocation of working time outside
coconut farming (negative), and the household labor
force (positive). Secondly, hired labor influence
positively but not responsive to coconut farming
income. And thirdly, the allocation working
time outside coconut farming responsive to outside
coconut farming income (positive) and unresponsive
influenced by education level farmer’s wife this is in
line with studies (Nurhayati et al., ) and (Mariyanto,
2015).
The results of the estimation equation household
income and expenditure show that:
Firstly, outside coconut farming income
responsive to changes in the allocation of working
time outside coconut farming (positive), and
unresponsive influenced by coconut farming income
(negative). Secondly, there are no internal and
external factors that are responsive affect food
consumption expenditure of coconut farmer
households. Instead, there are several factors
that are responsive affect non-food consumption
expenditure, the total income (positive), food
consumption expenditure (negative), and savings
(negative). Thirdly, educational investment is
positively influenced by the total income, and
the number of school children, but unresponsive.
Fourthly, coconut farming investment is positively
influenced and responsive by total income. Finally,
household savings responsive to changes in total
income (positive). Savings are also responsive to
changes in household total consumption (negative).
4.2 Validation and Simulation Model
The results of the analysis of model validation show
RMSE value of all variables endogenous to the
economic model of coconut farmer households less
than 50 percent, except for variable of hired labor,
the allocation of working time in coconut farming,
outside coconut farming income, educational
investment, leisure, and savings. Furthermore, if
the observed value of the U-Theil for each variable
endogenous to the economic model of coconut
farmer households are quite small, which is less then
0:20, except variables of hired labor, the allocation
of working time outside coconut farming, outside
coconut farming income, the non-food consumption,
total consumption, educational investment, coconut
farming investment, and savings have U-Theil value
greater than 0.2.
Some endogenous variable that has a value
RMSPE more than 50 percent and U-Theil more than
0:20 indicate bias in the estimation models. But
when seen from the UM value for all endogenous
variables are equal to zero, it can be stated that no
systematic bias occurs. Therefore, the economic
model of coconut farmer households who built quite
well and can be used for policy simulation analysis.
The simulation results show that: Firstly, the
increase in coconut prices as well as increased
use of hired labor a positive impact on coconut
production and the allocation of working time
in coconut farming. Instead both these policy
simulations negative impact on the allocation of
working time outside coconut farming. In a total
of allocation of farmer household, working time
has increased. The increase in coconut prices is
a positive impact on coconut production further
positive impact on coconut farming income. On
the other hand, the increase in coconut prices that
negatively impact the allocation of working time
outside coconut farming further negative impact on
coconut farming income. Nevertheless, the total
income of farmers has increased. The increase in
total income is followed by an increase in non-food
household consumption, coconut farming investment,
educational investment, and household savings. The
decline in food consumption is very rational, which
according to the Engel law which states that the
higher the income, the proportion of income used for
food consumption will decrease.
Secondly, the increase in the wage impact at
odds with the rising prices and increased outpouring
of working families in coconut farming. A wage
increase indicates increased costs of production in
coconut farming which further negatively impact the
Prototype the Economic of Coconut Farmer Household in Indragiri Hilir Municipality, Riau Province
75

Table 4: The Results of Parameters Estimate and Values Elasticity of Household Economic Model of Coconut Farmer
Households in Indragiri Hilir
Equation/Variable Notation
Parameter
Estimate
t-test Pr >|t| Elasticity
1. Production of coconut
Intercept
Number of the productive
coconut plant
Allocation of working
time in coconut farming
Hired Labor
Q
-
NPCP
AWTC
HLO
-2145.84
17.05593
5.561301
6.494564
-2.85
6.75
6.72
9.08
0.0049
<.0001
<.0001
<.0001
0.3813
0.4843
0.2111
2. Allocation of working time in
coconut farming
Intercept
Coconut farming income
Allocation of working time
outside coconut farming
Farmer household labor force
AWTC
-
CFI
AWTOC
FHLF
486.0200
0.000036
-0.28702
238.4417
2.47
11.75
-0.78
1.57
0.0144
<.0001
0.4375
0.1185
0.5079
0.3448
3. Hired Labor
Intercept
Coconut farming income
Allocation of working time outside
coconut farming
Farmer household labor force
HLO
-
CFI
AWTOC
FHLF
-151.558
0.000038
0.363197
-176.828
-0.78
12.47
1.00
-1.18
0.4337
<.0001
0.3173
0.2377
0.0001
4. TAWTC = AWTC + HLO TAWTC = Total of allocation of working time in coconut farming
5.Allocation working time
outside coconut farming
Intercept
Outside coconut farming income
Education farmer’s wife
AWTOC
-
OCFI
EFW
-17.8683
0.000052
21.07800
-0.19
14.00
2.13
0.8474
<.0001
0.0345
1.9075
0.1935
6. TAFHW = AWTC + AWTOC TAFHW = Total of allocation of farmer household working time
7. CFI = TR - TC
TR = Total revenue
TC = Total cost
8. TC = W + OCP
W = wages
OCP = others cost of production
9. Outside coconut farming income
Intercept
Allocation of working time
outside coconut farming
Coconut farming income
Farmer household labor force
OCFI
-
AWTOC
CFI
FHLF
122263.9
14085.08
-0.03643
1051644
0.08
5.05
-1.56
0.92
0.9346
<.0001
0.1206
0.3614
1.9075
-0.1516
10. TI = CFI + OCFI TI = Total income
11. Food consumption
Intercept
Total income
Number of household members
Educational investment
Savings
FC
-
TI
NHM
EI
SAV
5075269
0.261552
1349970
-0.27642
-0.23613
3.91
3.28
4.47
-2.58
-2.56
0.0001
0.0012
<.0001
0.0108
0.0115
0.6653
0.3299
-0.0554
-0.2244
12. Non-food consumption
Intercept
Total income
Food consumption
Educational investment
Savings
NFC
-
TI
FC
EI
SAV
651523.1
0.607739
-0.60712
-0.64552
-0.59526
1.41
19.54
-11.46
-18.73
-17.86
0.1591
<.0001
<.0001
<.0001
<.0001
5.3647
-2.1009
-0.4489
-1.9633
ICoSEEH 2019 - The Second International Conference on Social, Economy, Education, and Humanity
76

Equation/Variable Notation
Parameter
Estimate
t-test Pr >—t— Elasticity
13. TCON = FC + NFC + LEI
TCON = Total consumption
LEI = Leisure
14. Educational investment
Intercept
Total income
Number of school children
EI
-
TI
NSc
-1874864
0.049803
3354331
-3.89
5.18
12.35
0.0001
<.0001
<.0001
0.6238
0.9302
15. Coconut farming investment
Intercept
Total income
Number of school children
CFIV
-
TI
NSc
5699621
1.790429
-0.78841
0.35
13.72
-0.66
0.7304
<.0001
0.5114
1.0812
16. Savings
Intercept
Total Income
Total consumption
SAV
-
TI
TCON
1985529
0.952118
-1.20417
0.91
41.19
-9.12
0.3623
<.0001
<.0001
2.4345
-1.6017
decline in household income of coconut farmers.
The decrease in income will affect the decline in
consumption, investment and household savings.
5 CONCLUSION
Theoretically, household economic decisions are
influenced by internal factors and external factors.
Nevertheless, empirical analysis of household
economic decisions coconut farmers in Indragiri
Hilir, only internal factors that are responsive
influence the economic decisions of households.
From the aspect of production, can not be found
factors both internal and external factors affecting
responsive, but the variables that most influence is
the allocation of working time in coconut farming.
From the aspect of the allocation of working time,
internal factors that responsive it’s affected is the
outside coconut farming income. Meanwhile, from
the aspect of income, internal factors that responsive
affected income of coconut farmers household is the
allocation of working time outside coconut farming.
Further aspects of expenditures of coconut farmer
households in Indragiri Hilir, internal factors that
responsively affected are total income and savings.
The policy of increasing coconut prices and
hired labor have a positive impact on the economy
of coconut farmer households in Indragiri Hilir.
Conversely, an increase in wages on coconut
farming has a negative impact on the economy of
coconut farmer households. This implies that the
government’s efforts to encourage an increase in the
coconut price through the coconut pricing policies or
to realize the strong bargaining position of farmers on
market structure tends to be oligopsony needs to be
done. In addition, it is also necessary to encourage
farming households persuasively to focus on doing
the coconut farming by allocating more working time
on his coconut farm.
ACKNOWLEDGMENTS
The Biggest thanks to all colleagues during the data
collection and the parties involved in this research
and the Universitas Islam Riau who permitted field
observation, and hopefully this article can be useful
as it should.
REFERENCES
Barnum, H. and Squire, L. 1979. An Econometric
Application of the Theory of the Household. Journal
of Development Economics, 6:79–102.
Becker, G. S. (1965). A theory of the allocation of time.
The Economic Journal.
Chen, M. A. and Dunn, E. (1996). Household economic
portfolios.
Elinur. 2004. The Analysis of Household Socio-Economic
of Rattan Finish Product in Pekanbaru City. Thesis.
Husin, L. and Sari, D. W. (2011). The Economic Behavior
of Coconut Farmer households in Prabumulih
in Allocation of Working Time, Production, and
Consumption. Research Report of Indonesia
Managing Higher Education for Relevance and
Efficiency (I-MHERE).
Interligator, M. D. (1978). Econometric Model, Techniques,
and Applications. Prentice Hall Inc., Hew Jersey.
Koestiono, D. (2004). The Economic Analysis of Farmer
households in Conservation Effort. Thesis.
Prototype the Economic of Coconut Farmer Household in Indragiri Hilir Municipality, Riau Province
77

Koutsoyiannis, A. (1977). Theory of Econometrics. Harper
and Row Publisher Inc., New York.
Lipsey, R. G., Steiner, P. O., and Purvis, D. D. 1995.
Economics.
Mariyanto (2015). J. Dwiastuti. R and Hanani. N. 2015.
Household Economics Model of Dryland Agriculture
In Karanganyar Regency, Central Java Province.
Journal Habitat, 26(2).
Nurhayati, B., D, and Yusmini. 2012. Factors Affecting
The Decision of The Economic Household Cocoa
Farmers in Kuantan Singingi. Indonesian Journal of
Agricultural Economucs (IJAE), 3(2):105–116.
Priyanti, A., Sinaga, B. M., and Syaukat, Y. (2007). dan s.
U. Kuntjoro. 2007. The Economic Model of Farmers
Household in Integration System of Crops-Livestocks:
Conception and Empirical Study. Wartazoa.
Singh, I., Squire, L., and Strauss, J. (1986). A survey
of agricultural household models: Recent findings
and policy implications. The World Bank Economic
Review, 1(1):149–179.
ICoSEEH 2019 - The Second International Conference on Social, Economy, Education, and Humanity
78
