
Identification of Rice Leaf Disease based on Rice Leaf Image Features
using the k-Nearest Neighbour (k-NN) Technique
K. Adiyarta, C. Zonyfar and T. Fatimah
Universitas Budi Luhur
Keywords: Rice Leaf Disease, Digital Image Processing, k-NN, k-nearest Neighbour, Rice Leaf Image Features System
Abstract: Increasing productivity of rice plants is crucial to offset the rate of population growth because rice for most
of the world's population is the primary energy source. The phenomenon of degradation of fertility and
disease in rice plants poses a severe challenge, prevention and control measures are needed. The health of
rice is the main factor that influences productivity. Diseases of rice leaves include various fungal pathogenic
diseases such as rice blast, brown spots, and leaf blight. It is difficult to identify the type of rice leaf disease.
This study discusses a digital image processing model for classifying rice leaf disease use leaf image
features. Experiments conducted in this study used three types of rice leaf diseases, namely rice blast, brown
spots, and leaf blight. The k-Nearest Neighbour algorithm was used as the primary technique to classify the
image based on its features such as features of shapes, patterns, and feature colors. The results of the
experiment showed that the average accuracy performance was 77% for the precision and recall was 74%.
1 INTRODUCTION
Rice attributes are the essential food for most of the
world's population (Kim, Lee, & Jang, 2011)
especially for 144 countries from all continents were
more than 90% of rice is produced and consumed in
Asia (The Food and Agriculture Organization,
2000).
Constraints in increasing rice production are
increasingly complex because they are also
influenced by various changes and developments in
the strategic environment besides the agricultural
sector (Hasil Sembiring, 2015). The phenomenon of
degradation of fertility and disease in rice plants is
one of the causes of the difficulty of increasing food
productivity in addition to shrinking rice fields and
conversion of rice fields to non-agricultural
purposes. Factors that can cause a reduction in the
quality and quantity of agricultural products include
disease attacks on rice plants (Zahrah, Saptono, &
Suryani, 2016).
Because rice leaves have a broad cross-section
compared to other parts, resulting in changes in
color and shape can be seen more clearly, then the
leaves can be used as an initial step to detect disease
in rice (Zahrah et al., 2016). Generally, rice leaves
are often influenced by several diseases, including
blast, brown spot disease, and blight (Farhana
Tazmim Pinki, Nipa Khatun, 2017). Plants that are
infected with these fungal pathogenic diseases will
experience a decrease in the quality of rice produced
by these plants, dry plants, puso, and even death,
making farmers fail crops and losers. Furthermore,
increasing rice productivity and food security will be
more challenging to achieve. However, if symptoms
of rice disease can be detected early, appropriate
measures can be taken to control it. From the shape
of the spots, color, and also texture become
parameters (Dewi & Anjarwati, 2009) in the
introduction of the type of rice leaf disease. This
study discusses a digital image processing model for
classifying rice leaf disease use leaf image features.
The k-Nearest Neighbour algorithm was used as the
primary technique to classify the image based on its
features, such as features of shapes, patterns, and
feature colors.
2 RELATED WORK
The proposed method of Phadikar et al (Phadikar &
Goswami, 2016) the acquisition image is calculated
using the Normalized Difference Vegetation Index
(NDVI), Green Normalized Difference Vegetation
160
Adiyarta, K., Zonyfar, C. and Fatimah, T.
Identification of Rice Leaf Disease based on Rice Leaf Image Features using the k-Nearest Neighbour (k-NN) Technique.
DOI: 10.5220/0008931101600165
In Proceedings of the 1st International Conference on IT, Communication and Technology for Better Life (ICT4BL 2019), pages 160-165
ISBN: 978-989-758-429-9
Copyright
c
2020 by SCITEPRESS – Science and Technology Publications, Lda. All rights reserved
Index (GNDVI), Enhanced Vegetation Indices
(EVI), Soil Adjusted Vegetation Index (SAVI) and
determine the best vegetation indices to be
segmented with the Otsu method and then classified.
Research on the introduction of rice leaf disease was
carried out (Mutalib et al., 2017) using
morphological operations, the method of canny
edges and BPNN Classifications (Back-propagation
Neural Network). (Suresha M and Shreekanth K N,
2017) Achieved 76.59% accuracy in recognizing
rice leaf blast and brown spots. From the RGB
image that was acquired through a digital camera, it
was then converted to HSV color model before
being segmented by the otsu method. Furthermore,
the extraction of geometrical features (minor axis
length, primary axis length, perimeter) were
classified by the k-nearest neighbor technique.
Pinki et al. 2017, (Farhana Tazmim Pinki, Nipa
Khatun, 2017) propose the image of diseased rice
leaves to be segmented with k-means clustering.
Then use the support vector machine to do the
classification process. On (YAO et al., 2017)
propose 3 (three) layer models, namely a
combination of HOG feature and Boost Classifier
then Gabor and LBP feature in the second layer and
on the third layer do the HOG feature and SVM
Classifications methods. Research (Mutalib et al.,
2017) utilizes morphological operations and canny
methods before classifying using backpropagation
neural networks. The input used comes from the
RGB image that is changed into the LAB color
space. Component a and component b are taken
from the previous color descriptor through the stages
of segmentation. (Suresha M and Shreekanth K N,
2017) Achieved 76.59% accuracy in recognizing
rice leaf blast and brown spots. From the RGB
image that was acquired through a digital camera,
then it was converted to HSV color model before
being segmented with the otsu method. Furthermore,
the extraction of geometrical features (minor axis
length, primary axis length, perimeter) were
classified by the k-Nearest Neighbor technique.
3. THE PROPOSED APPROACH
STEP- BY-STEP DETAILS
The subjects in this study were making a model
classify the types of rice leaf diseases by utilizing
digital image processing. The model for the
introduction of rice leaf disease proposed using the
k-Nearest Neighbour classification technique, which
was carried out in several stages. The first stage is
the initial processing stage (pre-processing) which
aims to prepare the image before it is processed; in
this stage, image quality improvement and noise
removal are carried out. The RGB images are
converted into color space of l x a x b because they
can represent colors better. (Mendoza, Dejmek, &
Aguilera, 2006; Tazmim Pinki, Nipa Khatun, 2017;
Prakash, Saraswathy, 2017).
The experiments were conducted used several
images of diseased rice leaves obtained from
previous studies conducted by Farhana Tazmim
Pinki et al., 2017. Table 1 describes the number of
data sets used.
Table 1: Amount of data image used
Type of image Amount of data
Training Image
1 Leaf Blight 24
2 leaf blast 34
3 brown spots 31
Testing Image
1 Leaf Blight 12
2 leaf blast 15
3 brown spots 11
In our approach, we proposed with RGB images
and converted into grey space. Next, it is segmented
with a threshold technique so that the cluster region
of interest is separated and extracted using its image
features. Finally, the k-Nearest Neighbour
classification method is used to identify its class
(Prakash, Saraswathy, 2017). The proposed method
of introducing rice leaf disease, input image data
will go through the pre-processing and segmentation
stages at the beginning, then the region of interest
(ROI) extracted images utilize color features, texture
features, and form features.
Noise is the result could occur in the image
acquisition process or during electronic
transmission. This noise can change the original
pixel values that affect the intensity of real images
(Mishra, Lambert, & Nema, 2017). So that at this
stage the process is carried out: Histogram
equalization, Wiener filter, Median filtering,
Unsharp mask filtering, Decorrelation stretch
(Mishra et al., 2017), (Phadikar & Goswami, 2016),
(Farhana Tazmim Pinki, Nipa Khatun, 2017),
(Singh, 2015). The next stage after the image is
scratched manually, then the quality of the image is
improved, such as eliminating noise (noise),
increasing contrast use the following framework:
1 INPUT: Q ← Image
2 OUTPUT: Q ← Segmentation Result
3 BEGIN
Identification of Rice Leaf Disease based on Rice Leaf Image Features using the k-Nearest Neighbour (k-NN) Technique
161
4 Histogram Equalization
5 b = total pixel image
6 I = 1
7 IF I <= b
8 I++
9 ELSE
10 ← Convert RGB to GRAY
11 END IF
12 ← Wiener filter (5x5)
13 ← Median filtering (5x5)
14 ← Unsharp mask filtering
15 ← Decorrelation stretch
16 RETURN Q
17 END OF BEGIN
(a) (b)
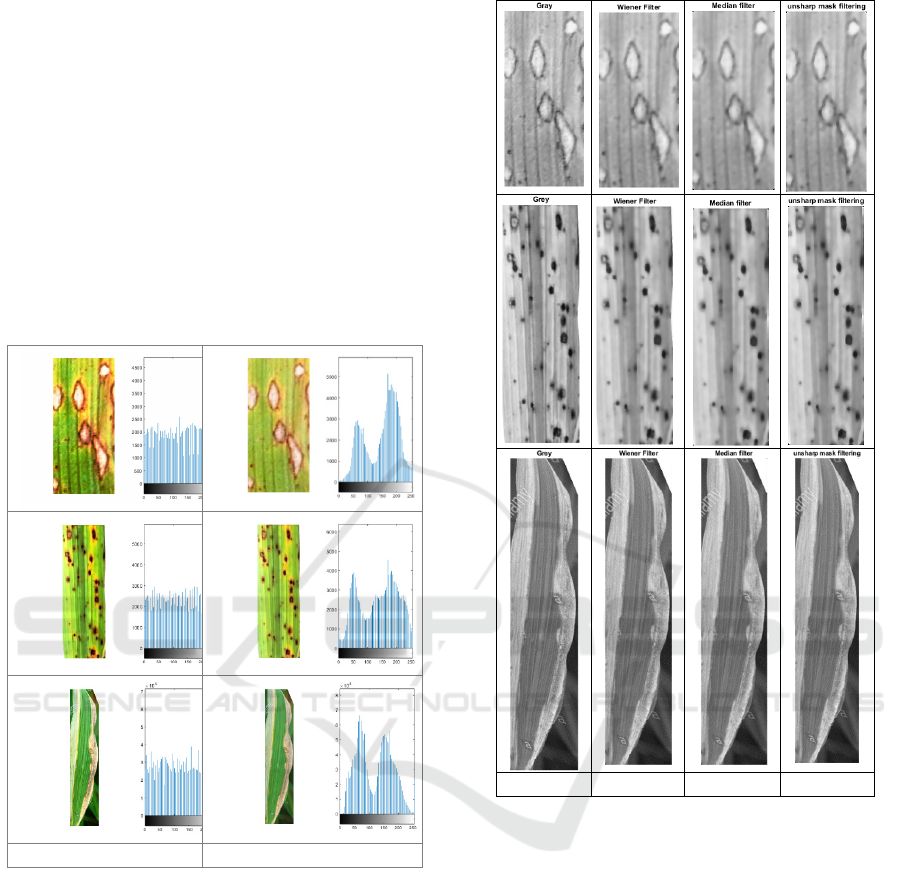
Figure 1: histogram equalization image of diseased rice
leaves. a) input image, b) output image enhancement
histogram equalization process Substructure 2 against Z
One method used in this pre-processing stage is
histogram equalization. The histogram of the data is
modified to improve image quality. Histogram
alignment changes the distribution of grey degree
values on the data to be uniform so that each grey
degree will have a relatively equal total of pixels.
Figure 1 shows the result of histogram equalization.
Figure 2 shows the enhancement processing image
of diseased rice leaves: gray color image, Wiener
filter, Median filtering, unsharp mask, and
Decorrelation stretch filtering.
(a) (b) (c) (d)
Figure 2: enhancement processing image of diseased rice
leaves. a) gray color image, b) Wiener filter, c) Median
filtering, d) unsharp mask, e) Decorrelation stretch
filtering
In other words, the more dominant green color
will be eliminated, and this has succeeded in image
data in the form of diseased images of paddy leaves.
As an improvement to further research,
segmentation can be done by dividing the pixels of
the image data into several groups so that each group
can represent each class, such as using the k means
clustering algorithm. So that the ROI (regions of
interest) will be identified as in a particular cluster.
Segmentation results from complete image data can
be seen in figure 3.
ICT4BL 2019 - International Conference on IT, Communication and Technology for Better Life
162
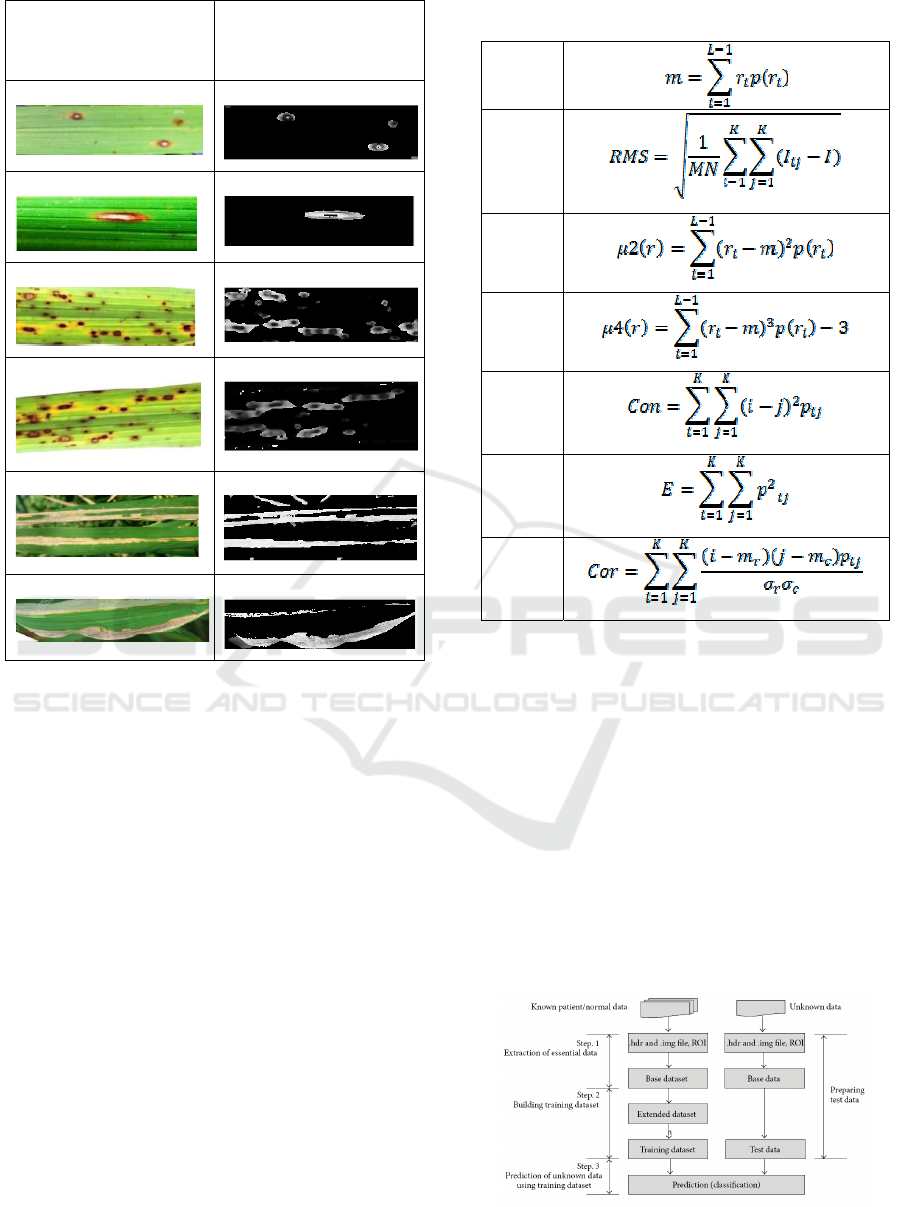
IMAGE SEGMENTATION
RESULT
Figure 2: Segmentation results from complete image
data
The extraction value used as data for the
classification process comes from 11 features
consisting of area, RMS, mean, kurtosis, skewness,
standard deviation, energy, entropy, contrast,
correlation, homogeneity. Six of the features used to
utilize the GLCM algorithm (gray level co-occurrent
matrix). Table 2 defines those features. These
features are derived from feature pattern, color
feature, feature shape as visual content-based
because of the features that represent most of the
human vision. Extraction approach with color
features is one feature that can represent images.
Utilizing color moments, namely mean, skewness,
RMS, variance, standard deviation, kurtosis to
produce color distribution (Athanikar & Badar,
2016). Extracted features consist of Contrast,
Energy, Entropy, and Correlation, while form
features take advantage of area values.
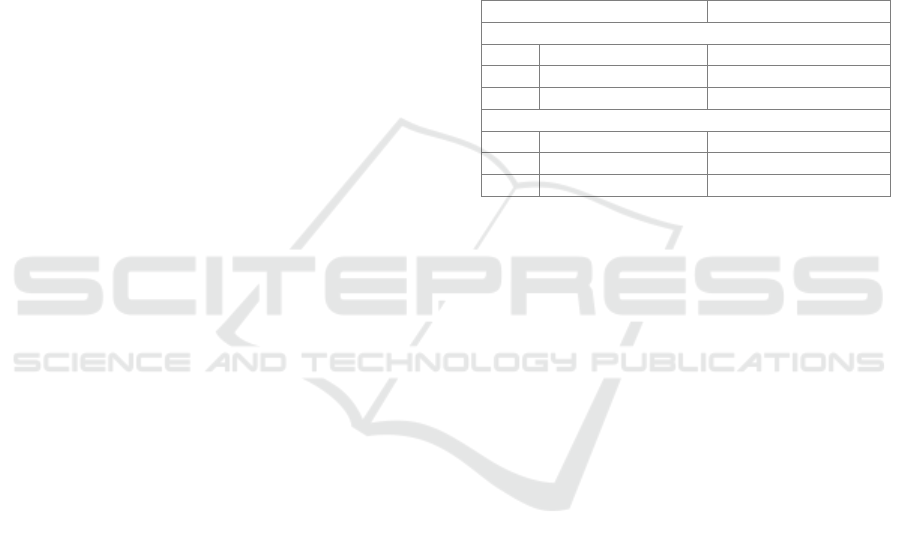
Table 2: extraction value used in the experiment
Mean
RMS
Variance
Kurtosis
Kontras
Energi
Korelasi
The classification technique used in recognizing
types of the blast, brown patch, and blight is a K-
Nearest Neighbor (Krithika & Grace Selvarani,
2018), (Tay, Hyun, & Oh, 2014)
1 Classify (X, Y, x)
2 // X = Train Dataset
3 // Y = Class Label
4 // x = Prediction
5 FOR i = 1 to m DO
6 Compute distance d (X ᵢ, x)
7 END FOR
8 Compute set I containing indices for the k
smallest distances d (Xᵢ, x)
9 RETURN majority label {Y
ͥ
ᵢ where I ϵ I}
Figure 3: Classification Process
Identification of Rice Leaf Disease based on Rice Leaf Image Features using the k-Nearest Neighbour (k-NN) Technique
163
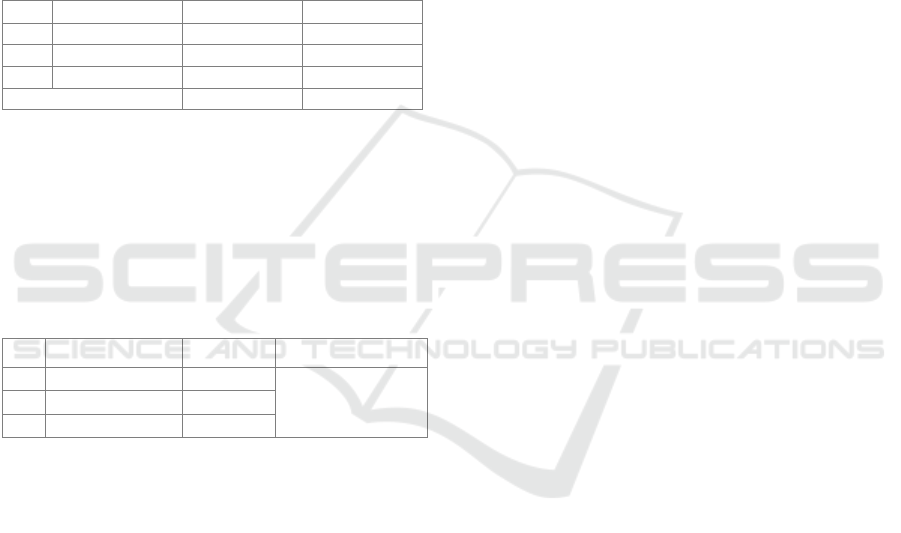
The framework of our classification process is
illustrated in figure 3.
4 RESULT AND DISCUSSION
Labeling is used in each type of rice leaf disease:
Rice Blast, Brown Spots, and Leaf Blight. In the
evaluation process to the proposed system model in
a multiclass configuration matrix, we obtained the
performance of precision and recall are mentioned in
table 3. Figure 4 shows the average performance
accuracy obtained from the overall experiment.
Table 3: Evaluation Result
No
Class Label Precision Recall
1 Rice Blast 72.72 % 66,6 %
2 Brown Spots 75 % 90 %
3 Leaf Blight 83,3 % 66 %
Average 77% 74%
The results obtained from this research have
reached above seventy percent where in previous
studies with different methods have achieved
excellent results, 73.1% by (YAO et al., 2017),
76.59% of the results of Suresha et al ( Suresha M
and Shreekanth KN, 2017) and 70-80% accuracy
achieved by mutalib et al (Mutalib et al., 2017)
Table 4: Average performance accuracy
No Desease Accuracy Performance
1 Rice Blast 75 %
76,59 %
2 Brown Spots 72 %
3 Leaf Blight 83 %
5 CONCLUSION
This study intends to develop a system for automatic
recognition of rice leaf disease with digital image
processing. By utilizing image feature extraction and
the k-Nearest neighbor classification technique
Experiments that have performed the performance of
identification of rice leaf disease resulted in a
performance of 76.59%. This accuracy is
comparable to the research conducted by Suresha et
al. (Suresha M and Shreekanth K N, 2017) which
utilizes k-NN's shape features and techniques to
classify two (2) types of rice disease, blast, and
brown spots, its accuracy is 76.59%. However, this
research was conducted to classify three (3) types of
rice leaf disease, namely blast disease, brown spots,
and blight.
REFERENCES
Asfarian, A., Herdiyeni, Y., Rauf, A., & Mutaqin, K. H.
(2013). Paddy diseases identification with texture
analysis using fractal descriptors based on Fourier
spectrum. Proceeding - 2013 International Conference
on Computer, Control, Informatics and Its
Applications: "Recent Challenges in Computer,
Control, and Informatics", IC3INA 2013, (March
2014), 77–81.
https://doi.org/10.1109/IC3INA.2013.6819152
Athanikar, G., & Badar, M. P. (2016). Potato Leaf
Diseases Detection and Classification System, 5(2),
76–88.
Dewi, C., & Anjarwati, E. F. (2009). Implementasi Citra
Digital Untuk Identifikasi Penyakit Pada Daun Padi
Menggunakan Anfis.
Farhana Tazmim Pinki, Nipa Khatun, S. . M. I. (2017).
Content based Paddy Leaf Disease Recognition and
Remedy Prediction using Support Vector Machine,
22–24. https://doi.org/DOI:
10.1109/ICCITECHN.2017.8281764
Fristy Rebecca Hasianta Sitohang, Luthfi Aziz Mahmud
Siregar, L. A. P. P. (2015). Current Structure and
Spatial Variation of Indonesian Throughflow in
Makassar Strait Under Ewin 2013 (Struktur Arus dan
Variasi Spasial Arlindo di Selat Makassar dari Ewin
2013). In ILMU KELAUTAN: Indonesian Journal of
Marine Sciences (Vol. 20, p. 87).
Hasil Sembiring. (2015). Laporan Kinerja Direktorat
jenderal Tanaman pangan tahun 2015, 50(6), 627–640.
Kim, J. O., Lee, S. H., & Jang, K. S. (2011). Efforts to
improve biodiversity in paddy field ecosystem of
South Korea. Reintroduction, 1, 25–30.
https://doi.org/https://doi/org/10.7454/mss.v15i1.885
Krithika, N., & Grace Selvarani, A. (2018). An individual
grape leaf disease identification using leaf skeletons
and KNN classification. Proceedings of 2017
International Conference on Innovations in
Information, Embedded and Communication Systems,
ICIIECS 2017, 2018–Janua, 1–5.
https://doi.org/10.1109/ICIIECS.2017.8275951
Mendoza, F., Dejmek, P., & Aguilera, J. M. (2006).
Calibrated color measurements of agricultural foods
using image analysis. Postharvest Biology and
Technology, 41(3), 285–295. https://doi.org/DOI:
10.1016/j.postharvbio.2006.04.004
Mishra, B., Lambert, M., & Nema, S. (2017). Recent
Technologies of Leaf Disease Detection using Image
Processing Approach – A Review. https://doi.org/DOI:
10.1109/ICIIECS.2017.8275901
Mutalib, S., Abdullah, M. H., Abdul-Rahman, S., & Aziz,
Z. A. (2017). A brief study on paddy applications with
image processing and proposed architecture.
Proceedings - 2016 IEEE Conference on Systems,
Process and Control, ICSPC 2016, (December), 124–
129. https://doi.org/10.1109/SPC.2016.7920716
Phadikar, S., & Goswami, J. (2016). Vegetation indices
based segmentation for automatic classification of
brown spot and blast diseases of rice. 2016 3rd
ICT4BL 2019 - International Conference on IT, Communication and Technology for Better Life
164

International Conference on Recent Advances in
Information Technology, RAIT 2016, 284–289.
https://doi.org/10.1109/RAIT.2016.7507917
Prakash, Saraswathy, R. (2017). Detection of Leaf
Diseases and Classification using Digital Image
Processing. https://doi.org/DOI:
10.1109/ICIIECS.2017.8275915
Singh, A. (2015). Automated Color Prediction of Paddy
Crop Leaf using Image Processing, (Tiar), 24–32.
https://doi.org/10.1109/TIAR.2015.7358526
Suresha M and Shreekanth K N, T. B. V. (2017).
Classifier, 663–666.
Tay, B., Hyun, J. K., & Oh, S. (2014). A machine learning
approach for specification of spinal cord injuries using
fractional anisotropy values obtained from diffusion
tensor images. Computational and Mathematical
Methods in Medicine, 2014(March).
https://doi.org/10.1155/2014/276589
The Food and Agriculture Organization. (2000). Bridging
the Rice Yield Gap in the Asia-Pacific Region.
Utami, D. W., Barnita, K., Yuriah, S., & Hanarida, I.
(2011). Nucleotide Base Variation of Blast Disease
Resistance Gene Pi33 in Rice Selected Broad Genetic
Background. HAYATI Journal of Biosciences, 18(3),
123–128. https://doi.org/10.4308/hjb.18.3.123
Wahyudi, A. T., Meliah, S., & Nawangsih, A. (2011).
Xanthomonas oryzae pv. oryzae BAKTERI
PENYEBAB HAWAR DAUN PADA PADI:
ISOLASI, KARAKTERISASI, DAN TELAAH
MUTAGENESIS DENGAN TRANSPOSON.
Makara, Sains, 15(1), 89–96.
https://doi.org/10.1002/ibd.21874
YAO, Q., CHEN, G. te, WANG, Z., ZHANG, C., YANG,
B. jun, & TANG, J. (2017). Automated detection and
identification of white-backed planthoppers in paddy
fields using image processing. Journal of Integrative
Agriculture, 16(7), 1547–1557.
https://doi.org/https://doi.org/10.1016/S2095-
3119(16)61497-1
Zahrah, S., Saptono, R., & Suryani, E. (2016). Identifikasi
Gejala Penyakit Padi Menggunakan Operasi
Morfologi Citra. Snik, (October 2016), 100–106.
Identification of Rice Leaf Disease based on Rice Leaf Image Features using the k-Nearest Neighbour (k-NN) Technique
165
