
Design and Simulation of Vehicle Cab Noise Reduction based on
Symplectic Geometry Method
Ziyu Zheng
1, a
1
Shenzhen Senior High School, China
Keywords: Symplectic Geometry; Automobile Cab; Acoustics; Noise Reduction.
Abstract: The noise caused by the vibration of the car body will reduce the comfort of the car. In order to reduce the
indoor noise, through the experimental modal analysis of the cab, the change of natural frequency and basic
mode of vibration is obtained. It is found that when the frequency is 120.44 Hz, the cab noise has the
greatest impact. Through symplectic geometric analysis and panel acoustic contribution analysis, it is found
that the cab panel has the greatest influence on the sound pressure near the ear of the roof driver. In order to
solve the above problems, the noise reduction method of the cab roof using stiffened panels and the sound
radiation theory is used to simulate the noise reduction effect of the improved cab. It is found that the sound
pressure of the improved cab is significantly reduced, the low-frequency noise is effectively suppressed, and
the comfort of the car is improved.
1 INTRODUCTION
With the increasing demand for car ride comfort,
more and more attention has been paid to the impact
of body panel vibration on the human body. The
research on the vibration level of cab panel has
penetrated into the whole vehicle development
process, so it is important to analyze and control cab
vibration and noise. From 1966 GLADWELL et al.
(G ML Gladwell, G Zimmermann, 1966) for the first
time, the finite element technology has been applied
to the field of acoustics. Today, the finite element
technology has been more and more applied to the
prediction and analysis of low-frequency structural
vibration and noise. In recent years, scholars at
home and abroad have made a lot of efforts in
perfecting and applying the finite element boundary
element technology in vehicle vibration and noise.
So far, the basic research method of reducing
vibration and noise of automobile cab is to use three-
dimensional software to model and then use finite
element software to calculate theoretical modal and
compare with experimental modal. Finally, it is
imported into the acoustic software for acoustic
analysis. This method is more complex, and the
software interface is a difficult problem. In this
paper, the natural frequencies and modes of cab
vibration are obtained directly through modal test
analysis. Based on the thin plate theory, the
symplectic geometry method of Hamilton system is
used to calculate the natural frequencies of cab
vibration accurately. Compared with the frequencies
obtained from the test analysis, the more influential
panels are analyzed, and the acoustic analysis is
carried out directly in the acoustic software, and the
noise reduction measures are put forward, so as to
improve the cab structure design.
2 MODAL TEST ANALYSIS OF
AUTOMOBILE CAB
The modal test is an effective method for identifying
the dynamic characteristics of engineering structures
by experimental methods (Shilei, 2012). Its main
task is to measure the input and output signals of the
system at the same time and to process them
digitally, so as to estimate the frequency response
function or impulse response function of the system
under test, so as to provide an accurate and reliable
basis for modal analysis. The single-point excitation
analysis method is mainly used in the cab modal test
of this automobile. The single-point excitation
modal vibration testing system is mainly composed
of three parts: excitation part (including signal
generator, power amplifier and exciter), sensing part
102
Zheng, Z.
Design and Simulation of Vehicle Cab Noise Reduction based on Symplectic Geometry Method.
DOI: 10.5220/0008870401020107
In Proceedings of 5th International Conference on Vehicle, Mechanical and Electrical Engineering (ICVMEE 2019), pages 102-107
ISBN: 978-989-758-412-1
Copyright
c
2020 by SCITEPRESS – Science and Technology Publications, Lda. All rights reserved
(including sensor and adjustable amplifier and
related connections) and analysis part (including
analysis system and peripheral equipment such as
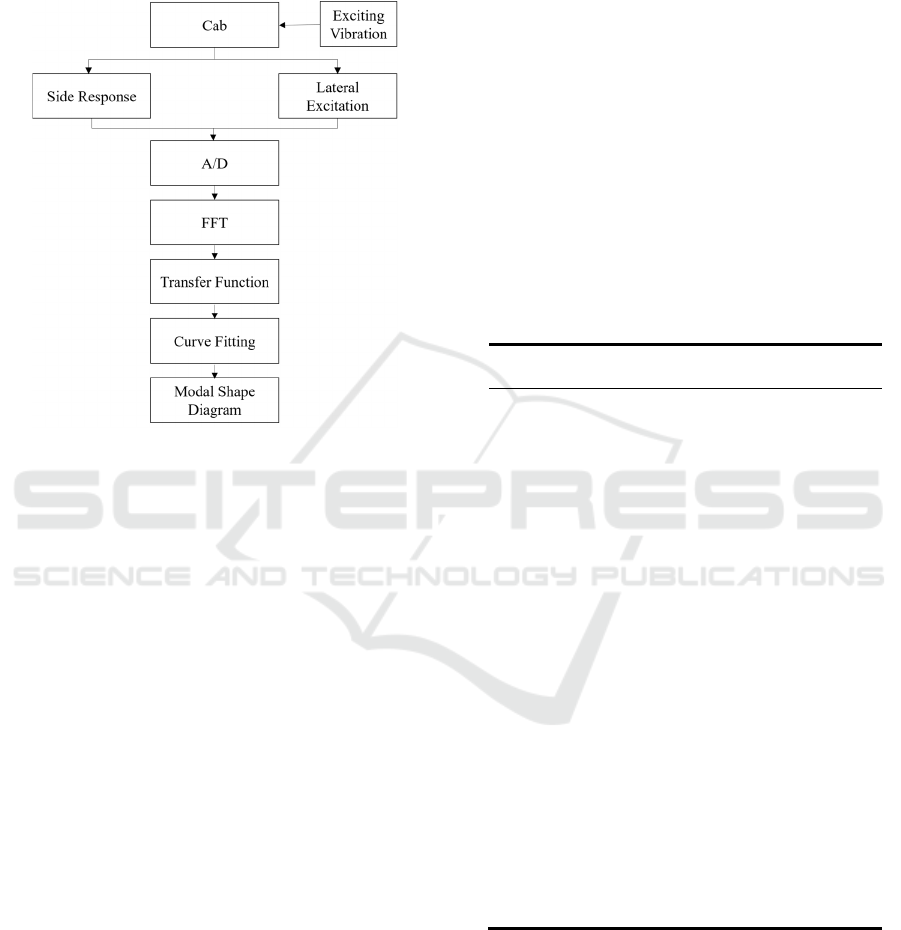
plotter and printer) (Fu Zhifang, 1990). The block
diagram of the test system is shown in Figure 1.
Fig 1. Block diagram of test system.
When the modal test is carried out, the exciting
force is generated by the exciting equipment, which
causes cab vibration. Then the force signal and the
response signal measured by the acceleration sensor
mounted on the cab are amplified and transmitted to
the structural dynamic analyzer for FFT analysis,
and the frequency response function is obtained. The
average frequency response function is obtained by
fitting the whole frequency response function, and
then the modal parameters are identified, from
which the experimental modal parameters are
obtained. The first ten vibration modes and mode
characteristics of the cab are calculated by the
software, as shown in Table 1.
From the test data measured in Table 1, it can be
seen that the frequency of the cab roof vibration is
relatively frequent, and the left and right panels and
the rear panels also have local vibration. Therefore,
it is preliminarily determined that roof vibration is
the main cause of the noise. From the modal
analysis, it can be seen that the roof vibration is the
largest when the modal frequency is the seventh
order of 120.44Hz. The mode shapes of the cab are
shown in Fig. 2, which show the obvious vertical
vibration of the cab roof, accompanied by the overall
rotation of the cab around the Z axis. If we want to
improve the interior noise of the cab, the most
effective way is to reduce the vibration response of
the roof.
3 SYMPLECTIC GEOMETRY
METHOD FOR ANALYZING
ROOF NATURAL FREQUENCY
The model of the cab is shown in Figure 3. The cab
is considered to consist of 10 thin-walled panels of
different sizes. Cab roof vibration is the largest, so it
is taken as the research object. Because the cab is
fixed on the surrounding panel by welding and
screw connection, the panel is set as a rectangular
thin plate, the boundary condition of the four sides is
adopted, and the structure is set as full restraint.
Table 1. The first ten modes and modal characteristics of
cab structure measured.
Modal
order
Natural
Frequency(Hz)
Modal mode
characteristics
1 21.186
Slight vibration of
roof
2 29.325
Local Vibration of
Rear Wall Plate
3 37.508
Roof Vibration,
Transverse Local
Vibration of Left Wall
4 66.085
Local Vibration of
Rear and Right
Wallboard
5 75.341
Roof Vibration, Right
Wall Transverse
Local Vibration
6 113.534
Roof Vibration, Local
Vibration of Left and
Right Wallboard
7 120.44
Vertical vibration of
roof
8 167.055
Vertical vibration of
roof and torsional
vibration of back wall
9 183.892
Vibration of rear
panel and left and
right panel
10 195.45
Left and right lateral
vibration
Design and Simulation of Vehicle Cab Noise Reduction based on Symplectic Geometry Method
103

Fig 2. The seventh mode shapes of the cab.
Figure 3. Cab structure.
The basic equation of free vibration for the cab
roof is established:
0(1)
Where W is the mode function of the roof; D is
the flexural strength; is the mass of the unit area of
the roof; is the natural frequency of the roof.
The relationship between roof bending moment
and torsion is as follows:
0
0
0
(2)
Where,
,
and
are the bending moment
of the roof,
and
are the torsion of the roof,
and
and
are the shear force and total shear
force. After analysis and transformation, the
relationship among the parameters can be expressed
by Hamilton equation (Zhong Yang, Li Rui, Tian
Bin, 2011), which can be written in the form of
matrix:
(3)
Where, F=
01
/
0
, G=
01
01/
,
Q=
0
02(1)
/
, Z is
the state vector of a thin plate.
The symplectic geometry method is used to
analyse the vibration mode function. The formula
(3) is solved by the method of separating variables.
The solutions of the vibration mode function in the
X and Y directions are as follows:
cos
sin
cosh
sinh
cos
sin
cosh
2
sinh
2
(4)
Where,
,
,
,
,
,
,
and
are
undetermined constants.
The boundary conditions in the X and Y
directions of the clamped thin plates are as follows:
∣
∣
0
∣
∣
0
(5)
The partial derivative substitution formula (5) of
equation (4) is obtained, and the equation about
coefficient is obtained. The determinant of
coefficient matrix is zero. The eigenvalue
transcendental equation about X and Y axisymmetry
is obtained as follows:
R
tan
R
R
tanh
R
0
tan
2R
tanh
2R
0
(6)
The values of R and can be obtained from
equation (6). From R= ω
/
, the frequency of
rectangular thin plate with four edges fixed can be
further obtained.
The sound pressure on the roof surface can be
expressed by Helmholtz integral equation (Yang
Xiaowei, et al, 2009):
p
R
(7)
Among them, p is the sound pressure of the
structure surface, is the normal velocity of the
structure surface, r=
|
|
is the distance between
ICVMEE 2019 - 5th International Conference on Vehicle, Mechanical and Electrical Engineering
104

two points on the structure surface, and S is the
surface of the vibration structure.
The elastic modulus of the cab panel is 206 GPa,
Poisson's ratio is 0.3, the strength limit is 450 MPa,
the thickness of the thin panel is 7850 kg/m3, the
thickness is 5 mm, the length and width of the roof
are 2510 mm and 1263 mm, respectively. By
substituting the parameters of cab panel (6), the
natural frequency of the roof can be calculated to be
121.42Hz, which is basically consistent with the
model test value. Thus, it can be judged that the
analytical solution of the symplectic geometry
method is correct and applicable.
4 CAB ACOUSTIC
CHARACTERISTIC
CALCULATION
The acoustic characteristics of the cab are analyzed
in the acoustic software, and the sound pressure
level curve near the driver's ear is obtained, as
shown in Figure 4. It can be seen from the curve that
the peak sound pressure appears at frequencies of 18
Hz, 40 Hz, 64 Hz, 70 Hz, 114 Hz, 120 Hz, 129 Hz,
170 Hz, 180 Hz and 195 Hz. The results are
basically consistent with the frequencies of cab
modal test analysis. Further modal participation
factor analysis is carried out for the cab (Li
Zenggang, 2005). The so-called modal participation
factor refers to the degree to which each order of
modal participates in the dynamic response of the
structure when the modal superposition method is
used to calculate the dynamic response. From the
analysis of the partially modal participation factor
curve shown in Fig. 5, it can be seen. At frequencies
of 47 Hz, 120 Hz and 195Hz, the effects of the last
five frequencies on the sound pressure near the
driver's ear are greater than those of the first five
frequencies. The modal participation factor
corresponding to the seventh order is always at the
maximum, and its corresponding frequency is 120
Hz, which coincides with the natural frequency
value of the roof vibration analyzed above.
Therefore, it can be accurately judged that roof
vibration is the main source of cab noise.
Fig 4. The curve of sound pressure level near the driver's
ear.
5 CAB SIMULATION ANALYSIS
AND IMPROVEMENT
According to the above analysis, the cab structure is
improved and designed. Because the vibration of
roof is the main cause of the noise, the structural
improvement of roof is mainly carried out in the
redesign, mainly through the following two ways:
first, the surface of cab panel is damped to reduce
the indoor noise; second, the structure improvement
of cab panel is carried out. To improve its stiffness
and reduce the interior noise. Because the vehicle
belongs to the engineering field, the strength of the
cab is required to be high (Chen Shuming, et al,
2012). Considering the economic point of view and
practical aspects, this paper adopts the method of
improving the stiffness of the cab roof to reduce
vibration and noise.
(a) Modal Participation Factor Curve at 47Hz
Design and Simulation of Vehicle Cab Noise Reduction based on Symplectic Geometry Method
105
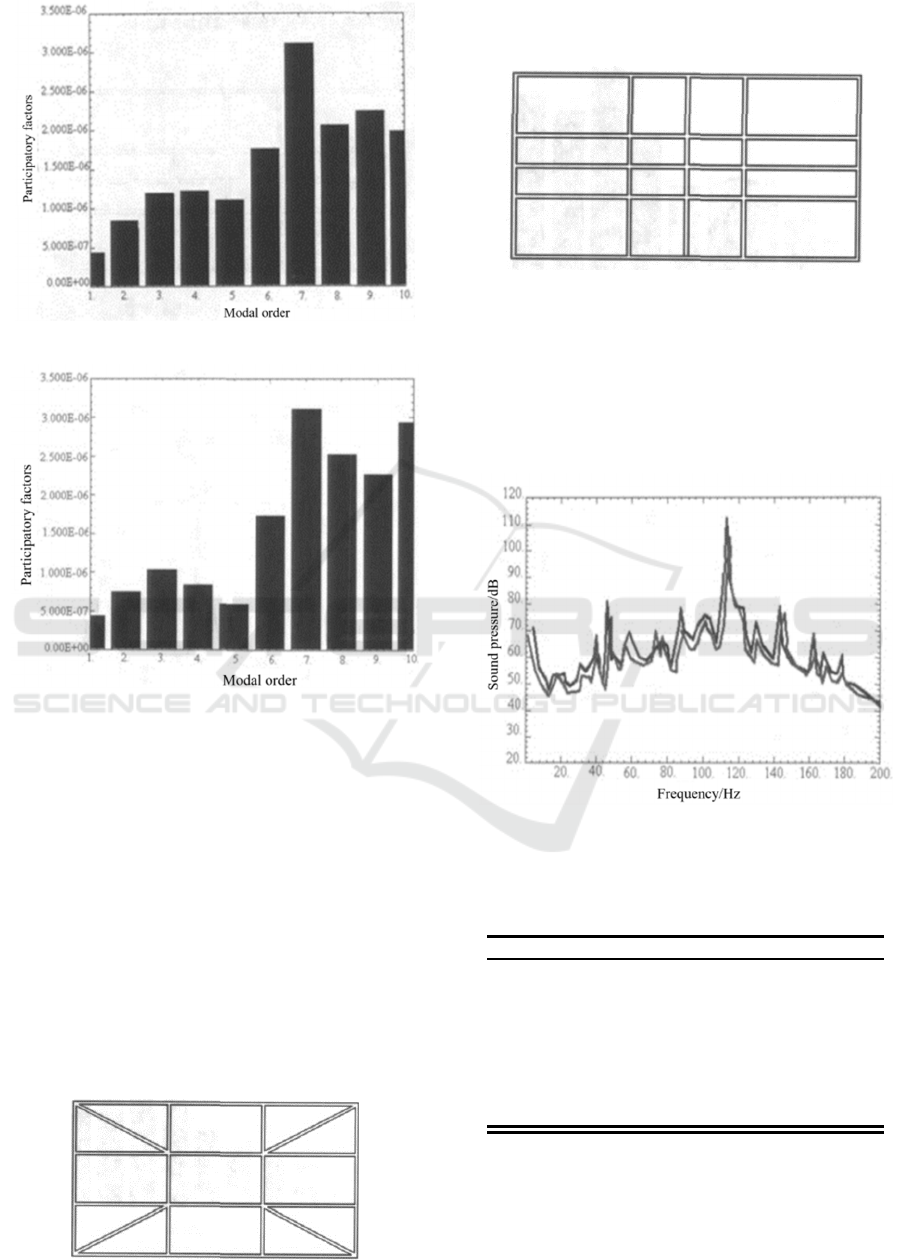
(b) Modal Participation Factor Curve at 120Hz
(c) Modal Participation Factor Curve at 195Hz
Fig 5. Modal Participation Factor Curve.
There are two ways to improve the stiffness of
the cab panel. The first is to increase the thickness of
the wallboard; the second is to reinforce the
wallboard (Wang Xianyi, et al, 2008). Thickening of
cab roof will increase the dead weight of cab, and
the material is not fully utilized. Reinforcement of
roof under certain conditions can increase the dead
weight of cab roofless and improve the performance.
In this paper, two kinds of reinforcement methods
are compared. One is the four corner reinforcement
of the roof, as shown in Figure 6, and the other is the
reinforcement through the center of the roof, as
shown in Figure 7.
Fig 6. Cross-sectional diagrams of four corner stiffeners
on the roof.
Fig 7. Cross-sectional diagrams of stiffened roof through
the center of roof.
Acoustic analysis is carried out for the two kinds
of reinforcement arrangement. The sound pressure
level curve is shown in Fig. 8. The calculation
results of sound pressure near the driver's ear are
shown in Table 2.
Figure 8. Sound pressure curves using stiffened panels for
noise reduction.
Table 2. Comparison of driver's ear sound pressure before
and after reinforcement.
Modal order 1 2 3 4 5
No
reinforcement
/dB
53.2 54.1 58.9 72.3 61.8
Corner
stiffening /dB
51.3 52.7 55.5 68.6 58.0
Central
reinforcement
/dB
49.8 51.4 53.2 60.2 53.9
Modal order 6 7 8 9 10
No
reinforcement
/dB
75.3 118.7 55.6 59.2 48.9
Corner
stiffening /dB
70.4 114.8 52.7 55.1 48.2
ICVMEE 2019 - 5th International Conference on Vehicle, Mechanical and Electrical Engineering
106

Central
reinforcement
/dB
73.1 108.4 51.9 50.4 49.1
The black line and the gray line in Figure 8 show
the sound pressure curves of the cab roof reinforced
by four corner stiffeners and through the center
stiffeners, respectively. It can be seen from the curve
that the sound pressure of cab roof decreases after
stiffening, and the noise reduction effect of stiffeners
applied through the center of the roof is better than
that of four corner stiffeners. For the measurement
of sound pressure, 387 nodes near the center of the
cab roof are selected as the test points. The peak
value of the sound pressure curve is basically
consistent with the fixed frequency value measured
in front. The maximum value appears at 120 Hz,
which is consistent with the maximum vibration of
the roof analyzed in front when the natural
frequency is 120.44 Hz. The sound pressure value
decreases from 118.7 dB to 114.8 dB by applying
ribs at the edge corners, while the sound pressure
value decreases to 108.4 dB by applying ribs
through the center of the roof, and the decrease of
sound pressure in the latter arrangement is greater
than that in the former arrangement at other peak
points. This is because the sound pressure is
gradually divergent from the central part of the roof.
Therefore, the cab roof is eventually laid out through
the center of the roof with reinforcement bars. By
improving the cab roof design, the cab's internal
noise has been significantly reduced, which not only
improves the comfort of passengers but also
improves the driver's response ability, so that the car
can be better applied.
6 CONCLUSIONS
In this paper, the cab of an engineering vehicle is
taken as the research object, and the natural
frequency and mode of cab vibration are
preliminarily determined by means of the
experimental modal analysis method. It is concluded
that the vibration of the cab roof is the main cause of
indoor noise. The symplectic geometry method of
Hamilton system is used to analyze the natural
frequency of cab noise, which is consistent with the
experimental data. It provides a theoretical basis for
the future study of vehicle interior vibration. In the
application process, the frequency value can be
resolved by directly substituting the relevant data of
the research object into the formula, without
modeling and calculation, which saves time and
improves work efficiency. The acoustic
characteristics of the cab are analyzed, and the
method of panel contribution is used to further prove
that the roof vibration contributes the most to the
indoor noise. The sound pressure near the driver's
ear is calculated, and the seventh mode has the
greatest influence. Two methods are put forward to
improve the cab structure. The noise level near the
driver's ear is obviously reduced by stiffening
through the center of the roof, which effectively
reduces the noise in the cab as a whole.
REFERENCES
G ML Gladwell, G Zimmermann. On energy and
complementary energy formulations of acoustic and
structural vibration problems [J].Journal of Sound and
Vibration, 1966, (3): 233-241.
Shilei. Application of modal test analysis to solving
vehicle vibration problems [J].Automotive Science
and Technology, 2012, (5): 22-26.
Fu Zhifang. Vibration modal analysis and parameter
identification [M]. Beijing: Machinery Industry Press,
1990.
Zhong Yang, Li Rui, Tian Bin. Hamiltonian analytical
solution for free vibration of rectangular thin plates
with fixed edges [J]. Journal of Applied Mechanics,
2011, 28 (4): 323-327.
Yang Xiaowei, et al. [J].Journal of Mechanical
Engineering, 2009, 45 (8): 221-227.
Li Zenggang.SYSNOESE Rev5.6 [M]. Beijing: National
Defense Industry Press, 2005.
Chen Shuming, et al. [J].Computer simulation, 2012 (4):
287-291.
Wang Xianyi, et al. [J].Journal of Vibration Engineering,
2008, (2): 13-17.
Design and Simulation of Vehicle Cab Noise Reduction based on Symplectic Geometry Method
107
