
Making Composites from Mixing Limestone with Addition of Latex
Amir Hamzah Siregar
*
, Saharman Gea, Nora Indriani
Departement of Chemistry, Faculty of Mathematics and Natural Sciences, Universitas Sumatera Utara, Medan, Indonesia
Keywords: Latex, Limestone Powder, SEM, TGA, XRD.
Abstract: Research on mixing of limestone with the addition of latex in making composites have been done. This
study uses limestone originating from Sidikalang where crushed limestone using ball mill then calcined at
900
o
C for 2 hours then tested using XRD Pan Analytical X’pert Powder PW 30/40 to determine the
presence of CaO compounds with the greatest intensity of 3036 at θ=37.3556 and particle size tested using
PSA Shimadzu SALD-2300 is obtained an average of 731.7 nm. Then limestone powder (LSP) is used as a
filler with various variations on latex composites. Analyzing of the morphology using SEM FEI Inspect-S50
can be seen from the photo that limestone powder can be evenly distributed on compsites 800 g of latex +
200 g of limestone powder while in the next variation the limestone powder is not evenly distributed
because the addition of the filler increases but the addition of the matrix decreases. The mechanical
properties of latex composites with limestone powder were tested using ASTM D-412 where optimum
tensile strength was found in 800 g of latex + 200 g of limestone powder is 1.279 MPa and optimum
elongation of 1000 g latex is 4.328 mm/mm. Thermal properties were tested using TGA ASTM E1131
obtained by decomposition thermal at 300-400
o
C because in the sample 1000 g of latex has thermal stability
at 377.39
o
C and in the sample 800 g of latex + 200 g of limestone powder has thermal stability at 378.21
o
C.
1 INTRODUCTION
Natural latex is a substance obtained from rubber
latex (Havea Brasiliensis). Natural latex is composed
of hydrocarbons and contains small amounts of non-
rubber parts, such as fat, glycolipid, phosphorus,
proteins, and other organic materials (Kohjiya et al.,
2014).
Natural rubber is one of the important
agricultural products because it holds a role in
improving human living standards and increasing
foreign exchange. The consumption of natural
rubber and world synthetic rubber in 2004 only
reached 20.03 million tons, among them 11.5
million tons were natural rubber. However, as the
largest landowner in fact processing latex into
finished or processed goods, Indonesia is only able
to control the market 10% which is still far below
Thailand with land that is narrower than Indonesia.
Where Thailand was able to dominate the market by
29% and Malaysia by 59%. One of the factors that
caused this weakness was the high production costs
in processing rubber finished goods (Sinaga, 2015).
This is what encourages researchers to conduct
research in suppressing production costs in
processing latex by carrying out special treatment
for latex raw materials namely by adding fillers.
Indonesia as a country that is rich in natural
products has abundance in various sectors. One of
the natural resources produced is limestone with a
large CaCO
3
content (Lukman et al., 2012).
Most forms of calcium in limestone are found as
calcium carbonate (CaCO
3
). Limestone has a density
of 2.6-2.8 g/cm
3
and is pure in the form of calcite
crystals consisting of CaCO
3
. CaCO
3
content in
limestone reaches more than 90% and the rest are
other substances (Oates, 1998).
The potential for limestone production in
Indonesia is very large and almost evenly distributed
throughout Indonesia, mainly used as industrial
excavation (Shubri et al., 2014). In general, the
amount of limestone in Indonesia reached 28.678
billion tons. Statistics show that the industrial sector
for the use of limestone tends to increase at 10.45%
every year (Rumengan et al., 2017). The distribution
of limestone deposits are almost evenly distributed
throughout Indonesia, but the largest deposits are in
West Sumatra (Mukarrom, 2017).
(Keliat, 2015) Has investigated the role of
limestone addition to the mechanical properties and
Siregar, A., Gea, S. and Indriani, N.
Making Composites from Mixing Limestone with Addition of Latex.
DOI: 10.5220/0008864001650173
In Proceedings of the 1st International Conference on Chemical Science and Technology Innovation (ICOCSTI 2019), pages 165-173
ISBN: 978-989-758-415-2
Copyright
c
2020 by SCITEPRESS – Science and Technology Publications, Lda. All rights reserved
165

thermal resistance of HDPE-g-MA composites
where the results of the mechanical properties of
HDPE-g-MA composites showed that the optimum
tensile strength was 15.51 MPa and optimum
elongation was 62% while the thermal properties
using TGA on HDPE-g-MA + limestone composites
have a decomposition point by 498,42
o
C.
Saputra (2016) has investigated the research on
making composites using fillers namely black
carbon and matrix namely natural rubber which aims
to determine the tensile test properties of composites
where the addition of black carbon at 20, 25 and
30% results in an average of the highest tensile
strength occurred in the natural black carbon
composites of 20% at 1.18 MPa, at 25% at 0.91
MPa, at 30% at 0.56 MPa while at the addition of
black carbon 20, 25 and 30% yielded the average
value of natural rubber composite strain 20% black
carbon for 42.53%, at 25% at 25.19%, at 30% at
6.69%, while the addition of black carbon 20%, 25%
and 30% yielded the highest average modulus of
elasticity occurs in natural rubber composites-black
carbon at 20% at 2.21 x 10
-2
MPa, at 25% at 2.16 x
10
-2
MPa, at 30% at 1.91 x 10
-2
MPa.
Sinaga (2015) has investigated research on the
making and characterization of composite matrix
polymers where filler namely silica rice husk and
matrix, which is concentrated latex where aims to
determine the nature of mechanical tests where the
optimal composition for modulus of elasticity for
making latex-silica based composites is 0.221 MPa.
In this study we will develop composites by mixing
limestone as filler and latex as a matrix. Where in
limestone generally there is calcium carbonate
(CaCO
3
). The choice of limestone as a filler in the
manufacture of composites is based on the properties
of limestone which can improve the mechanical
properties of rubber and the amount is very abundant
in Indonesia so can reduce the emphasis on
processing rubber goods. Where the character of
limestone is plastic, it can harden quickly so that it
gives the strength of the binder, easy to do, produces
a good bond for plastering. Therefore, the
researchers hope that this research will be able to
reduce production costs in processing latex and add
value to limestone. In addition, composites can be
produced with better durability.
2 MATERIALS AND METHODS
2.1 Materials
The tools used in this study include: ball mill, 170
mesh sieve, analytical balance, mechanical mixer, x-
ray diffraction, particle size analyzer, oven, furnace
stove, thermogravimetric analysis, scanning electron
microscopy, tensile test tools, glass tools, two roll
mill, limestone, latex, aquadest.
2.2 Procedure
2.2.1 Sample Preparation
2000 g of limestone is taken from the mountains of
Sidikalang, Dairi, North Sumatra and then cleaned
using aquadest and then dried in the oven for 6 hours
at 110.
2.2.2 Making Limestone Powder using Ball
Mill
Limestone and seven metal balls (balls change) are
inserted into the grinding jar. Then put into grinding
station. Close the engine cover, then set the rotation
speed to 250 rpm and set the playback time to 60
minutes and press the start button. Next, limestone
powder was obtained and then filtered using a 170
mesh sieve. Then the limestone powder that has
escaped from the sieve is weighed as much as 100
grams, then calcined 100 grams of limestone powder
from the sieve at 900 for 2 hours. Furthermore, it
was characterized using x-ray diffraction or X-Ray
Diffraction (XRD).
2.2.3 XRD Characterization of Limestone
Powder
Determine the structure of limestone powder
material was carried out using x-ray diffraction
brand Pan Analytical X’Pert Powder PW 30/40. 2 g
of ball mill limestone powder is put into a 2x2 cm2
holder. Then the holder containing the sample is
connected to the diffractometer. Set the sample
name, initial angle, final angle and speed of analysis
on the computer and press the start button. From the
XRD data it can be seen the composition of
compounds from limestone powder.
ICOCSTI 2019 - International Conference on Chemical Science and Technology Innovation
166

2.2.4 Particle Size Analyzer
Determine the particle size of limestone powder was
carried out using particle size analyzer brand
Shimadzu SALD-2300. ± 1 ml of limestone powder
solution is inserted into the PSA to test the particle
size characteristics of the solution. The working
principle of this PSA is to use a laser beam
diffraction method that is fired on the liquid sample
being tested, the particles in the sample solution
undergo a movement called Brownian motion. The
light source (laser) used in the PSA in this study
uses the principle of Dynamic Light Scattering
(DLS). Measuring with this PSA is done at room
temperature. This temperature affects the movement
of particles in a solution (Brownian motion) during
measurement by a device. The higher the
temperature, the more active the motion of the
particles, this affects the accuracy of the
measurement results. Furthermore, the results of the
average particle size of limestone powder can be
determined based on the graph obtained.
2.3 Preparation of Composites
200 g of calcined limestone powder at 900 for 2
hours mixed with 800 g of latex using a mechanical
mixer with a speed of 1000 rpm for 15 minutes.
Then the same procedure was carried out for mixing
750 g of latex and 250 g of limestone powder; 700 g
of latex and 300 g of limestone powder; 650 g of
latex and 350 g of limestone powder; 600 g of latex
and 400 g of limestone powder; 1000 g of latex, then
milled using two roll mill and dried for 1 week.
Composites obtained were ground back using a two
roll mill. Furthermore, it was characterized by
tensile test, TGA analysis, SEM analysis.
2.3.1 Test of Tensile and Extensibility
Tensile strength and elongation testing were carried
out by tensile testing instruments brand Cometech
Qc 502M1 on each specimen by means of dumbbell
and specimen sizes based on ASTM D-412. Turn on
the Torsee's Electronic System tool. Left for 1 hour.
Clamped the sample using giff. Set voltage, strain,
and unit. Turn on recorder (ON). Installed note ink.
Set the x axis (strain) and y axis (voltage) and set the
unit. Installed sample. Press the start button. Rated
load and stroke values. Judging by the numbers in
load (stress) and stroke (strain), if the sample has
broken up. Note the load and stroke values of the
sample.
2.3.2 Analysis of Thermal Properties with
Thermogravimetric Analysis
Analysis of thermal properties was carried out using
the thermogravimetric analysis brand ASTM E1131.
Weighed a sample 10 mg and then put it into an
aluminum cell, then press it. The cell that has been
pressed is placed in a position adjacent to the
reference cell, where after the device is in
equilibrium, then the analysis device is operated
with a temperature of 30
o
C to 600
o
C with a speed of
heating increase of 10
o
C / minute and the gas used is
nitrogen. The results obtained in the form of a graph
of flow of heat flow to temperature and mass graphs
that are lost to temperature.
2.3.3 Analysis of Morphological Properties
by SEM
Analysis of morphological properties was carried
out using the scanning electron microscopy brand
FEI Inspect-S50. The microscopic observation
process using SEM begins with glueing the sample
with a stick made of older metal specimens. Then
after the sample is cleaned with a blower, the sample
is coated with gold and palladium with a dionspater
machine pressurized 1492x10
-2
atm. The sample is
then put into a special room and then irradiated with
10 Kvolt electron beam so that the sample emits
secondary electrons and bounced electrons which
can be detected by scientor detectors which are then
amplified by an electrical circuit which causes
Chatode Ray Tube images. Shooting is done after
selecting a particular part of the object (sample) and
the desired magnification so that a good and clear
photo is obtained.
3 RESULTS AND DISCUSSION
3.1 Characterization of Limestone
Powder
The results of the characterization of limestone
powder produce a diffractogram as shown in Figure
4.1 by matching the results of the limestone
diffractogram with the diffractogram that contained
JCPDS (Join Committee On Difraction) so that
limestone constituents can be identified.
Making Composites from Mixing Limestone with Addition of Latex
167
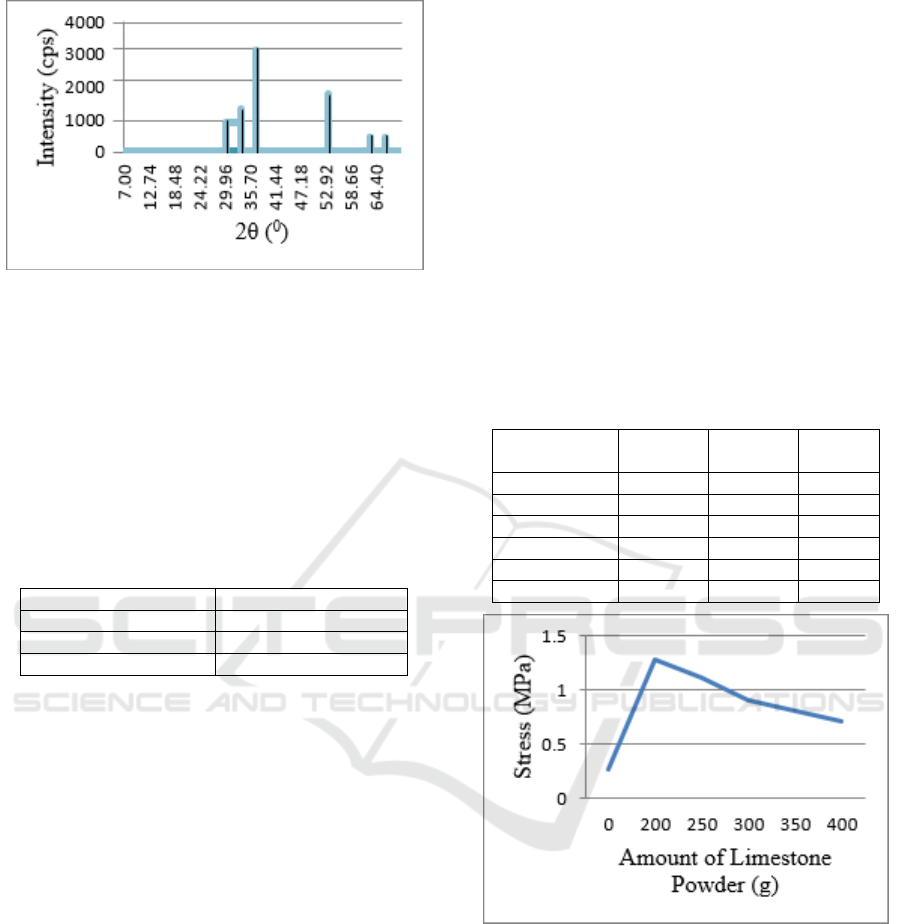
Figure 1: Diffractogram of limestone powder from the
Sidikalang mountains, Dairi, North Sumatra
Identification results showed that limestone from
the Sidikalang mountain range, Dairi, North Sumatra
contained CaO minerals which were characterized
by the presence of peaks at 2θ = 32.20280
o
,
37.35560
o
and 53.86320
o
(Table 4.1). Similar results
were also reported by Husin (2013), CaO constituent
minerals with peak characteristics at 2θ = 32.290
o
,
37.40
o
and 53.870
o
.
Table 1: Angle Value 2θ of CaO
Standard (JCPDS) Sidikalang Mountain
32.29 32.20
37.40 37.35
53.87 53.86
The results of the characterization of limestone
that has become limestone powder showed that the
particles of limestone powder had an average
particle size of 731.7 nm.
3.2 Composite Characterization
Composite characterization was carried out to
determine the quality produced by mixing a
polymeric material, where characterization was
carried out, namely characterization of mechanical
properties by tensile strength test, elongation and
elastic modulus, characterization of thermal
properties using TGA (Thermogravimetric Analysis)
and characterization of morphological properties by
using SEM (Scanning Electron Microscopy).
3.2.1 Tensile Test
Tensile strength testing is carried out to determine
the tensile strength of the test object against the pull
and the extent to which the material increases in
length. This test uses the ASTM D-412 standard.
From the results of the tensile strength
measurements of latex composite specimens with
the use of limestone powder as fillers showed a
better value than without using fillers. The highest
tensile strength measurements were 1.279 MPa (800
g latex + 200 g limestone powder) and the lowest
tensile strength was 0.272 MPa (1000 g latex). For
full results can be seen in Table 2 below.
For the measurement of tensile strength obtained
that the value of tensile strength increases lower
when the addition of filler increases. This is because
if the number of fillers increases and the number of
matrices decreases, the spread of fillers will be
uneven in the latex compound, resulting in
agglomeration of fillers which decreases the
effectiveness of the tensile force between the filler
particles and the matrix which decreases the tensile
strength 2012; Fang et al., 2014).
Table 2: Testing Results of Mechanical Properties of
Tensile Test of Latex Composite Specimens
Sample
(Ltx : LSP)
Wide
(mm)
Thick
(mm)
Stress
(MPa)
10:0 14 4.9 0.272
8:2 10.5 3 1.279
7:3 10.2 3.2 1.109
6:4 10.7 3.4 0.910
6.5:3.5 10.4 3.1 0.814
6:4 10.6 3.3 0.718
Figure 2: Graph of Stress vs Amount of Limestone
Powder
3.2.2 Extensibility
For the measurement of strain (strain or elongation)
the highest was 4.328 mm / mm (1000 g latex) and
the lowest elongation was 2.915 mm / mm (600 g
latex + 400 limestone powder). For full results, see
Table 3 below.
ICOCSTI 2019 - International Conference on Chemical Science and Technology Innovation
168
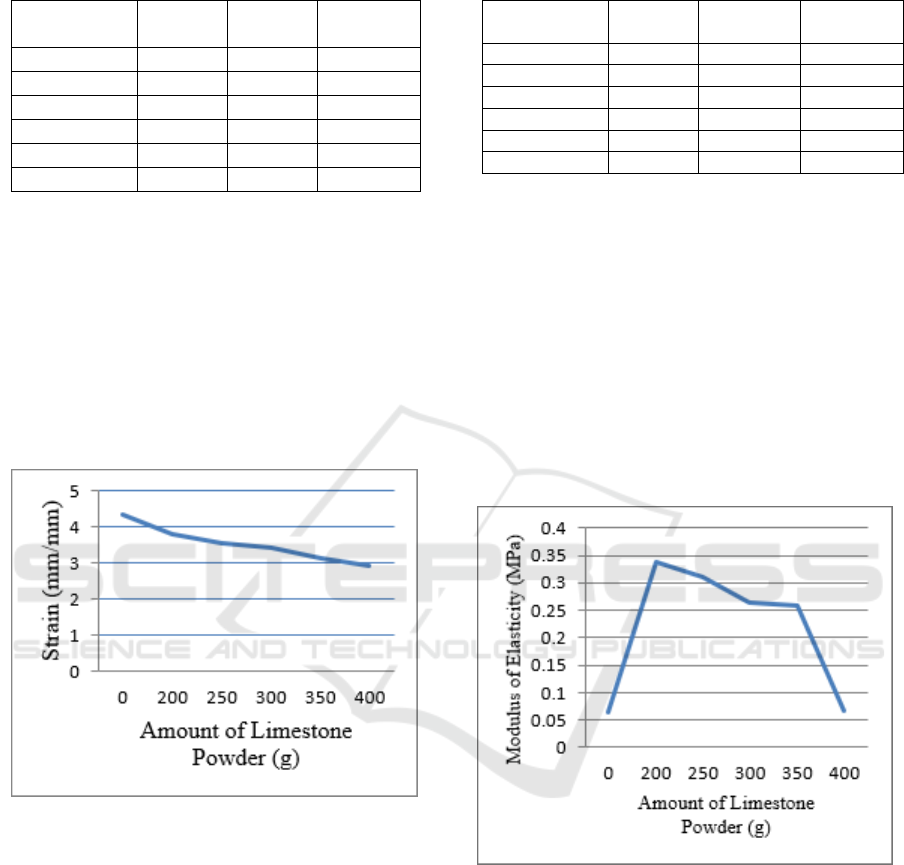
Table 3: Testing Results of Mechanical Properties of
Strain of Latex Composite Specimens
Sample
(Ltx : LSP)
Gauge
(mm)
∆
l(mm)
Strain
(mm/mm)
10:0 69 298.64 4.32
8:2 64 242.30 3.78
7:3 71 253.21 3.56
6:4 63 215.76 3.42
6.5:3.5 54 169.22 3.13
6:4 47 137.02 2.92
For the measurement of elongation, it is obtained
that the value of elongation increases when the
addition of filler increases. This is because rubber
has elastic properties but because of the increasing
number of fillers and the addition of fewer matrices,
the elastic properties of the rubber (as a matrix)
decrease. In addition, increasing increments of fillers
tend to form agglomerations which cause composite
mixtures to become brittle so that they break more
easily which causes the value of elongation to
decrease (Veronika et al., 2013).
Figure 3: Graph of Strain vs Amount of Limestone
Powder
3.2.3 Modulus of Elasticity
The highest young modulus measurement is 0.337
MPa (800 g latex + 200 g limestone powder) while
the lowest modulus is 0.063 MPa (1000 g latex). For
full results can be seen in Table 4 below.
Table 4: Testing Results of Young Modulus of Latex
Composite Specimens
Sample
(Ltx : LSP)
Stress
(MPa)
Strain
(mm/mm)
MoE
(MPa)
10:0 0.272 4.328 0.063
8:2 1.279 3.785 0.337
7:3 1.109 3.566 0.311
6:4 0.910 3.424 0.265
6.5:3.5 0.814 3.133 0.259
6:4 0.718 2.915 0.246
For the measurement of young modulus it was
found that the value of young modulus decreases
when the addition of filler increases. If more and
more fillers were added there will be an uneven
distribution of latex compounds, thereby reducing
the value of young modulus (Veronika et al.,2013).
Tensile strength indicates the maximum force
required to decide on the lime powder latex
composite. Observation results of tensile strength are
expressed in the form of stress curves, namely the
ratio of loads to cross-sectional area = F / A, to the
extension of the material (strain / strain), namely the
length increase divided by the initial length of
material, expressed in stress-strain curves.
Figure 4: Graph of Modulus of Elasticity vs Amount of
Limestone Powder
Making Composites from Mixing Limestone with Addition of Latex
169
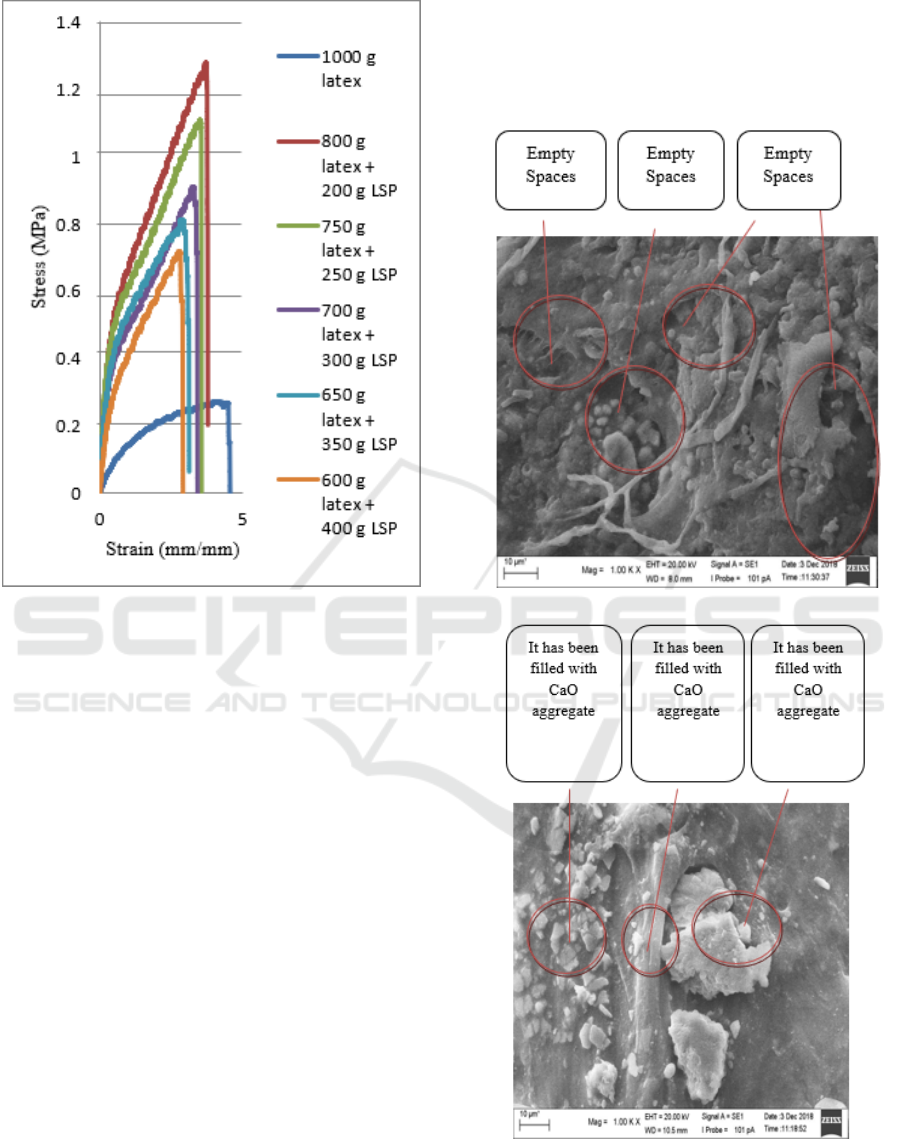
Figure 5: Curve of stress vs strain
From the graph above, it can be seen that the
highest stress is shown in 800 g of latex + 200 g of
limestone powder which is 1.279 MPa because in
subsequent variations the addition of filler increases
and the number of matrices decreases, spread of
filler will be uneven in the latex compound resulting
in agglomeration of fillers which decreases the
effectiveness of tensile forces between particles of
fillers and matrices which then decreases tensile
strength (Nuraya et al., 2012; Fang et al., 2014)
while the highest strain is shown in 1000 g of latex
which is 4.328 mm / mm because rubber has
properties the elastic but in the next variation the
increase in filler increases but the addition of the
matrix decreases, causing the elastic properties of
rubber (as a matrix) to decrease and the increase in
filler tends to form agglomeration which causes the
composite mixture to become brittle so that it breaks
easily causing a value elongation s decreases
(Veronika et al., 2013).
3.2.4 Morphological Analysis of SEM
Characterization using SEM was carried out to look
at the morphology of latex composites with fillers of
limestone powder, where the morphological results
that appeared could show which combination of
fillers and matrices in this case to see the dispersion
(distribution) of filler particles into the polymer
matrix. The results of particle board morphology
analysis can be shown in Figure 6 and Figure 7 as
below.
Figure 6: SEM photos of latex
Figure 7: SEM photo of Latex/LSP (8:2)
In Figure 6, there are blank spaces in the latex
matrix while in Figure 7 it appears that the empty
ICOCSTI 2019 - International Conference on Chemical Science and Technology Innovation
170
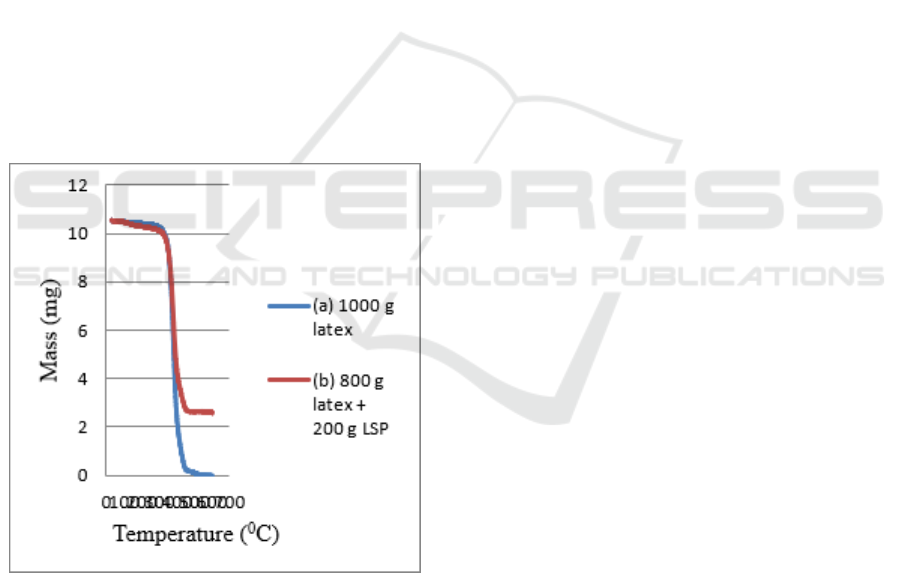
spaces have been filled with CaO aggregates and
distributed almost evenly to the latex matrix. This is
due to the small size of the particles from the filler
which allows limestone to be able to combine with
latex. The more amount of CaO added in the latex
compound, the rubber matrix will be increasingly
filled by the dispersion of the filler material so that it
will cause agglomeration of latex and decrease
mechanical properties (Dewi et al., 2014).
3.2.5 Characterization of Thermal
Properties
The characterization of thermal properties in latex
composites with limestone powder fillers using
Thermogravimetry Analysis (TGA) is a technique to
measure changes in thermal transition or material
heat to the function of temperature or time in a
controlled atmosphere.
Thermogravimetry Analysis (TGA) is a test
performed on a sample to determine changes in
weight (loss) due to changes in temperature.
Analysis provides information on the point at which
the lost mass is seen most clearly with respect to
temperature changes so that the resulting data can be
used to predict thermal stability.
Figure 8:TGA curve (a) Latex and (b) Latex/LSP (8:2)
On the curve shown in Figure 4.8 it can be seen
that the sample of 1000 g of latex has thermal
stability at 377.39
o
C while a sample of 800 g of
latex + 200 g of limestone powder has thermal
stability at 378.210
o
C. This shows that the
composite experienced thermal decomposition at a
temperature of 300-400
o
C. Because after passing the
400
o
C temperature both curves are not at the same
point (not coincide again) and separated into 2
curves.
In Figure 4.8 it can be seen that in a sample of
800 g of latex + 200 g of limestone powder which is
at a temperature of 100
o
C mass is obtained 10.4727
mg; at a temperature of 200
o
C a mass of 10.2941 mg
is obtained; at a temperature of 300
o
C mass is
obtained 10.1138 mg; at a temperature of 4000 0C a
mass of 4.30106 mg was obtained; at a temperature
of 500
o
C a mass of 2.60660 mg is obtained; at 600
o
C
a mass of 2.56472 mg was obtained. Whereas the
sample of 1000 g of latex at a temperature of 100
o
C
obtained a mass of 10.4583 mg; at a temperature of
200
o
C a mass of 10.3953 mg is obtained; at a
temperature of 300
o
C a mass of 10.2337 mg was
obtained; at a temperature of 400
o
C a mass of
2.26365 mg is obtained; at a temperature of 500
o
C
the mass is 0.0882131 mg; at 600
o
C the mass is
0.0300798 mg.
From the above data it can be concluded that in
the sample of 1000 g of latex at a temperature of
600
o
C the mass of 0.0300798 mg was obtained
while in the sample 800 g of latex + 200 g of lime
powder at a temperature of 600
o
C a mass of 2,56472
mg was obtained. The mass in the sample of 800 g
of latex + 200 g of limestone powder was greater
than in the sample of 1000 g of latex. This is
because limestone generally has a melting
temperature of 900-1000
o
C so it cannot decompose
thoroughly and produce a greater amount of mass
(Keliat, 2015).
4 CONCLUSIONS
The morphological results of SEM on a mixture of
1000 g latex show that there are empty spaces in the
latex matrix whereas in a mixture of 800 g latex +
200 g limestone powder it appears that the empty
spaces have been filled with CaO aggregates and are
evenly distributed on the latex matrix.
The results of the characterization of the
mechanical properties of latex composites found that
the optimum tensile strength was found in a
composite of 800 g of latex + 200 g of limestone
powder of 1.279 MPa, optimum elongation was in
1000 g of latex of 4.328 mm / mm and optimum
young modulus was in composite 800 g latex + 200
g limestone powder of 0.337 MPa.
The results of the characterization of thermal
properties with TGA on latex composites is that the
composite decomposes at 300-400
o
C because in the
sample 1000 g of latex has thermal stability at
377.390
o
C and in the sample 800 g of latex + 200 g
Making Composites from Mixing Limestone with Addition of Latex
171

of limestone powder has thermal stability at
temperature of 378,210
o
C.
REFERENCES
Abdullah, Mikrajuddin, Khairurijal. 2008. Karakterisasi
Nanomaterial. Jurnal Nanosains dan Nanoteknologi.
Vol.2, No.1. Hal 1-9: Bandung
Akmal, I. 2010. Seri rumah ide. Gramedia: Jakarta
Allen,E. 2005. Dasar-dasar konstruksi bangunan.
Erlangga: Jakarta
Arifin, Darminto, Zainal. 2010. Identifikasi dan
Karakteristik Batu Kapur CaCO3 Kemurnian Tinggi
sebagai Potensi Unggulan di Kabupaten Tuban.
Makalah Penelitian. Institut Teknologi Sepuluh
November: Surabaya
Aruminingsih. 2007. Planet kehidupan. Erlangga: Jakarta
Arzul, G. 2001. Aquaculture, environment and marine
phytoplankton. Ifremer: Brest
Boggs, J.R. 1987. Principles of Sedimentology and
Stratigraphy. Meril Publishing Company: Toronto
Cowd, M. A. 1991. Kimia Polimer. Penerbit ITB:
Bandung
Dai, L. 2006. Carbon nanotechnology : Recent
Developments in Chemistry, Physics, Materials
Science and Device Applications. Elsevier: New York
Dewi, I.R., Herminiwati. 2014. Lateks Karet Alam untuk
Sol Sepatu : Metode Pembuatan, Sifat Mekanik dan
Morfologi. Balai Besar Kulit, Karet dan Plastik:
Yogyakarta
Djaprie, S. 1999. Metalurgi Fisik Modern dan Rekayasa
Material. Erlangga: Jakarta
Fang, Q., Song, B., Tee, T., Sin, L. T., Hui. D., & Bee, S.
2014. Investigation of dynamic characteristics of
nano-size calcium carbonate added in natural rubber
vulcanizate. Composites: Part B, 60, 561-567
Fulekar, M.H., Pathak, B. 2017. Environmental
nanotechnology. CRC Press,LLC: New York.
Goutara, B.D., Tjiptadi, W. 1985. Dasar Pengolahan Karet
Depolimeresasi Lateks Karet Alam yang Diberi
Perlakuan Hidroksilamin Netral Sulfat (HNS). Skripsi.
Fakultas Teknologi Pertanian. Institut Pertanian
Bogor.
Gunawan, B., Azari C.D. 2010. Karakterisasi
Spektrofotometri IR dan Scanning Electron
Microscopy (SEM) Sensor Gas dari Bahan Polimer
Poly Ethylen Glycol (PEG). Jurnal Sains dan
Teknologi. Mataram
Gusti, J. 2008. Pengaruh penambahan surfaktan pada
sintesis senyawa kalsium fosfat melalui metode
pengendapan. Universitas Andalas: Padang
Heru, D.S., Andoko, A. 2008. Petunjuk lengkap budidaya
karet. PT Agromedia Pustaka: Jakarta
Keliat, R.S. 2015. Peranan penambahan nano partikel batu
kapur terhadap sifat mekanis dan ketahanan termal
komposit polietilen densitas tinggi. Universitas
Sumatera Utara: Medan
Kohjiya, S., Ikeda, Y. 2014. Chemistry, Manufacture and
Applications of Natural Rubber. Woodhead Publishing
Limited: New York.
Lee, C.C. 2005. Environmental engineering dictionary.
The Scarecrow Press, Inc: Toronto
Lu, A.H., Zhao, D., Wan, Y. 2010. Nanocasting a versatile
strategy for creating nanostructured porous
materials. RSC Publishing: Cambridge
Lu, L., Lai, M.O. 1998. Mechanical alloying. Springer
Science+Business Media,LLC: New York
Lukman, M., Yudyanto., Hartatiek. 2012. Sintesis
biomaterial komposit CaO-SiO2 berbasis material
alam (batuan kapur dan pasir kuarsa) dengan variasi
suhu pemanasan dan pengaruhnya terhadap porositas,
kekerasan dan mikrostruktur. Journal Sains.Vol 2, No
1. UM: Malang
Maloney, T.M. 1993. Modern Particleboard and Dry
Process Fiberboard Manufacturing. Miller
Freeman Inc: San Fransisco
Moss, D.R. 2004. Pressure Vessel Design Manual.
Elsevier: United States Of America
Mukarrom, F. 2017. Ekonomi Mineral Indonesia. CV
Andi Offset: Yogyakarta
Mullins, O.C., Sheu, E.Y., Hammami, A., Marshall, A.G.
2007. Asphaltenes, heavy oils, and petroleomics.
Springer Science+Business Media,LLC: New York
Mulyani, S. 2006. Anatomi tumbuhan. Kanisius:
Yogyakarta
Neikov, D., Yefimov, N.V., Stanislav. 2009. Handbook of
non-ferrous metal powders. Elsevier: New York
Nuraya, A.S.S., Baharin, A., Azura, A.R., Hakim,
M.H.M.R., Mazlan, I., Adnan, M., Nooraziah, A.A.
2012. Reinforcement of prevulcanised natural rubber
latex films by banana stem powder and
comparison with silica and calcium carbonate. Journal
of Rubber Research, 15(2), 124-140
Oates, J.A.H. 1998. Lime and Limestone, Chemistry and
Technology, Production and Uses. Wiley-Vch: New
Jersey
Patel, V.K. 2013. Analysis of ball mill. Lap Lambert
Academic Publishing GmbH KG: Jerman
Pizzi, N.G. 2010. Water Treatment. American Water
Works Association: United States Of America
Purnomo. 2017. Material Teknik. CV Seribu Bintang:
Malang
Rumengan, F.S., Raya, I., Maming. 2017. Sintesis dan
Karakterisasi Hidroksiapatit [Ca10(PO4)6(OH)2] dari
Batu Kapur dengan Metode Sol-Gel. Jurnal
Laboratorium Anorganik Universitas Hasanuddin:
Makasar
Saputra, F.A. 2016. Pengaruh Karbon Hitam terhadap
Sifat Uji Tarik Komposit Karet Alam dengan
Pencampuran Metode Manual. Skripsi. Fakultas
Teknik. Program studi S1 Teknik Mesin. Universitas
Lampung
ICOCSTI 2019 - International Conference on Chemical Science and Technology Innovation
172

Sepe, M.P. 1997. Thermal Analysis of Polymers. Rapra
Technology LTD: Australia
Setianingsih, T. 2017. Mikroskop Elektron Transmisi :
Teori dan Aplikasinya untuk Karakterisasi Material.
Universitas Brawijaya Press: Malang
Shubri, E., Armin, I. 2014. Penentuan Kualitas Batu Kapur
dari Desa Halaban Kabupaten Lima Puluh Kota di
Laboratorium Dinas Energi dan Sumber Daya Mineral
Provinsi Sumatera Barat. Skripsi. Universitas Bung
Hatta: Padang
Sinaga, P.B. 2015. Pembuatan dan Karakterisasi Polimer
Matriks Komposit Berbasis Lateks Pekat - Silika
Sekam Padi. Skripsi. Fakultas Matematika dan
Ilmu Pengetahuan Alam. Program Studi S1 Kimia.
Universitas Sumatera Utara
Siregar, T.H.S. 2003. Teknik penyadapan karet. Kanisius:
Yogyakarta
Smallman, R.E., Bishop, R.J. 2000. Metalurgi fisik
modern dan rekayasa material. Erlangga: Jakarta
Stokes, D. J. 2008. Principles and Practice of Variable
Pressure/Environmental. John Willey and Sons, Inc:
New York
Stuart, B.H. 2002. Polymer Analysis. John Wiley &
Sons,LTD: USA
Surya, I. 2006. Teknologi Karet. (Bahan Ajar). Fakultas
Teknik. Jurusan Teknik Kimia. Universitas Sumatera
Utara: Medan
Syarif, R. 2008. Pengaruh Komposisi Filler Partikel Kayu
Terhadap Kekerasan Komposit PMC. UI: Jakarta
Tillman, G.M. 1996. Water Treatment Troubleshooting
and Problem Solving. Lewis Publishers: New
York
Trisunaryanti, W. 2016. Konversi aspal buton menjadi
fraksi bahan bakar. Gadjah Mada University Press:
Yogyakarta
Verma, N.K., Khanna, S.K., Kapila, B. 2010.
Comprehensive chemistry. Laxmi Publications (P)
LTD: New Delhi
Veronika, S.S. 2013. Pengaruh Nisbah Filler Abu Sawit
(Ukuran Direduksi)/Carbon Black dan
Temperatur Pencampuran terhadap Morfologi dan
Sifat Komposit Propilen/Karet Alam: Universitas Riau
Viktor, T. 2013. Metoda Pengujian Sifat Fisik Barang Jadi
Karet. (Bahan Ajar). Balai Besar Pendidikan Dan
Pelatihan Ekspor Indonesia Direktorat Pengembangan
Ekspor Nasional Kementrian Perdangan Republik
Indonesia: Jakarta
Wirjosentono, B.1995. Analisis dan Karakterisasi Polimer.
USU – Press: Medan
Yulia, R. 2009. Depolimerisasi Lateks Karet Alam Secara
Kimia Menggunakan Senyawa Hidrogen
Peroksida – Asam Karbonat. IPB: Bogor
Zadeh, K.K., Fry, B. 2008. Nanotechnology-enabled
sensors.Springer Science+Business Media,LLC: New
York
Making Composites from Mixing Limestone with Addition of Latex
173
