
Kinetics of Petroleum Oil Recovery in Bio Surfactant of
Brevundimonas diminuta and Pseudomonas citronellolis Bacteria
Solutions
Bambang Yudono
1*
, Sri Pertiwi Estuningsih
2
, Muhammad Tri Handoko
1
and Muhammad Said
3
1
Department of Chemistry, University of Sriwijaya, Jl. Raya Palembang-Prabumulih Ogan Ilir South Sumatera,
Indonesia 30662
2
Department of Biology, University of Sriwijaya, Jl. Raya Palembang-Prabumulih Ogan Ilir South Sumatera,
Indonesia 30662
3
Department of Chemical Engineering, University of Sriwijaya, Jl. Raya Palembang-Prabumulih Ogan Ilir South Sumatera,
Indonesia 30662
Keywords: Bio Surfactant, Brevundimonas diminuta, Kinetics, Pseudomonas citronellolis.
Abstract: Kinetics of crude oil solubility in bio surfactant of Brevundimonas diminuta and Pseudomonas citronellolis
bacterias was studied by using a combination of differential and integral methods. The order of reaction and
reaction rate constants of crude oil solubility was determined by using differential and integral methods
respectively. The observation was carried out for 10 days, and integral method observation was carried out
every 2 days, for 10 days. The initial TPH concentration (Total Petroleum Hydrocarbon) of sludge sequently
were 1.64; 3.28; 4.91; 6.11 and 7.57 % (w/w). After 10 days’ treatment by using B. diminuta bacteria, the
TPH concentrations were decreased to 1.24; 2.43; 3.61; 4.32; 5.07% (w/w) and the TPH concentration using
P. citronellolis decreased to 1.07; 2.10; 3.13; 3.79; 4.40% (w/w). The order reaction which determined by
using differential method were 1.81 for B. diminuta and 1.1 for P. citronellolis. Furthermore, the order
reaction was put in the integral equation thus forming reaction rate constants equation of crude oil solubility
which are 0.018 day
-1
for B. diminuta and 0.033 day
-1
for P. citronellolis. Qualitative analysis which were
carried out by using GC showed that bio surfactant from B. diminuta was able to dissolve hydrocarbon
compounds of crude at fraction with lower C atomic chain <C10–C14 and C atomic longer >C22. Bio
surfactant from P. citronellolis was able to dissolve hydrocarbon compound with atomic chain C10 – C14.
1 INTRODUCTION
Petroleum is a very strategic natural resource to
increase the source of foreign exchange for the
country. This type of natural resource is classified as
non-renewable and its management must be carried
out very effectively and efficiently. Since the last
decade, the exploitation of oil fields in Indonesia has
not found a significant number of new reservoirs to
maintain and increase oil production. Meanwhile,
the role of petroleum has yet to be replaced even
though the search for petroleum deposits has become
increasingly difficult, which affected its exploitation
in an increasingly expensive manner (Juli and
Virmuda, 2001).
The process of exploitation or recovery of
petroleum in primary recovery method can recover
30-40% of petroleum, and secondary recovery that
can recover about 15-25% of petroleum. From this
method, it turns out that it still leaves around 60-
70% of the oil content trapped in the earth's crust
(Geetha, Banat and Joshi, 2018; Al-Bemani, 2011).
Given that the releasable oil trapped in rocks is
still quite high, which is around 60-70%. One of the
technologies to increase the acquisition of petroleum
is by using microorganisms known as the Microbial
Enhanced Oil Recovery (MEOR) method (Omoniyi,
2015; Nai, Magrini and Offe, 2016).
Isolating microbial indigen from Babat Toman
village which has the potential to produce bio
surfactants including P. acidovorans,
Brevundimonas diminuta, P. flourescens,
Bukholderia glumae, P. aeruginosa, Bacillus firmus,
P. peli, and P. citronellolis. In this study, Br.
diminuta and P. citronellolis bacteria are used. The
effect of salt on oil recovery oil, where the study
Yudono, B., Estuningsih, S., Tri Handoko, M. and Said, M.
Kinetics of Petroleum Oil Recovery in Bio Surfactant of Brevundimonas diminuta and Pseudomonas citronellolis Bacteria Solutions.
DOI: 10.5220/0008856401050112
In Proceedings of the 1st International Conference on Chemical Science and Technology Innovation (ICOCSTI 2019), pages 105-112
ISBN: 978-989-758-415-2
Copyright
c
2020 by SCITEPRESS – Science and Technology Publications, Lda. All rights reserved
105

showed optimal salt for B. diminuta bacteria was
reduced by 3% and P. citronellolis 6%. B. diminuta
and P. citronellolis bacteria were used because these
bacteria are able to produce bio surfactants and
recover petroleum. This is the basis of this research,
which needs further research to determine the
reduction in the concentration of Total Petroleum
Hydrocarbons (TPH) per unit time from the bacteria
B. diminuta and P. citronellolis. Kinetics
information is very important because kinetics
provides information on chemical concentrations
that are still lagging at any time and can be used to
predict the length of time the oil degradation process
will lead to the expected residual target (Marshall,
2008; Yudono et al., 2017).
In this study a sample concentration variation
was carried out with a treatment time of 10 days. All
data were evaluated using chemical kinetic theory
with differential and integral method approaches.
Qualitative studies were carried out using Gas
Chromatography (GC) which gave a more detailed
picture of the hydrocarbon compound fractions
before treatment and after treatment (Jovančićević et
al., 2004; Salminen et al., 2004).
2 MATERIALS AND METHODS
The material used in this study, namely microbial
isolates B. diminuta and P. Citronellolis (obtained
from the Microbiology Laboratory of the Biology
Department of FMIPA Sriwijaya University), NA
medium, aquadest, K
2
HPO
4
, peptone, FeSO
4
, yeast
extract, 70% alcohol, methanol, n-hexane, molasses
(taken from sugar waste from PT Cinta Manis,
Tanjung Raja, Ogan Ilir, South Sumatra) and oil
sludge obtained from Babat Toman Village, Musi
Banyuasin Regency.
2.1 Sterilization Tools
All heat-resistant equipment that will be used is
sterilized using an autoclave with a temperature of
121
o
C for 15 minutes, while non-heat-resistant
equipment is sterilized using 70% alcohol.
2.2 Regeneration of Bacteria
Each bacterium of B. diminuta and P. citronellolis
inoculated into NA solid media with zigzag
movements. Previously NA solid media was
sterilized in an autoclave at 121
o
C. Bacteria that
have been put into the NA medium are incubated in
an incubator for 24 hours. After incubation the
bacteria are ready to be used (Yudono et al., 2010).
2.3 Zobell Medium
The Zobell medium was made by dissolving 5 g of
peptone, 1 g of yeast extract, 0.012 g of K
2
HPO
4
,
and 0.01 g of FeSO
4
in distilled water with a
solution volume of 1000 mL. The mixture is boiled
on the hotplate and homogenized by stirring by a
magnetic stirrer. After boiling the mixture is
sterilized by autoclaving at 121
o
C for 15 minutes
(Yudono and Estuningsih, 2013).
2.4 Indigenous Bacterial Starters
The bacterial cultures of B. diminuta and P.
citronellolis as many as 5 ose were subcultured by
being put into each Erlenmeyer containing 100 mL
of Zobell medium, then aerated for 24 hours. The
100 mL Zobell medium is added to the mixture until
the total volume is 200 mL and the mixture is re-
aerated until the shortest generation time. The
shortest generation time of B. diminuta 12 hours and
P. citronellolis 9 hours (Young et al., 2005; Yudono
et al., 2011).
2.5 Crude Bio Surfactant Production
The total volume for bio surfactant production is 100
mL by mixing a bacterial starter, Zobell medium and
molasses concentration (taken from the sugar waste
of PT Cinta Manis, Tanjung Raja, Ogan Ilir, South
Sumatra) with a concentration of 15% molasses for
B. diminuta and 10% for the bacterium P.
citronilolis) with various volume variations. Then
the mixture is incubated based on the shortest
generation time. The shortest generation time of B.
diminuta is 12 hours and P. citronellolis 9 hours
(Yudono et al., 2010).
2.6 Initial TPH measurement
A total of 10 g of sludge is inserted using filter paper
that fits the size. The filter paper containing the
sludge sample is then inserted into the soxhlet tube.
Then the upper part of the soxhlet tube is connected
to the condenser and the lower part is connected to
the boiling flask containing n-hexane solvent with
the volume soaking the entire filter paper. Soxhlet is
done until the solvent drops back to boiling flask.
Soxhletion is stopped when the solvent is clear on
the soxhlet tube. Boiling flask which contains
extracts is then heated in an oven at 100
o
C, then
ICOCSTI 2019 - International Conference on Chemical Science and Technology Innovation
106

stored in a desiccator. Flask and oil are then
weighed. Then the residue from soxhletion is
weighed and the percentage of petroleum TPH is
calculated using the equation:
% TPH = (W
1
-W
2
) / W
2
x 100% (1)
Where: W
1
= Sludge sample weight (g), W
2
=
Residual weight (g)
2.7 GC Analysis
Petroleum filtrate obtained from the soxhletion
process is diluted with n-hexane 50 mL. The results
of the dilution are taken several mL, to be injected
on a Thermo Scientific GC device with a
programmed temperature of 40°C maintained for 4
minutes, the temperature is raised 5°C per minute
until the temperature reaches 300°C. The type of
column used is TG-5MS with a column length of 30
m and a diameter of 0.25 mm.
2.8 Reaction Order of Petroleum
Solubility
A total of 10 g sludge with a variation of TPH 1.5,
3.0, 4.5, 6.0, and 7.5% mixed with a bio surfactant
mixture: distilled water 10% (v/v) to a volume of
100 mL. The mixture is then aerated for 10 days.
The residue from the screening results was
calculated as the percentage of TPH. The percentage
of petroleum TPH is calculated using equation 2,
while the filtrate is extracted with n-hexane 25 mL
using a separating funnel. The top layer is taken by
repetition 4 times, then analysed using GC.
2.9 Oil Recovery Rate Constant
A total of 10 g sludge with a 4.5% TPH
concentration was added to each bio surfactant
mixture: distilled water to a total volume of 100 mL.
The mixture is then aerated according to the
variation time, for 2, 4, 6, 8 and 10 days. The residue
from the screening results was calculated as the
percentage of TPH. The percentage of petroleum
TPH is calculated using equation 1.
2.10 Determination of Reaction Order
Determining the value of the degradation reaction
order (n) through the differential method, obtained
directly from the graph of the ln [C] relationship
with ln r as shown in equation 3, where ln [C] is
TPH day 0 and ln r is TPH day 10 with the
percentage of TPH varying 1, 5%, 3%, 4.5%, 6%
and 7.5%, by determining the differential equation
tangent.
ݎൌ
ିௗሾሿ
ௗ௧
ൌ݇ሾܥሿ
(2)
ݎൌ
ௗሾሿ
ௗ௧
ൌെ݇ሾܥሿ
(3)
ln r = ln k + n ln [C] (4)
Thus, the order of degradation reaction (n) is the
same as the slope and can be directly determined
after the incubation period of day 0 to day 10, the
data is analysed using the integral and special
method at a concentration of 4.5% by measuring
TPH every 2 days. The integral method is done to
determine the degradation reaction constant (k),
based on the order of the degradation reaction (n),
which has been determined from the differential
method. Through the integration equation
continuously calculated according to order (n), a
graph of relationship time (days) was obtained with
[TPH] (Yudono, 1994).
3 RESULTS AND DISCUSSION
Determination of the reaction order of TPH due to
petroleum solubility is using differential methods.
The reaction order is determined by graphing the
relationship between ln [C] and ln r so that the
differential equation can be determined (Marshall,
2008). Based on the equation (4), ln r = ln k + ln [C],
if a graph is made of the relationship between ln [C]
and ln r, then a straight line graph will be obtained
with n being the slope and ln k being intercept. The
reaction constant will be more accurate when
measured using the integration method (Yudono et
al., 2011). The Table 1 shows the decreasing TPH
concentrations from day 0 to day 10 using bio
surfactant of B. diminuta bacteria.
3.1 Phytochemical Screening
Important phytochemicals, such as alkaloids,
triterpenoids, steroids, phenolics, flavonoids and
saponins for their presence and are presented in
Table 1.
The Table 2 shows the decreasing TPH
concentrations from day 0 to day 10 using bio
surfactant of P. citronellolis bacteria.
Kinetics of Petroleum Oil Recovery in Bio Surfactant of Brevundimonas diminuta and Pseudomonas citronellolis Bacteria Solutions
107
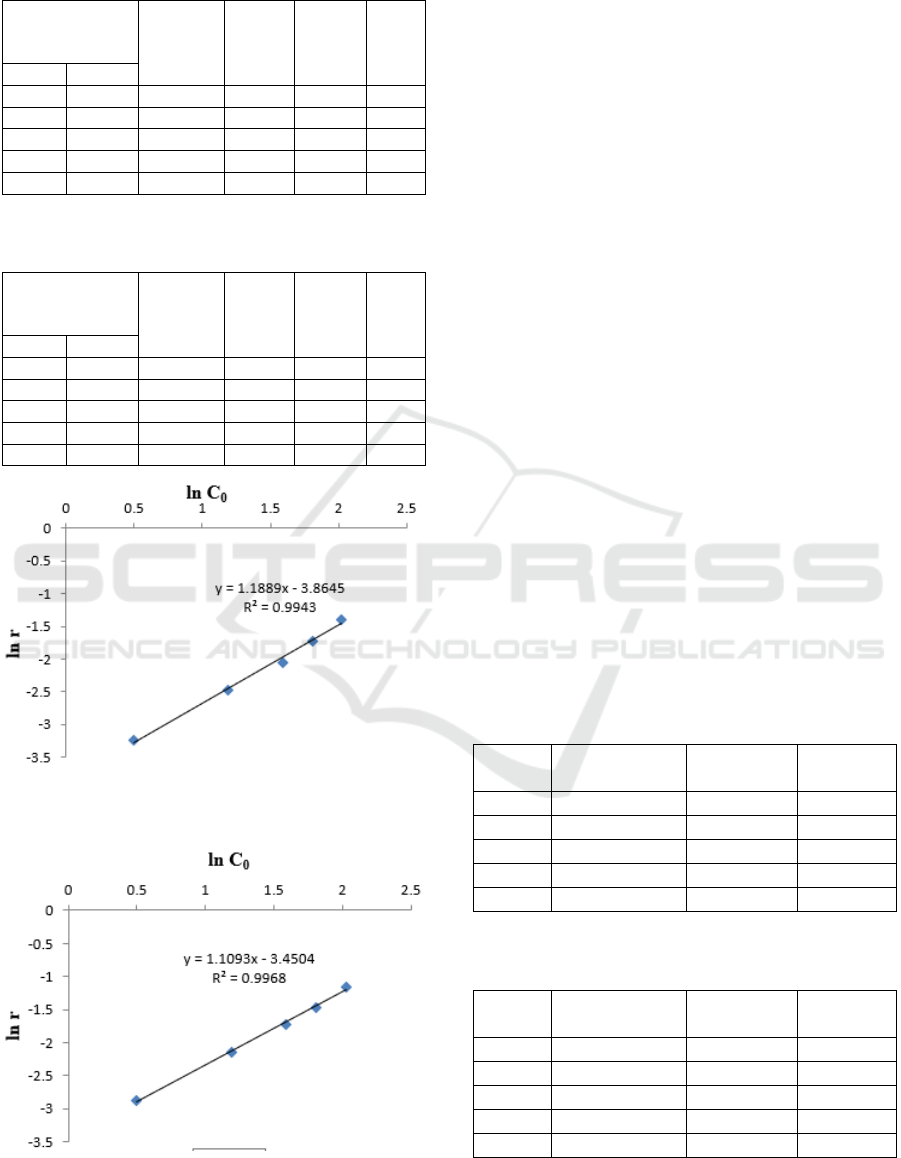
Table 1: Kinetics of solubility of petroleum sludge in bio
surfactant of B. diminuta bacteria.
TPH sludge
concentration
(%)
∆[TPH] r ln r ln C
o
C
o
C
10
1.64 1.08 0.56 0.056 -2.76 0.49
3.28 2.10 1.18 0.118 -2.09 1.18
4.91 3.13 1.77 0.177 -1.66 1.59
6.11 3.79 2.31 0.231 -1.32 1.81
7.57 4.41 3.16 0.316 -1.08 2.02
Table 2: Kinetics of solubility of petroleum sludge in bio
surfactant of P. citronellolis bacteria.
TPH sludge
concentration
(%)
∆[TPH] r ln r ln C
o
C
o
C
10
1.64 1.08 0.56 0.056 -2.76 0.49
3.28 2.10 1.18 0.118 -2.09 1.18
4.91 3.13 1.77 0.177 -1.66 1.59
6.11 3.79 2.31 0.231 -1.32 1.81
7.57 4.41 3.16 0.316 -1.08 2.02
Figure 1: Graph of the relationship ln [C0] with ln r for the
P. citronellolis bacteria.
Figure 2: Graph of the relationship ln [C0] with ln r for the
P. citronellolis bacteria.
From the Figure 1, a graph of the relationship ln
[C
0
] with ln r for B. diminuta bacteria obtained
regression value obtained at 0.9943. This shows the
graph is a straight line. From the results of the
calculation of the straight-line equation, the slope
(slope) is obtained by 1.18 with the intercept value
of -3.86. According to the differential method, the
slope value shows the order of the degradation
reaction (n), so based on this value, the order of
reaction for petroleum solubility using the bacterium
B. diminuta is a reaction order 1.18. Usually the oil
degradation reaction refers to first order reaction
(Yudono, 1994); while in this study the reaction
order is 1.18. For Figure 2, a graph of the ln [C
0
]
relationship with ln r P. citronellolis bacteria
obtained a slope of 1.1 with an intercept value of -
3.45. And the regression value is 0.9968. Based on
these values, it can be concluded that, the order of
reaction of petroleum solubility using P. citronellolis
is a reaction order 1.1.
3.2 Determination of Petroleum
Solubility Constants with Integral
Methods
The reaction rate constant of petroleum solubility
can be determined using the integral method. The
integral method shows that the value of the slope is
the value of the reaction rate constant of petroleum
solubility. The kinetics data can be seen in Table 3
and 4.
Table 3: The kinetics data of petroleum sludge solubility
in bio surfactant of B. diminuta bacteria.
Time
(t)=x
Concentration
(C
t
)=y
ln [TPH] [Ct]
-0.18
2 4.35 1.47 0.933
4 4.21 1.43 0.936
6 3.95 1.37 0.944
8 3.73 1.31 0.951
10 3.51 1.25 0.959
Table 4: The kinetics data of petroleum sludge solubility
in bio surfactant of P. citronellolis.
Time
(t)=x
Concentration
(C
t
)=y
ln [TPH] [Ct]
-0.18
2 4.28 1.45 0.963
4 4.07 1.40 0.966
6 3.73 1.31 0.972
8 3.39 1.22 0.980
10 3.03 1.10 0.989
ICOCSTI 2019 - International Conference on Chemical Science and Technology Innovation
108
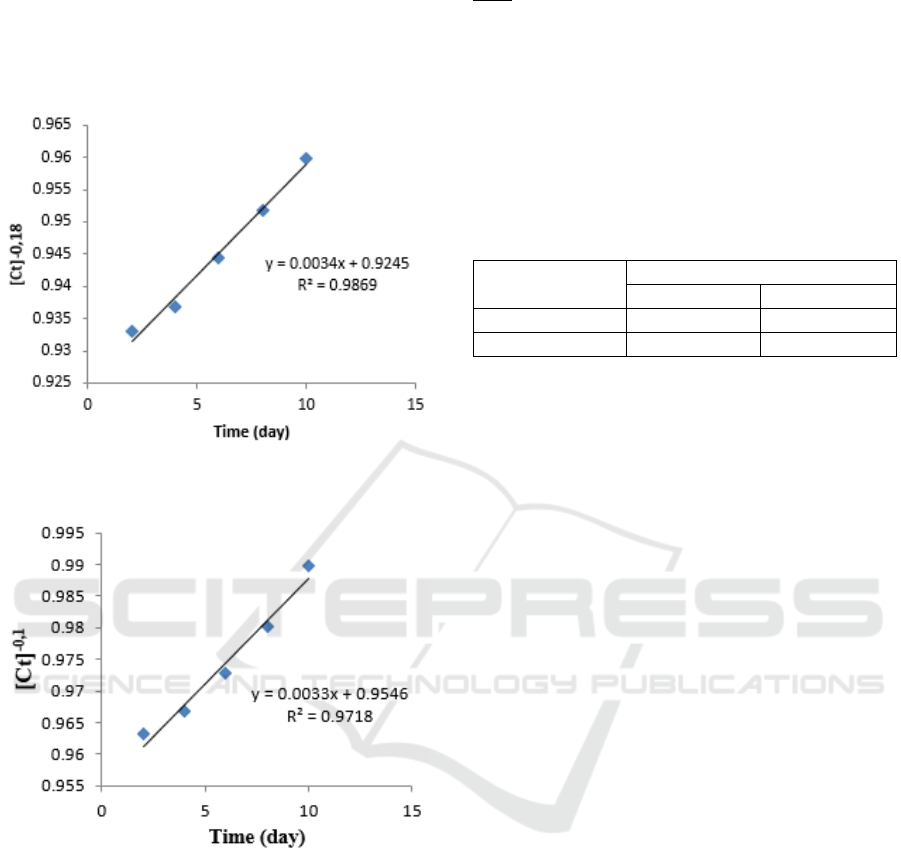
From the data table above each can be graphed
[Ct]
-0.18
relationship with time (days), so that the
slope and intercept values are known. Following is
the graph of the relationship [Ct]
-0.18
with time
(days):
Figure 3: Graph of correlations of time (days) with
concentrations [C]
-0.18
.
Figure 4: Graph of correlations of time (days) with
concentrations [C]
-0.1
.
Figure 4. Graph of the relationship of time (days)
with [C]
-0.18
shows the line equation Y = 0.0034x +
0.9245. The slope value obtained is 0.0069 and
intercept 0.9546. The regression value is 0.9869.
This shows the graph is a straight line. Then Figure
4. Graph of relations of time (days) with [C]
-0.1
shows the equation of line Y = 0.0033x + 0.9546.
The slope value obtained is 0.0033 with a regression
value of 0.9718.
To determine the reaction rate constant, the slope
values obtained from Figure 3 and 4 are inserted in
equation 7.
ିௗሾሿ
ௗ௧
ൌ݇ܥ
(5)
ሾܥሿ
݀
ሾ
ܥ
ሿ
ൌെ݇
݀ݐ
(6)
C
t
-n+1
= C
t
-n+1
– (n+1)kt (7)
So that the constant value for B. diminuta
bacteria is 0.0189 days
-1
and P. citronellolis is 0.033
days
-1
. From Figures 1, 2, 3 and 4 we can see the
comparison of each bacterium shown in Table 5.
Table 5: Order and constant of each bacterium.
Bacteria
Parameter
n K (day
-1
)
B. diminuta 1.18 0.018
P. citronellolis 1.1 0.033
3.3 GC Chromatogram Analysis
The results of extracting petroleum sludge from
petroleum sludge in the initial conditions and after
extracting it with bio-surfactant were analyzed using
GC. These results were then analyzed qualitatively
using Thermo Scientific GC-MS to determine the
difference in the number of sludge components
before treatment with the number of sludge
components after the addition of bio surfactant
treatment from each bacterium (Jovančićević et al.,
2004). Based on the GC-MS data that has been
obtained, it can also be qualitatively analyzed the
dissolved and non-dissolved hydrocarbons left on
the residue shown in the histogram in the form of
percent abundance of each bacteria.
Components that are dissolved in bio surfactants
and components that become residues can be
explained through histograms of changes in
abundance. Based on the histogram, the x axis is the
C chain fraction identified which is determined by
determining the temperature range calculated from
the retention time and the y axis is the change in
abundance. The histogram was generated from the
acquisition of the initial component chromatogram
data and after the addition of bio surfactants from
each bacterium. The abundance change is indicated
by ∆A = %A
t
- %A
o
, if the resulting data is a
positive number, it shows the component of the
dissolved hydrocarbon chain. Otherwise, if it is a
negative number, it indicates that the hydrocarbon
chain component is residual.
The fractions of C which are residues and
dissolved ones can be seen in Table 6 which shows
the C chain fraction based on its temperature
(Fanani, Yudono and Situmorang, 2014).
Kinetics of Petroleum Oil Recovery in Bio Surfactant of Brevundimonas diminuta and Pseudomonas citronellolis Bacteria Solutions
109
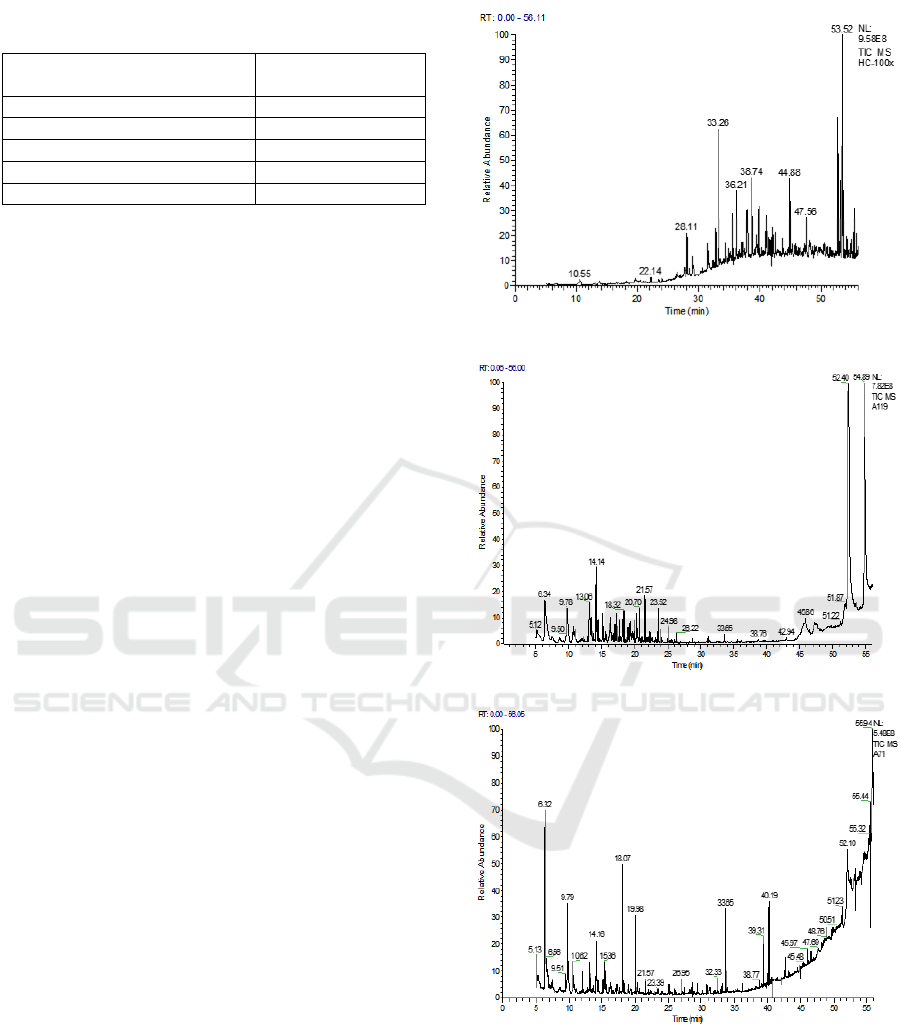
Table 6: Hydrocarbon chain fractions based on
temperature.
Temperature range (
o
C)
Carbon chain
fraction
<100 <C
10
100-150 C
11
-C
14
150-200 C
15
-C
17
200-250 C
18
-C
21
250-300 >C
22
Based on Figure 8a, it can be seen that there is a
significant number of chromatogram peaks of
petroleum constituent compounds in initial
condition.
Based on the total retention time for 56 minutes,
there were some of the highest peak chromatograms,
which occurred at retention times 28.11; 33.26;
36.21; 38.74; 44.88; and 53.52, whereas for other
retention times it has a chromatogram with a low
peak. In Figure 4b chromatogram, it can be seen in
the chromatogram that small peaks appear which
indicate the presence of new compounds at the
retention time of 6.34 which was previously not
detected in Image Chromatogram 4a. After the
addition of bio surfactants from the bacterium B.
diminuta, Figure 4b shows a decrease and addition
of the chromatogram peak with a total retention time
of 56 minutes. In addition, Figure 4c also shows that
small peaks have appeared at retention times of 5.13
which indicate the presence of new compounds.
These compounds have low molecular weight
because they appear at earlier retention times and are
branching alkane isomers. There are several highest
peak chromatograms, namely at retention time of
6.32; 9,79; 18.07; 33.65; 40.19, while for other
retention times have a chromatogram with a low
peak. From the picture above it can be concluded
that there is a change in the rise and fall of the peak
area in the chromatogram, whether it increases or
decreases. Changes in the rise and fall of the peak
area indicates that bio surfactants work to dissolve
the hydrocarbon components to form new, simpler
hydrocarbon components (Fanani, Yudono and
Situmorang, 2014).
The component changes that occurred can be
explained qualitatively on the changes in abundance
shown in Figure 5 in the form of a histogram.
(a)
(b)
(c)
Figure 4: (a) Chromatogram TPH initial sludge before
crude bio surfactant treatment, (b) Chromatogram TPH
end sludge after treatment using bio surfactant from
bacteria Brevundimonas diminuta, (c) Chromatogram TPH
end sludge after treatment using bio surfactant from
Pseudomonas citronellolis bacteria.
ICOCSTI 2019 - International Conference on Chemical Science and Technology Innovation
110
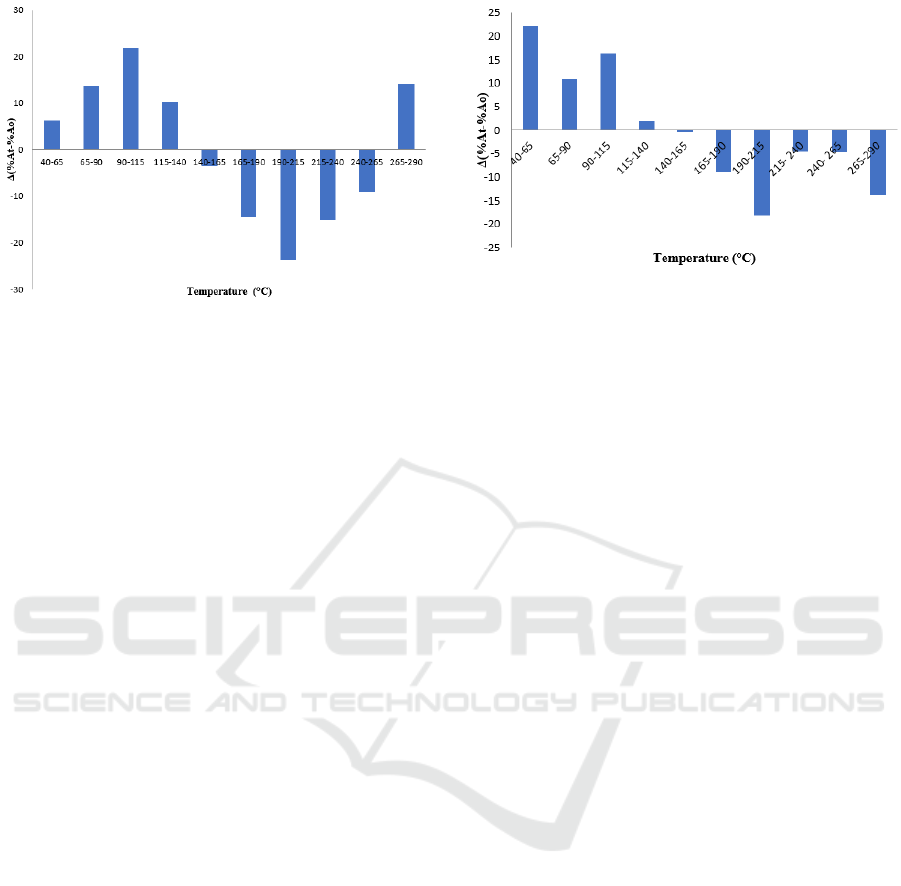
Figure 5: Histogram of changes in soluble oil abundance
in bio surfactants of bacteria Brevundimonas diminuta.
Based on the histogram above, the percentage
difference in abundance is calculated by subtracting
the percentage of abundance after the addition of
crude bio surfactant (A
t
) from the bacterium B.
diminuta minus the peak abundance percentage
before the addition of crude bio surfactant (A
0
). The
positive reduction results show that dissolved
hydrocarbons in bio surfactant. Increased histogram
shows that short chain hydrocarbons dissolve in bio
surfactants, so that at the peak of the chromatogram
there are carbon chains that are lost and decompose
into short chains. This histogram explained that bio
surfactants from B. diminuta bacteria at a 5-20
minute retention time showed a percentage increase
in abundance compared to the initial one, indicating
that bio surfactants were able to dissolve short-chain
C hydrocarbons namely atomic chains <C
10
– C
14
at
temperatures 40-140
o
C and at retention times 50-55
minutes are able to dissolve long C hydrocarbons,
namely the atomic chain >C
22
at a temperature of
265-290
o
C which is at a positive value. But bio
surfactants from B. diminuta bacteria at a retention
time of 25-50 minutes were unable to dissolve long
C hydrocarbons, namely C
15
-C
17
and C
18
-C
21
at
temperatures of 140-265
o
C. While the component
changes that occur in the use of P. citronellolis
bacteria can be seen in Figure 6.
Based on the Figure 6, the increasing histogram
shows that short-chain hydrocarbons dissolve in bio
surfactants, so that at the peak of the chromatogram
there are long carbon chains that are lost and break
down into short carbon chains. the per cent
difference in abundance is calculated by subtracting
the per cent peak abundance after the addition of
crude bio surfactant (A
t
) from the bacterium P.
citronellolis minus the percent peak abundance
before the addition of crude bio surfactant (A
0
).
Figure 6: Histogram of changes in soluble oil abundance
in bio surfactants of Pseudomonas citronellolis bacteria.
If the result of the reduction is positive, it means that
the hydrocarbon compound dissolves in bio
surfactant, where if bio surfactant and bacterial
culture have a larger hydrophobic head then it will
also produce a large oil recovery. On the histogram,
it can be seen that most of the atomic chain
hydrocarbons <C
10
- C
14
are in a positive value,
which means that the atomic chain hydrocarbons
<C
10
- C
14
are mostly soluble in bio surfactants.
4 CONCLUSIONS
B. diminuta and P. citronellolis bacteria can reduce
the Total Petroleum Hydrocarbons (TPH) in all
treatment media concentrations. The optimal
reduction in TPH using bio surfactant from B.
diminuta bacteria occurred at variations in media
concentration of 7.51% (b / b) for 10 days with TPH
values falling to 5.07% (b / b), while for P.
citronellolis bacteria able to reduce TPH 7.51% to
4.40% within 10 days.
The reaction order and reaction rate constants
obtained from petroleum solubility using the bio
surfactant of the B. diminuta bacteria are 1.18 and
0.0189 days
-1
. Based on the kinetics model, the time
needed to dissolve petroleum sludge completely is in
73 days, while the reaction order and reaction rate
constants of P. citronellolis are 1.1 and 0.033. the
time needed to dissolve petroleum sludge
completely is in 44 days.
The results of GC and Histogram analysis of
changes in oil abundance from each bacterium can
be seen that bio surfactants from B. diminuta
bacteria based on 5-20 minutes retention time appear
short-chain C hydrocarbons which are < C10 – C14
atomic chains obtained from long chain hydrocarbon
degradation and at retention time of 50-55 minutes,
it is able to dissolve long chain C hydrocarbons
Kinetics of Petroleum Oil Recovery in Bio Surfactant of Brevundimonas diminuta and Pseudomonas citronellolis Bacteria Solutions
111

namely atomic chain> C22, while bio surfactant
from P. citronellolis bacteria based on 5-20 minute
retention time can be seen dissolving hydrocarbon C
atomic chain <C10-C14 which is the result of
hydrocarbon decomposition long chains that can be
seen from the decrease in the area of peak
abundance.
REFERENCES
Al-bemani, A., 2011. Microbial biotechnology for
enhancing oil recovery : Current developments and
future prospects.
Fanani, Z., Yudono, B. and Situmorang, V. R., 2014.
‘Degradasi Tanah Lahan Suboptimal oleh Bacillus
Mycoides Indigenous dan Kinetika Reaksinya
Degradation Soil of Suboptimal Land by Bacillus
Mycoides Indigenous and its Kinetics Reaction’,
Prosiding Seminar Nasional Lahan Suboptimal, 3(1),
pp. 979–587.
Geetha, S. J., Banat, I. M. and Joshi, S. J., 2018.
‘Biosurfactants: Production and potential applications
in microbial enhanced oil recovery (MEOR)’,
Biocatalysis and Agricultural Biotechnology. doi:
10.1016/j.bcab.2018.01.010.
Jovančićević, B. et al., 2004. Investigation of Interactions
between Surface Water and Petroleum Type Pollutants
(9 pp). Environmental Science and Pollution Research
- International, 12(4), pp. 205–212. doi:
10.1065/espr2004.12.229.
Juli, N. and Virmuda, B., 2001. Penelitian Awal Terhadap
Delapan Isolat Bakteri Reservoar Dalam
Mengembangkan Volume Minyak Bumi Secara
Monokultur. MI, pp. 3–5.
Marshall, S., 2008. Fundamental Aspects of Microbial
Enhanced Oil Recovery: A Literature Survey. National
Research Flasgships, 1(1), pp. 1–41. doi:
https://doi.org/10.4225/08/585ac3b461b3e.
Nai, C., Magrini, B. and Offe, J., 2016. Let
microorganisms do the talking, let us talk more about
microorganisms. Fungal Biology and Biotechnology.
BioMed Central, 3(1), p. 5. doi: 10.1186/s40694-016-
0023-9.
Omoniyi, O. A., 2015. A Review of Microbial Enhanced
Oil Recovery : Current Development and Future
Prospects. 6(1), pp. 1378–1389.
Salminen, J. M. et al., 2004. Potential for aerobic and
anaerobic biodegradation of petroleum hydrocarbons
in boreal subsurface. Biodegradation, 15(1), pp. 29–
39. doi: 10.1023/B:BIOD.0000009954.21526.e8.
Young, C. C. et al., 2005. Identification and kinetic
characteristics of an indigenous diesel-degrading
Gordonia alkanivorans strain. World Journal of
Microbiology and Biotechnology, 21(8–9), pp. 1409–
1414. doi: 10.1007/s11274-005-5742-7.
Yudono, B., 1994. Kinetics of Indigenous Isolated
Bacteria Bacillus mycoides Used for Ex-Situ
Bioremediation of Petroleum Contaminated Soil in PT
Pertamina Sungai Lilin South Sumatera. 2(3), pp. 64–
71.
Yudono, B. et al., 2010. Kinetics of Petroleum-
Contaminated Soil Biodegraded by An Indigenous
Bacteria Bacillus megaterium. HAYATI Journal of
Biosciences. Institut Pertanian Bogor, 17(4), pp. 155–
160. doi: 10.4308/hjb.17.4.155.
Yudono, B. et al., 2011. Kinetics Approach of
Biodegradation of Petroleum Contaminated Soil by
using Indigenous Isolated Bacteria. Jurnal TANAH
TROPIKA (Journal of Tropical Soils), 16(1), pp. 33–
38. doi: 10.5400/jts.2011.16.1.33.
Yudono, B. et al., 2017. Oil recovery test using bio
surfactants of indigenous bacteria in variation
concentration of carbon source. IOP Conference
Series: Earth and Environmental Science, 65(1). doi:
10.1088/1755-1315/65/1/012029.
Yudono, B. and Estuningsih, S. P., 2013. Kinetika
Degradasi Limbah Minyak Bumi Menggunakan
Sinergi Bakteri Konsorsium (Microccoccus sp,
Pseudomonas pseudomallei, Pseudomonas
pseudoalcaligenes dan Bacillus sp) dan Rumput
Eleusine Indica (L.) Gaertn. Prosiding Semirata
FMIPA Universitas Lampung.
ICOCSTI 2019 - International Conference on Chemical Science and Technology Innovation
112
