
Application of ARMA Model in Prediction of Development Trend of
Partial Discharge
Hui Xia
1, a
, Chenhao Zhao
2, b
, Zhiguo Tang
2, c
, Deguan Wu
1, d
, Hongyuan Li
1, e
, Kai Pan
1, f
1
Test & Maintenance Center of CSG EHV Transmission Company, Kunming, China
2
State Key Laboratory of Alternate Electrical Power System with Renewable Energy Sources, North China Electric Power
University, Beijing, China
f
345845596@qq.com
Keywords: Partial discharge, ARMA model, trend, prediction.
Abstract: Nowadays, gas insulated switchgear (GIS) has been widely used in power systems. Due to some external
factors, there may be defects in GIS, and some minor defects are difficult to find in the early stage. However,
partial discharges (PD) is easy to occur in the defects and make the defect large, which may cause the
failure of GIS and bring about huge economic losses to both power systems and society eventually.
Therefore, it is helpful to discover the defect discharge in time and predict its development trend for the
early warning of fault and taking suitable countermeasures. In this paper, ARMA model is selected to
predict the development trend of partial discharge, and partial discharge experiment and three kinds of
defect models are designed evaluate the prediction effect of the ARMA model. Finally, the conclusion is
drawn that ARMA model can accurately predict the development trend of linear characteristic parameters,
but it cannot predict that of irregular characteristic parameters of PD accurately.
1 INTRODUCTION
Since the 1970s, gas insulated switchgear (GIS) has
been widely used in power systems due to its high
reliability and compact structure (Кучинский, 1984;
Qiu, 1994; Bolin, 2005). Due to some mistakes in
the process of production, transportation, assembly,
etc., there may be typical defects which will lead to
partial discharge (PD) such as the suspension
discharge, corona discharge and the discharge of
void inside the insulating material(Qi, Li, Hao, 2011;
Liu, Wang, LI, 2013). Under long-term working
conditions, partial discharge will cause insulation
degradation, which will easily lead to GIS failure
during operation, and affect the stable operation of
the power system (Martin, Li, Tsutsumi, 2012;
Pharmatrisanti, Meijer, Smit, 2004). In recent years,
many GIS faults caused by PD at the position of
insulation defects have been discovered, which has
caused great losses to the power system (Ren, Dong,
Qiu, 2017; Tang, Tang, Li, 2017; Zhou, Tang, Tang,
2006). Therefore, it is necessary to study the
development of partial discharge generated by
defects in GIS, and predict the development trend of
PD, which helps to warn the occurrence of faults and
avoid serious losses(Strachan, McArthur, Judd, 2005;
Li, Sun, Du 2002; Liu, Lv ,Li,2004; Qi, Li, Xing,
2014).
H. Okubo et al. used a breakdown prediction
parameter which characterizes the change of PD to
predict the time to breakdown (Okubo, Kato,
Hayakawa, 1998). However, the mechanism of
partial discharge are complicated and the
phenomenon is always affected by various factors
such as operating voltage and load of equipment,
which makes the development of partial discharge
nonlinearly and randomly. So, it is not rigorous to
characterize the development of partial discharge
with one or several parameters. Many studies around
the world have shown that long-term predictions of
the development trend of partial discharges are very
difficult. But, the partial discharge in a short time is
relatively stable. Therefore, we can extract linear
characteristic quantities from the characteristic
fingerprint of PD, and use those linear quantities to
predict the development trend of discharge for a
short time. Short-term prediction can obtain the
discharge development trend within a few minutes
or hours before the failure occurs and realize the
390
Xia, H., Zhao, C., Tang, Z., Wu, D. and Pan, K.
Application of ARMA Model in Prediction of Development Trend of Partial Discharge.
DOI: 10.5220/0008856103900397
In Proceedings of 5th International Conference on Vehicle, Mechanical and Electrical Engineering (ICVMEE 2019), pages 390-397
ISBN: 978-989-758-412-1
Copyright
c
2020 by SCITEPRESS – Science and Technology Publications, Lda. All rights reserved
failure warning, which is also very meaningful in
engineering.
In this paper, the aging experiment platform of
GIS PD defect model is built. Three typical GIS
defect models are designed for accelerated aging test
and the UHF detection technology is used to collect
the PD signal. Finally, the ARMA prediction model
is introduced to predict the development trend of
partial discharge in a short-term.
2 EXPERIMENTAL SETUT
2.1 Test Circuit Setup and Test Model
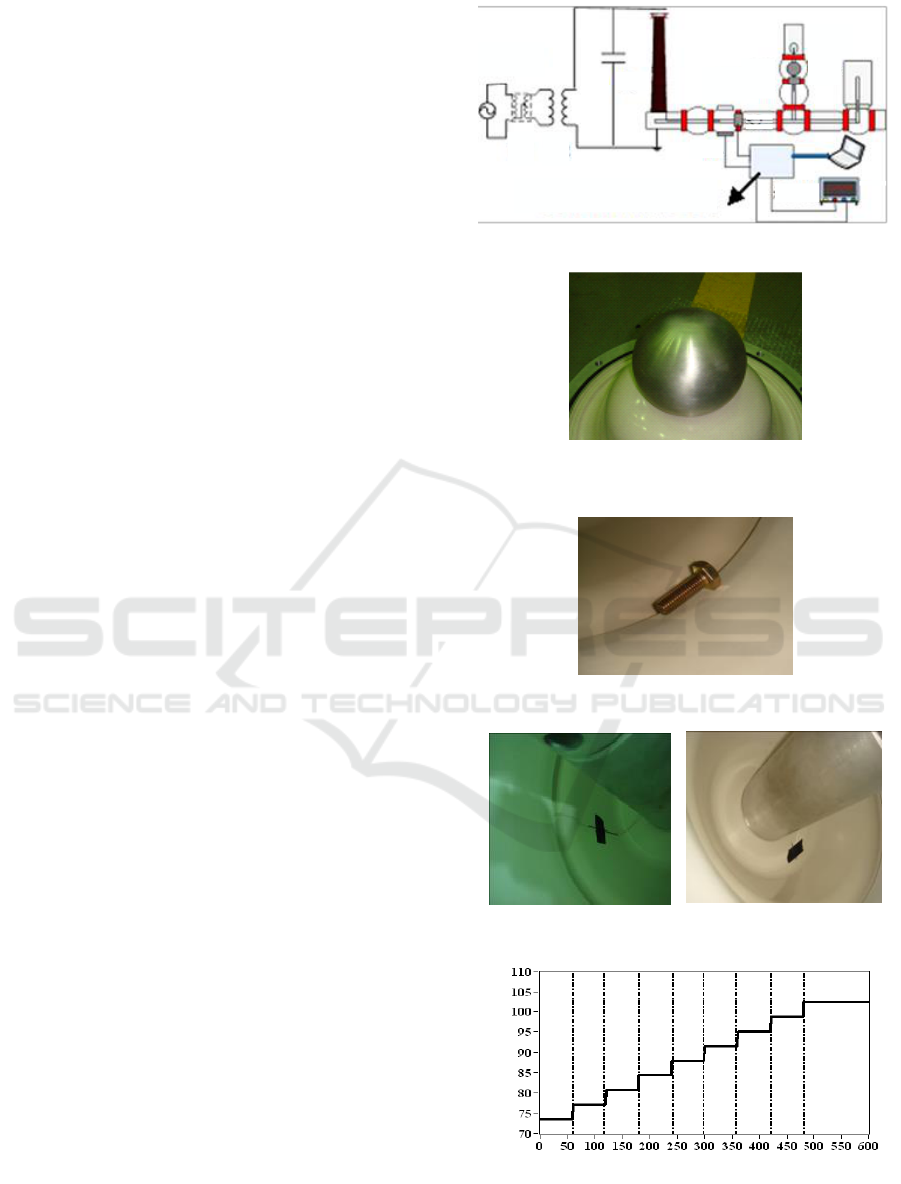
Figure1 shows the 220 kV GIS partial discharge test
platform. TC1 and TC2 are two test chambers for
setting the discharge defect model. S1 and S3 are
internal UHF sensors, and S2 and S4 are external
UHF sensors that receives PD signals radiated by a
defect discharge inside the cavity through a pouring
hole at the disc insulator. The partial discharge
signal coupled by the sensor is processed by the
signal conditioner, then, one channel is connected to
the oscilloscope, and the other is uploaded to the
computer via the embedded data processing unit.
The oscilloscope is Agilent MSO9404A with a
sampling rate of 20 GSa/s and a bandwidth of 4 GHz.
In this experiment, three defect models are
designed, which are the suspension defect on the
high voltage side, surface discharge defect and
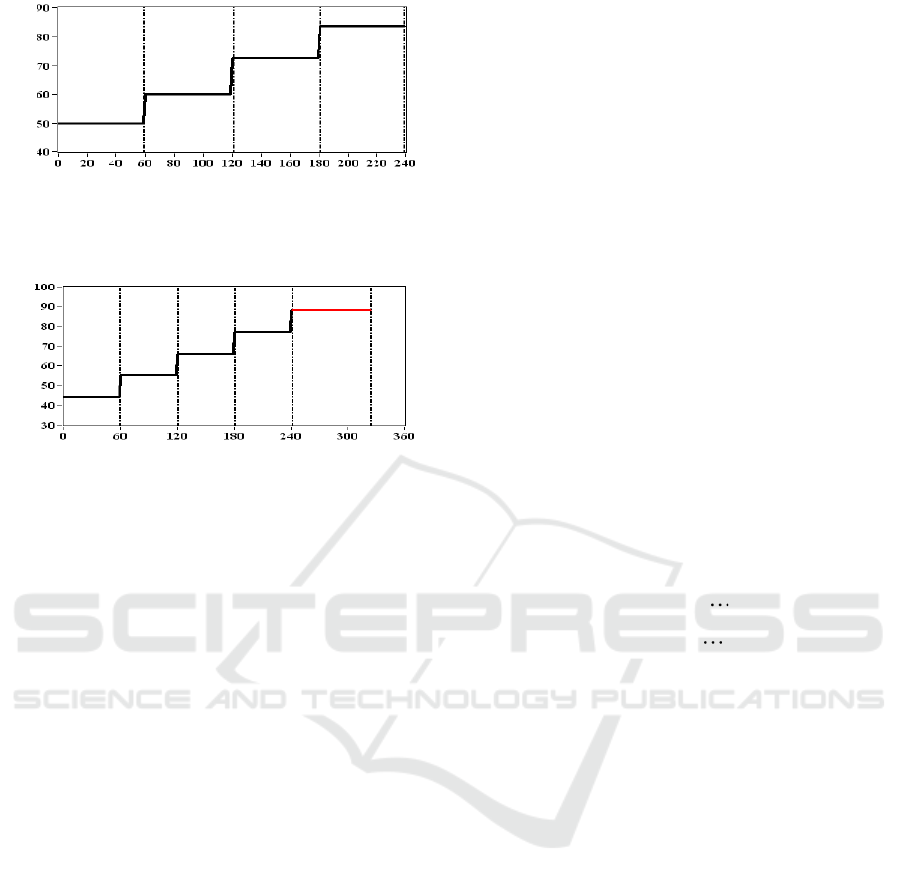
suspension defect on the ground side. The model of
suspension defect on the high voltage side is formed
by placing a shield on the high voltage conductor of
GIS and making the shield contact with the
conductor incompletely. The model of suspension
defect on the ground side is formed by placing the
M10 bolt at the interface between the disc insulator
and the shell of GIS. The surface discharge model is
formed by sticking a 3 cm metal wire on the surface
of disc insulator with sticky tape. Three defect
models are shown in Figure 2, Figure 3 and Figure 4,
respectively. The last step is to place the defect
models in the test chamber filled with SF6 gas with
a pressure of 0.5 MPa.
S4
Signal Conditioning and Embedded
Processing Unit
Oscilloscope
AC220V
T1 T2
TC1
TC2
S3
S1
S2
C0
Figure 1. The schematic of test.
Figure 2 .Suspension defect on the high voltage side in
GIS.
Figure 3. Suspension defect on the ground side in GIS.
Figure 4. Insulation surface discharge defect in GIS.
Applied Votage
/kV
Test Time/min
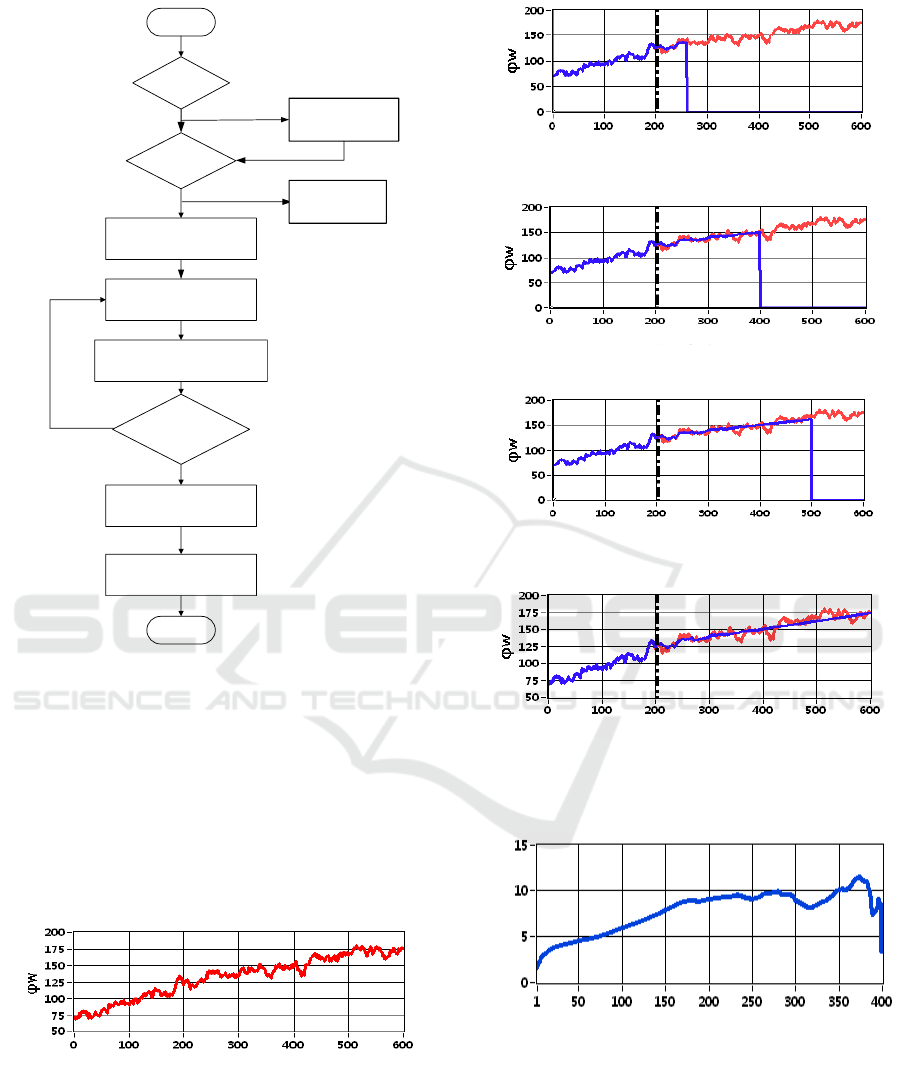
Figure 5.The test voltage curve of suspension defect on the
high voltage side
Application of ARMA Model in Prediction of Development Trend of Partial Discharge
391
Applied Votage
/kV
Test Time/min
Figure 6. The test voltage curve of suspension defect on
the ground side.
Test Time/min
Applied Votage
/kV
Figure 7. The test voltage curve of surface discharge
defect.
2.2 Experimental Process
Firstly, the voltage applied to the high voltage side
of the GIS is slowly increased until stable PD signals
appear, and then the voltage is increased step-by-
step to accelerate the degradation of the defect.
Taking the test of suspension defect on the high
voltage side as an example, when the applied voltage
reaches73.5kV, relatively stable PD signals appeared.
Then the voltage was increased step by step and
maintained 1 hour at 73.5, 77, 80.5, 84, 87.5, 91,
94.5, 98kV respectively. Then, in order to further
accelerate the degradation of the defect, the voltage
was raised to 102 kV, and then the test was stopped
after keeping the voltage at 95 kV for 2 hours. The
curve of applied voltage of floating defect is shown
in Figure 5, and the curve of applied voltage of
surface discharge defect and insulator-metal
discharge defect are shown in Figure 6 and Figure7
respectively.
It should be specially noted that in the final stage
of the test of surface discharge, the voltage was risen
to 85 kV, and flashover occurred after 1 hour and 25
minutes.
3 THE PREDICTION PRINCIPLE
OF ARAM MODEL
3.1 ARMA Model
Auto-regressive and moving average (ARMA)
Model is a kind of stochastic time series model,
which is widely used in various fields (Yang, Chen,
Shen, 2018; Kang, Qi, Liu, 2012). It usually uses the
random characteristics of time series to describe the
evolution of a phenomenon, that is, it uses the past
and current values of time series and the weight of
the random disturbance factor to model and predict
the evolution of time series. ARMA is an important
method to study time series.
Auto-regressive (AR) model and moving average
(MA) model are important time series model. The
AR model predicts future values by a linear
combination of past observations and current
interference values, and the MA predicts future
values by a linear combination of past interference
values and current interference values. ARMA
model is a combination of AR model and MA model,
and its mathematical formula is
(1)
In this formula, yt is time series; Φi and θi (i=
1,2 3…….p) is indefinite coefficient, p and q are
order of the model; εt is the deviation due to
interference.
Some time series are sets of time-dependent
variables. Although there is uncertainty in the single
value of the time series, the whole sequence changes
regularly which can be described by relevant
mathematical models. That is the basic idea of using
ARMA model to predict the development trend of
partial discharge. Mathematical models help to
understand the structure and characteristics of time
series fundamentally, and contribute to obtain the
optimal prediction in the sense of minimum variance.
Therefore, it is very suitable to analyze short-term
process of PD by means of math models and predict
the development trend.
3.2 Procedures of Modeling
Procedures of modeling is shown in Figure 8 and
detailed steps are as follows.
1 1 2 2
1 1 2 2
t t t p t p
t t t q t q
y y y y
ICVMEE 2019 - 5th International Conference on Vehicle, Mechanical and Electrical Engineering
392

(1) Calculate the values of the sample auto
correlation function (ACF) and the sample partial
auto correlation function (PACF).
The formula of ACF is
(2)
And the formula of PACF is
(3)
There are two matrix in the formula of PACF,
those are
11
12
12
ˆ ˆ
1
ˆ ˆ
1
ˆ
ˆ ˆ
1
k
k
kk
D
(4)
And
(5)
(2) Selected and fitting the ARMA (p, q) model
with appropriate order according to the characters of
the ACF and PACF.
(3) Estimate the values of indefinite coefficient
in the model.
After fitting the model, the next step is to
estimate the unknown coefficient in the model.
(4) Verify the validity of the model.
A valid model means that the model contains
almost all the information of the data, so that the
residual does not contain any relevant information,
this is, residual is white noise series. Therefore,
white noise test need to be performed for the
residual of fitted model. If the results of the test
show that the residual is not white noise, the model
is considered to be not valid.in this case, other
models need to be considered.
If the fitted model passes the white noise test,
then steps (2)-(4) continue to be performed to
establish multiple fitted models with full
consideration of various possibilities. and selecting
the optimal model from all the fitted models that
pass the test.
(5) Optimizing the model.
The optimal model is selected from all the fitted
models that pass the test. Akaike information
criterion (AIC) is a standard used to weigh the
goodness of fit, and evaluate the complexity of the
model and the ability of the model to fit the data.
The more parameters of the model, the wider the
range of models that can be selected and the more
accurate the model is. However, with the increase of
parameters, the parameter estimation is more and
more difficult, and the accuracy of estimation is
getting lower. Therefore, a good model should reach
a certain balance between the accuracy of the model
and the accuracy of parameter estimation.
Usually, AIC is defined as AIC= -2log
(maximum likelihood value of the model) + 2
(number of unknown parameters of the model). The
model with the smallest AIC value is the optimal
model.
(6) Use the fitted model to predict the future
trend of the series.
4 SHORT-TERM PREDICTION
OF PARTIAL DISCHARGE
4.1 Short-term Prediction for Linear
Characteristic Parameters of PD
By processing the test data of the suspension
discharge on the high voltage side, the variation
curve of the discharge phase width is shown in
Figure 9. The discharge phase width varies linearly
with the test time, so its data is selected to evaluate
the accuracy of the development trend of linear
characteristic parameters of PD predicted by the
ARMA prediction model. The total test time is 600
minutes and the data of the first 200 minutes is used
to model and predict the development trend of
partial discharge phase width in different time
periods.
1
2
1
( )( )
ˆ
()
nk
t t k
t
k
n
t
t
x x x x
xx
ˆ
ˆ
ˆ
k
kk
D
D
11
12
12
ˆ ˆ
1
ˆ ˆ
1
ˆ
ˆ ˆ ˆ
k
k k k
D
Application of ARMA Model in Prediction of Development Trend of Partial Discharge
393
Translate into
stable series
Y
N
N
Abandon the
time series
Y
Y
N
START
STOP
Time series
is stable
Pass white
noise test
Verify model
validity
Calculate ACF and PACF
Fitting ARMA model
Estimate unknown coefficient
Optimizing the model
predict future tendency
Y
Figure 8. ARMA modeling process.
As can be seen from Figure 10, the predicted
values differ little from the true values with different
prediction times. It can be seen from the relationship
between the prediction time and the prediction error
shown in Figure 11. In the range of the prediction
time of 0-400, the prediction error is kept within
10%, which indicates that for the linearly varying
partial discharge characteristic parameter, it is
feasible to predict short-term trend by ARMA model.
Test Time/min
Figure 9. The change trend of phase width of suspension
discharge on the high voltage side.
Test Time/min
(a) The curve of 50 minutes prediction
Test Time/min
(b) The curve of 200 minutes prediction
Test Time/min
(c) The curve of 300 minutes prediction
Test Time/min
(d)The curve of 400 minutes prediction
Figure 10. Predicted curves in different prediction time.
Prediction Time/min
Prediction Error
/%
Figure 11. Predicted error with different prediction time.
4.2 Short-term Prediction for Step
Characteristic Parameters of PD
By processing the test data of the suspension
discharge on the ground side, the variation curve of
the discharge interval number is shown in
ICVMEE 2019 - 5th International Conference on Vehicle, Mechanical and Electrical Engineering
394
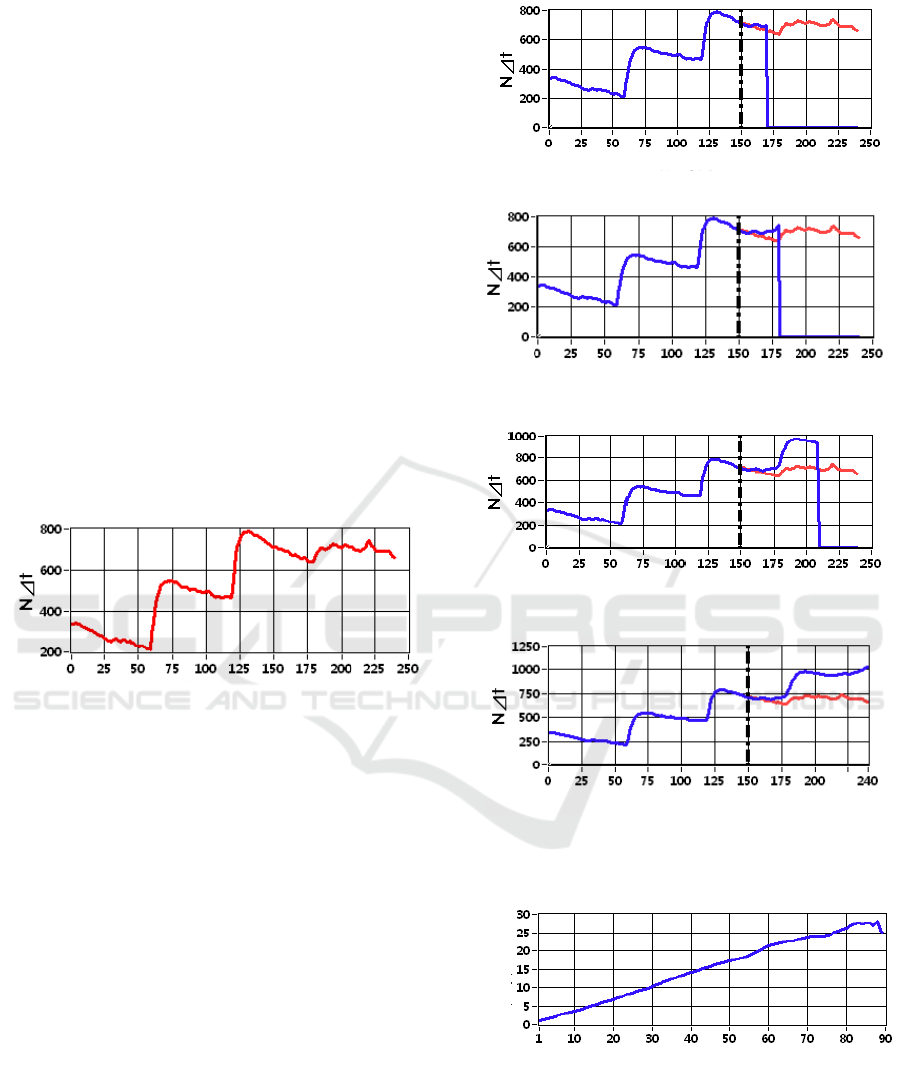
Figure12.The discharge interval number of the
insulator-metal discharge step increase with the test
time, so its data is selected to evaluate the accuracy
of the development trend of step characteristic
parameters of PD predicted by the ARMA prediction
model. The total test time is 240 minutes and the
data of the first 150 minutes is used to model and
predict the development trend of discharge interval
number in different time periods.
It can be seen in the Figure 13 that as the
prediction time increases, the difference between the
predicted value and the true value gradually widens.
As shown in Figure 14, when the prediction time is
less than 30 minutes, the prediction error can be kept
within 10%, and then the error increases with the
extension of the prediction time. The reason of
increase of subsequent prediction error is that the
third step of the true value changes less than the first
two. In general, the ARMA model cannot accurately
determine the size of the step, but it can predict the
development trend of step characteristic parameters
of partial discharge roughly.
Test Time/min
Figure 12. The change trend of discharge interval number
of suspension discharge on the ground side.
4.3 Short-term Prediction for Irregular
Characteristic Parameters of PD
By processing the test data of the insulation surface
discharge, the variation curve of the information
entropy of discharge amplitude is shown in Figure
15. The information entropy of insulation surface
discharge amplitude increase with the test time
irregularly, so its data is selected to evaluate the
accuracy of the development trend of irregular
characteristic parameters of PD predicted by the
ARMA model. The total test time of insulation
surface discharge is 386 minutes and the data of the
first 250 minutes is used to model and predict the
development trend of discharge interval number in
different time periods.
Test Time/min
(a) The curve of 20 minutes prediction
Test Time/min
(b) The curve of 30 minutes prediction
Test Time/min
(c) The curve of 60 minutes prediction
Test Time/min
(d) The curve of 90 minutes prediction
Figure 13. Predicted curves in different prediction time.
Prediction Time/min
Prediction Error
/%
Figure 14. Predicted error in different prediction time.
It can be seen from Figure 16 and Figure 17 that
as the prediction time increases, the difference
between the predicted value and the true value
increases rapidly, and the prediction error is greater
than 10%, which indicates that it is difficult for the
Application of ARMA Model in Prediction of Development Trend of Partial Discharge
395
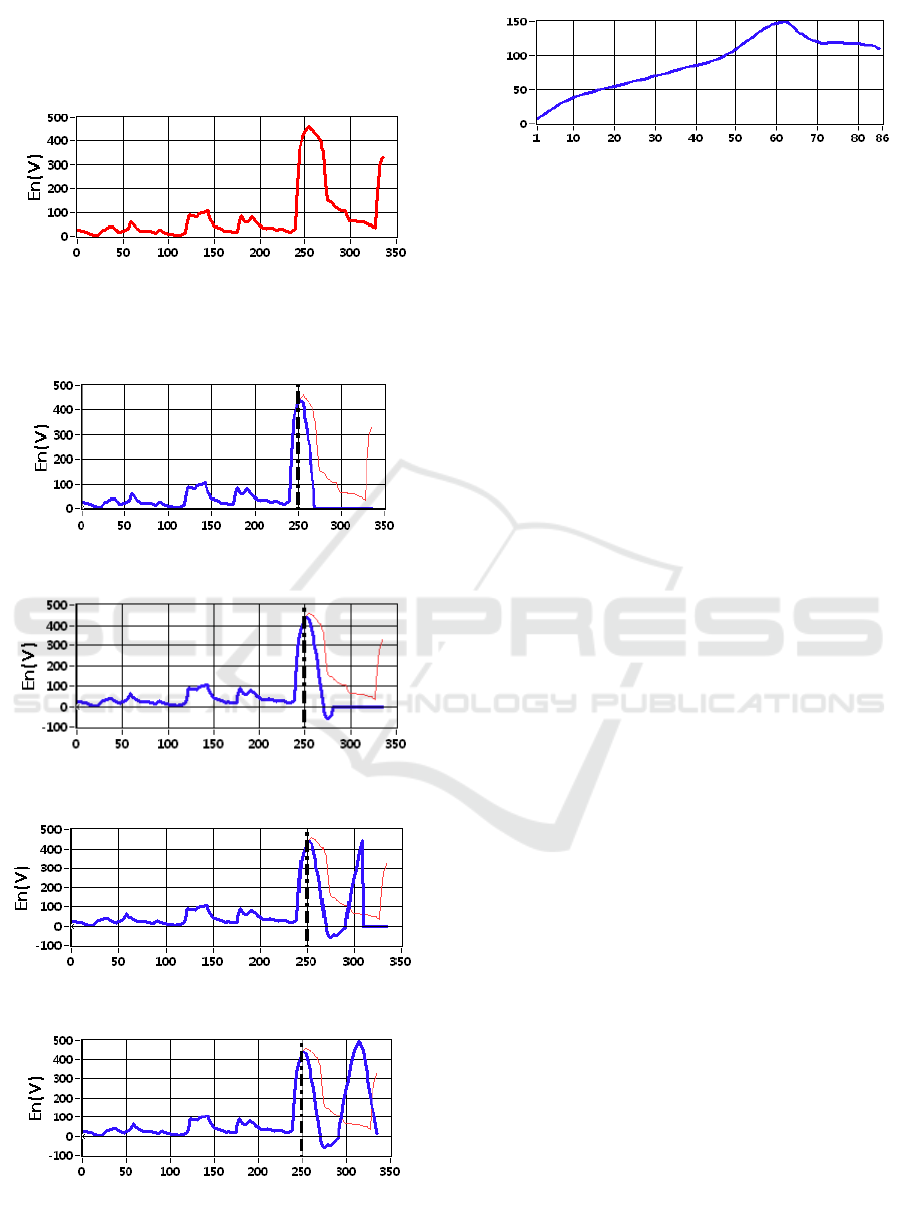
ARMA model to accurately predict the trend of
irregular characteristic parameters. However, the
ARMA model can predict the approximate trend, as
shown in Figure 16.
Test Time/min
Figure 15. The change trend of entropy of insulator
surface discharge amplitude width with test time.
Test Time/min
(a) The curve of 20 minutes prediction
Test Time/min
(b) The curve of 30 minutes prediction
Test Time/min
(c) The curve of 60 minutes prediction
Test Time/min
(d) The curve of 86 minutes prediction
Figure 16. Predicted curves in different prediction time.
Prediction Time/min
Prediction Error
/%
Figure 17. Predicted error in different prediction time.
5 CONCLUSION
In order to obtain the partial discharge data of
typical defects, a partial discharge test platform
containing three kinds of defects and was built in
this paper, and experiments were carried out.
Aiming at the early warning of fault caused by
partial discharge defect, the ARMA model
prediction theory and the process of modeling are
introduced in detail. Based on the obtained partial
discharge data, the ARMA model was used to
predict the development trend of partial discharge,
and the prediction results were analysed. Finally, the
following conclusions were obtained.
(1) The effect of short-term prediction of ARMA
model is different for the characteristic parameters
with different development trends. For linear
characteristic parameters of partial discharge, the
ARMA model can accurately predict the short-term
trend of the characteristic parameters, and the
prediction error is smaller; for the partial discharge
characteristic parameters with step change, when the
prediction time is less than 30 minutes, the
prediction error is less than 10%. But the prediction
error will increase with the extension of the
prediction time. For the irregular characteristic
parameters of partial discharge, the prediction effect
of ARMA model is not good. The ARMA model can
roughly predict short-term trend of irregular
characteristic parameters, but it is difficult to make
accurate prediction.
(2) In the substation, the on-line detection system
can collect the partial discharge signal in real time
and analyse the variation trend of the typical
characteristic parameters. Based on these parameters,
appropriate prediction model can be selected to
predict the development trend of the partial
discharge, which is of great significance for fault
warning and stable operation of electrical equipment.
ICVMEE 2019 - 5th International Conference on Vehicle, Mechanical and Electrical Engineering
396

ACKNOWLEDGEMENTS
This research was supported by the Science and
Technology Projects of Test & Maintenance Center
of CSG EHV Transmission Company (Grant No.
CGYKJXM20160025).
REFERENCES
Bolin, P., and Koch, H.. 2005. Introduction and
applications of gas insulated substation (GIS), IEEE
Power Engineering Society General Meeting.
Кучинский, Г. С., 1984. Partial discharge of high voltage
electrical equipment, China Water Conservancy and
Electric Power Press.
Kang, H. , Qi, Y. , Liu, G., et al., 2012. Application of the
ARMA Model in Non-stationary Vibration Signals.
International Conference on Quality, IEEE..
Li. J., Sun, C.X., Du, L., et al., 2002. Study on Fractal
Dimension of PD Gray Intensity Image. Proceedings
of the CSEE, 22, p. 123-127,.
Liu, Y.P., Lv, F.C., and Li, C.R., 2004. Study on pattern
spectrum of patial. Proceedings of the CSEE, 24,
p.179-183.
Liu, Y. P., Wang, Z. J., Li, Y. S., 2013. Study on the
Insulating Spacers Surface Discharge of GIS. Applied
Mechanics and Materials, 385-386, p. 1209-1212.
Martin, Y., Li, Z., Tsutsumi, T., et al.,2012. Detection of
SF6 Decomposition Products Generated by DC
Corona Discharge Using a Carbon Nanotube Gas
Sensor. IEEE Transactions on Dielectrics and
Electrical Insulation, 19, p. 671-676.
Okubo, H., Kato, T., Hayakawa, N., et al., 1998. Temporal
Development of Partial Discharge and Its Application
to Breakdown Prediction in SF/sub 6/ gas. IEEE
Transactions on Power Delivery, 13, p. 440-445.
Pharmatrisanti, A., Meijer, S., and Smit, J. J., 2004.
Probability of Partial Discharge Detection in Aged
GIS due to Void in Epoxy. Gaseous Dielectrics X.
Springer US.
Qiu, Y.C., 1994. GIS device and its insulation technology,
China Water Resources and Electric Power Press.
Qi, B., Li, C.R., Hao, Z., et al., 2011. Evolution
phenomena and features of surface partial discharge
initiated by immobilized metal particles on GIS
insulators, Proceedings of the CSEE, 31(1), p. 101-108.
Qi, B., Li, C.R., Xing, Z.L., et al., 2014. Partial Discharge
Initiated by Free Moving Metallic Particles on GIS
Insulator Surface: Severity Diagnosis and Assessment.
IEEE Transactions on Dielectrics and Electrical
Insulation, 21, p. 766-774.
Ren, M., Dong, M., and Qiu A.C., 2014. Partial
Discharges in SF6 Gas Filled Void under Standard
Aperiodic and Oscillating Switching Impulses. IEEE
Transactions on Dielectrics and Electrical Insulation,
21, p. 262-272.
Strachan, S.M., McArthur, S.D.J., Judd, M.D., et al, 2005.
Incremental Knowledge-based Partial Discharge
Diagnosis in Oil-filled Power Transformers.
Intelligent Systems Application to Power Systems, 130,
p.181-186.
Tang, Z.G., Tang, M.Z., Li, J.Z., et al, 2017. Review on
Partial Discharge Pattern Recognition of Electrical
Equipment. High Voltage Engineering, 7, p.173-187.
Yang, Q., Chen, S.Z., Shen, S.M., et al., 2018.
Adaptability of LSTM Network and ARMA Modeling
to Random Error Prediction of Inertial Devices.
Electronics Optics & Control, 25, p. 68-72.
Zhou, Q., Tang, J., Tang, M., et al, 2006. Mathematical
Model of Four Typical Defects for UHF Partial
Discharge in GIS. Proceedings of the CSEE, 26, p. 99-
105.
Application of ARMA Model in Prediction of Development Trend of Partial Discharge
397
