
Dynamic Frequency-selection Clustering of Automatic Multiple
Source Separation based on UHF PD Detection
Deguan Wu
1, a
, Chenhao Zhao
2, b
, Zhiguo Tang
2, c
, Hongyuan Li
1, d
, Hui Xia
1, e
, Kai Pan
1, f
1
Test & Maintenance Center of CSG EHV Transmission Company, Kunming, China
2
State Key Laboratory of Alternate Electrical Power System with Renewable Energy Sources, North China Electric Power
University, Beijing, China
f
345845596@qq.com
Keywords: Partial discharge, Ultra high frequency, multiple signal separation, clustering analysis, electromagnetic
interference.
Abstract: Partial discharge (PD) ultra-high frequency (UHF) on-line monitoring technique is an important resort to
evaluate the insulation condition of the high-voltage power equipment. The presence of a large number of
on-site interference affects the detection sensitivity and reliability, and the interference generated by
discharges are the crucial bottleneck for effective PD detection under complicated electromagnetic
environment, because they have similar time-frequency characteristics as real PD. Therefore, in order to
solve the problem of mutual existence of multiple discharge and their interference to each other, a method
of auto separation of multiple PD is studied in this paper, and the rules and a combined strategy is presented
to make accurate multi-PD separation. The technique of dynamic automated separation of multi-PD is
developed based on digital RF chip by using these rules, then theoretical and experimental verification is
carried out. The results indicate that the clustering technology presented in this paper could realize
automated separation of multiple PD and its accuracy can up to 90 %.
1 INTRODUCTION
Partial discharge (PD) detection has become a key
technology for the detection of insulation status of
high-voltage power equipment such as gas insulated
switchgear (GIS), transformer and power cable (Qin,
Wang, Shao, 1997; Wang, Li, Gao, 2006).
Especially for sudden faults of high-voltage power
equipment, partial discharge detection is much more
effective than oil chromatography analysis and gas
decomposition products detection. However, the
serious electromagnetic interference on the site has
greatly hindered the promotion and application of
the technology of PD on-line monitoring (Guo, Wu,
Zhang, 2005; Zhang, 2017; Liu, Wang, Li, 2013).
Due to insufficient interference identification
performance and anti-interference performance, the
effect of the current PD monitoring device in the
substation is unsatisfactory, and the misjudgment
and missed detection of PD occur from time to time
on the site (Tang, Wang, Li, 2009; Dey, Chatterjee,
Chakravorti, 2010; Wang, Tang, Chang, 2012).
Based on a large number of field tests, the author
found that although the UHF detection technology
has good anti-interference ability for low-frequency
signals, there are still a lot of interferences in the
frequency band of UHF detection in the field (Lu, Li,
Tang, 2017; Tang, Jiang, Ye, 2017). The existence
of a large number of discharge interferences is still
the main cause of misjudgment and missed detection
of partial discharge, and the time-domain
characteristics and frequency domain characteristics
of discharge interferences are similar to that of PD
signals of the detected equipment, so conventional
filtering methods are ineffective for such
interferences. However, differences in signal sources
and propagation paths can result in subtle diversity
in the time domain waveforms and frequency spectra
of different pulse signals. Clustering and separating
multi-source signals that are superimposed and
similar in characteristics, and then performing
separate statistics and feature identification for each
type of signal is an effective way to eliminate and
reduce the effects of such interference (Tang, Wang,
Chang, 2012).
382
Wu, D., Zhao, C., Tang, Z., Li, H., Xia, H. and Pan, K.
Dynamic Frequency-selection Clustering of Automatic Multiple Source Separation based on UHF PD Detection.
DOI: 10.5220/0008856003820389
In Proceedings of 5th International Conference on Vehicle, Mechanical and Electrical Engineering (ICVMEE 2019), pages 382-389
ISBN: 978-989-758-412-1
Copyright
c
2020 by SCITEPRESS – Science and Technology Publications, Lda. All rights reserved
For multi-source partial discharge detection,
scholars have proposed a variety of representative
methods, such as equivalent time-frequency (T-F)
analysis, 3-phase synchronous contrast method,
multi-frequency detection and so on(Cavallini and
Montanari,2005; Herold, Wenig, Leibfried, 2010).
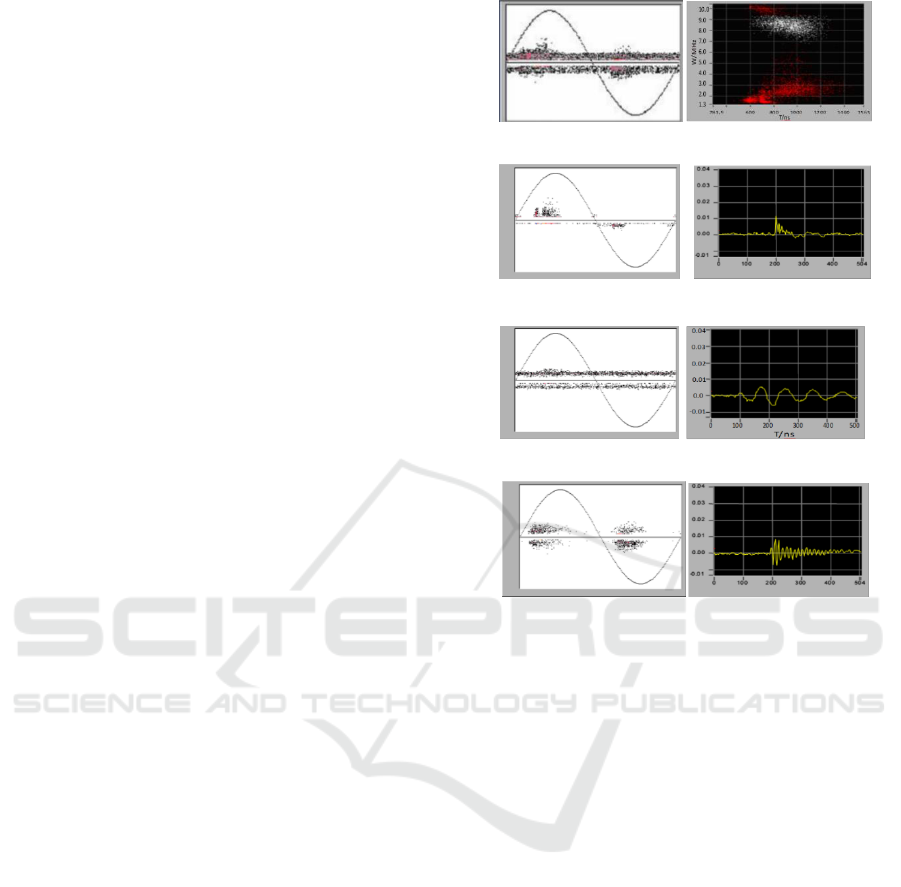
Figure1 is a schematic diagram of multiple-sources
PD separation of Italian Techimp Company, which
is achieved by T-F clustering for high-frequency
current detection. In Figure 1, Figure 1(a) is the
PRPD spectrum of multi-sources PD and its T-F
spectrum, and (b), (c), (d) are the PRPD spectra and
waveform of three types of discharge separated from
multi-sources PD. Omicron Company in Austria
uses the amplitude relationship and the arrival time
of the three-phase synchronous signals to perform
multi-sources PD separation, as shown in Figure 2.
In China, Si Wenrong et al. of Xi'an Jiaotong
University used the least squares support vector
machine (LS-SVM) to detect and identify multi-
sources PD in GIS, which is based on time-
frequency feature extraction for PD pulses and
competitive learning network unsupervisory
clustering to realize rapid classification of pulse
groups, and the simulation and experimental results
verify the feasibility and practicability of the
technique (Si, Li, Li, 2009). Yang Lijun et al. used
fuzzy C-mean (FCM) clustering method to obtain
the pulse classification on the T-F map and chose the
membership degree as the index to separate signals
and to realize the separation and recognition of
multiple PD sources(Yang, Sun, Liao,2010). Xiao
Yan et al. of Shanghai Jiaotong University used the
Laplace wavelet-based matching pursuit algorithm
to extract the starting time, oscillation frequency and
attenuation coefficient of a single PD signal to
determine whether the PD pulse is from the same
source as other pulses (Xiao, Huang, Yu, 2005).
At present, the separation method of multi-
source PD pulses is mostly applicable to the PD
signals detected by high-frequency (HF) detection
method, and is a manual selection method, so it is
complicated to realize on site.
The cluster analysis of the existing multi-
discharge power supply is mostly only applicable to
the high-frequency current detection mode, and the
manual selection method is adopted, which has the
disadvantage of complicated operation. Therefore,
under complex electromagnetic interference
environment, it is of great engineering and practical
value to explore the automatic multi-source
discharge separation method based on UHF partial
discharge detection technology.
(a) The PRPD spectrum of multi-sources PD and its T-F
spectrum
(b) The PRPD spectrum and waveform of A type
discharge
(c) The PRPD spectrum and waveform of B type
discharge
(d) The PRPD spectrum and waveform of C type
discharge
Figure 1. TF Clustering of TechImp PD detection.
2 CLUSTERING ANALYSIS
METHOD
Clustering analysis is a kind of multivariate
statistical analysis and an important branch of
unsupervised pattern recognition. It is the most
widely used in many fields such as pattern
classification, image processing and fuzzy rule. The
cluster analysis method divides samples in a sample
set without category marks into several classes
according to a certain criterion, so that similar
samples are classified into one class. Therefore,
cluster analysis can be used to realize automatic
separation of multi-source discharge signals.
2.1 Fuzzy C-means Clustering
Algorithm
The fuzzy c-means clustering (FCM) algorithm is a
clustering algorithm that uses membership degree to
determine the extent to which each sample point
belongs to a certain class. In order to optimize the
Dynamic Frequency-selection Clustering of Automatic Multiple Source Separation based on UHF PD Detection
383
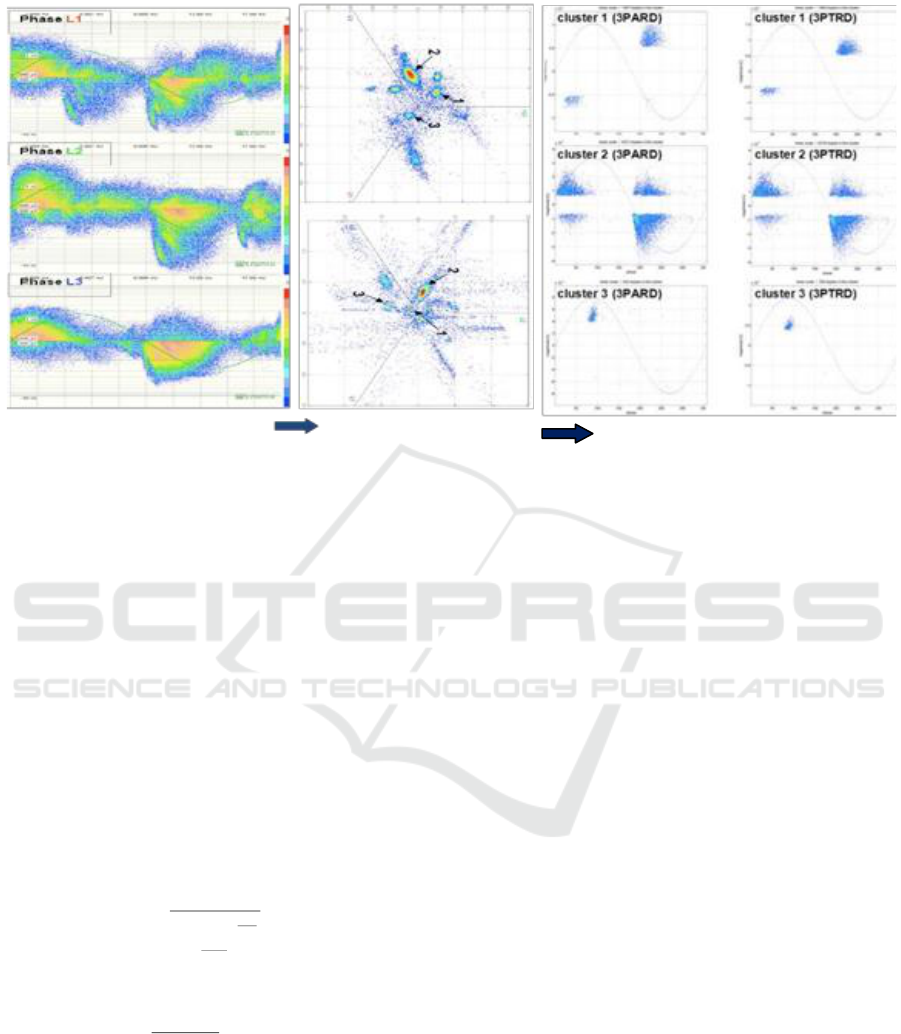
Spectrum of three-phase
synchronous signals
clustering result of three-phase
synchronous signals
PRPD spectrum of different PD cluster
3-PAPD
3-PTPD
Figure 2. Multi-PD Clustering of Omicron.
classification results, FCM divides n vectors xi (i=1,
2, ..., n) into c fuzzy groups, finds the cluster center
of each group, and minimizes the value function of
the non-similarity index. The value function (or
objective function) of FCM is shown as (1).
c
i
n
j
ij
m
ij
c
i
ic
duJccUJ
1
2
1
1
),...,,(
(1)
Where uij is between 0 and 1; ci is the cluster
center of fuzzy group I, and dij=||ci-xj|| is the
Euclidean distance between the ith cluster center and
the jth data point; m∈[1, ∞)is weighted index, and
m is 2 in this paper.
c
j
m
jk
ik
ik
d
d
u
1
1
2
1
(2)
(3)
After the clustering number c is given and the
clustering prototype C is initialized , using (2) and
(3) , the optimal fuzzy classification matrix and
cluster center can be obtained by iterative
calculation, according to that, the signal is divided
into c classes(Kuo, Lin, Zulvia,2018).
2.2 Gauss Mixture Model Clustering
Algorithm
The principle of the Gauss mixture model clustering
(GMM) algorithm is to assume that the distribution
of the sample conforms to the Gaussian mixture
model, and by fitting the sample data, to determine
the parameters of each Gaussian component. Each
Gaussian component is equivalent to a fuzzy cluster,
by calculating the probability that each sample agree
with the distribution of each Gaussian component to
determine the classification of the sample (Ma, Jie,
Hu, 2017).
The Gaussian mixture model is defined as a
linear combination of M Gaussian density functions,
as (4).
1
( ) ( ; , )
M
i i i i
i
P x N x
(4)
Where Ni(x, μi, ∑i) is a Gaussian distribution
with a mean of μi and a covariance of ∑i. πi is a
mixed parameter, which is regarded as the weight of
the i-th Gaussian distribution and represents the
prior probability, as (5).
1
11
M
ii
i
且0
,
1
11
M
ii
i
且0
(5)
xu
u
c
m
n
k
ik
n
k
m
ik
i
1
1
1
ICVMEE 2019 - 5th International Conference on Vehicle, Mechanical and Electrical Engineering
384

The probability density function of Ni(x, μi, ∑i)
is as (6).
/2
1/2
1
11
( ) exp ( ) ( )
2
(2 )
d
i
T
i i i i
N x x x
(6)
Let all the parameters to be determined in the
Gaussian mixture density function be c, then the
likelihood function is as (7).
1
( | ) ( | ) argmax ( | )
N
i
i
P X P x P X
(7)
In order to simplify the problem, the maximum
value of (8) can be calculated.
1 1 1
log( ( | )) log ( | ) log( ( ; , ))
N N K
i k i k k
i i k
p X p x N x
(8)
2.3 GK Fuzzy Clustering Algorithm
Let the element xk(1≤k≤N) in the set X={x1,
x2,……,xN} have n features, that is xk={xk1,
xk2,……,xkN }. If the set is classified into c(1≤c≤N)
classes, let V={v1, v2,……,vc}to be cluster centers,
let U=[uik]c×N to be the membership matrix, where
the element uik (0 ≤ uik ≤ 1) indicates membership
that the kth element belongs to the ith class(0≤ I ≤ c),
and uik satisfies the condition of (9) and (10). The
criteria of GK fuzzy clustering (GKFC) is iteratively
adjusted to minimize the objective function, and
objective function is (11).
(9)
(10)
(11)
Distance norm is:
(12)
Where Ai is an positive definite matrix and
determined by the cluster covariance matrix Fi, and
Ai and Fi, are as (13) and (14).
1
1
[ det( )]
p
i i i i
A F F
(13)
1
1
( ) ( )( )
()
N
mT
ik k i k i
k
i
N
m
ik
k
u x v x v
F
u
(14)
Where, ρi is a constant and m (m≥1) is a fuzzy
index. The eigenvalues and eigenvectors of the
covariance matrix represent information about the
shape of the cluster.
The Lagrange multiplication is used to optimize
the objective function, and obtain the (U, V) that
lead objective function has a minimum point.
2.4 Fuzzy Maximum Likelihood
Clustering Algorithm
Pre-processing steps of fuzzy maximum likelihood
clustering algorithm (GKL) are similar to the FCM,
and the following steps are the following five steps
(Savchenko, 2017).
(1) Compute the center of cluster
1
1
( 1)
,1
( 1)
()
()
N
w
k
l
k
i
N
w
k
l
X
ik
v i c
l
ik
u
u
≤ ≤
(15)
(2) Compute fuzzy covariance matrix
T
1
()
1
1
1
,1
N
w
ll
l
ik k i k i
k
i
N
w
l
ik
k
u x v x v
F i c
u
≤ ≤
(16)
(3) Calculated distance
det
T
2
1
1
, exp
2
F
wi
ll
D X V X V F X V
ik
k i k i wi k i
i
(17)
Where 1 ≤ i ≤ c, 1 ≤ k≤ N.
(4) Update fuzzy partition matrix
()
2( 1)
1
1
()
l
ik
c
m
ik jk
j
DD
(18)
The iteration is terminated until ||U (l)- U(l-1)||
<ε.
The above several clustering methods have
different adaptability to different problems. In
practice, there are some problems such as the
1
0
N
ik
k
uN
1
1
N
ik
k
u
2
11
( , , : ) ( )
cN
m
m ik ik
ik
J U V A X u D
2
( ) ( )
T
ik k i i k i
D x v A x v
Dynamic Frequency-selection Clustering of Automatic Multiple Source Separation based on UHF PD Detection
385
number of clusters need to be determined manually,
the selection of the initial cluster center has too
much influence on the results ,and it is difficult to
achieve the clustering of the data with arbitrary
types and so on, which often lead to incorrect
classification results. Therefore, it is still unable to
meet the requirements of the technology of
automatic multi-source PD separation.
3 INTELLIGENT DYNAMIC
CLUSTERING SEPARATION
OF MULTI-SOURCE
DISCHARGE SIGNALS
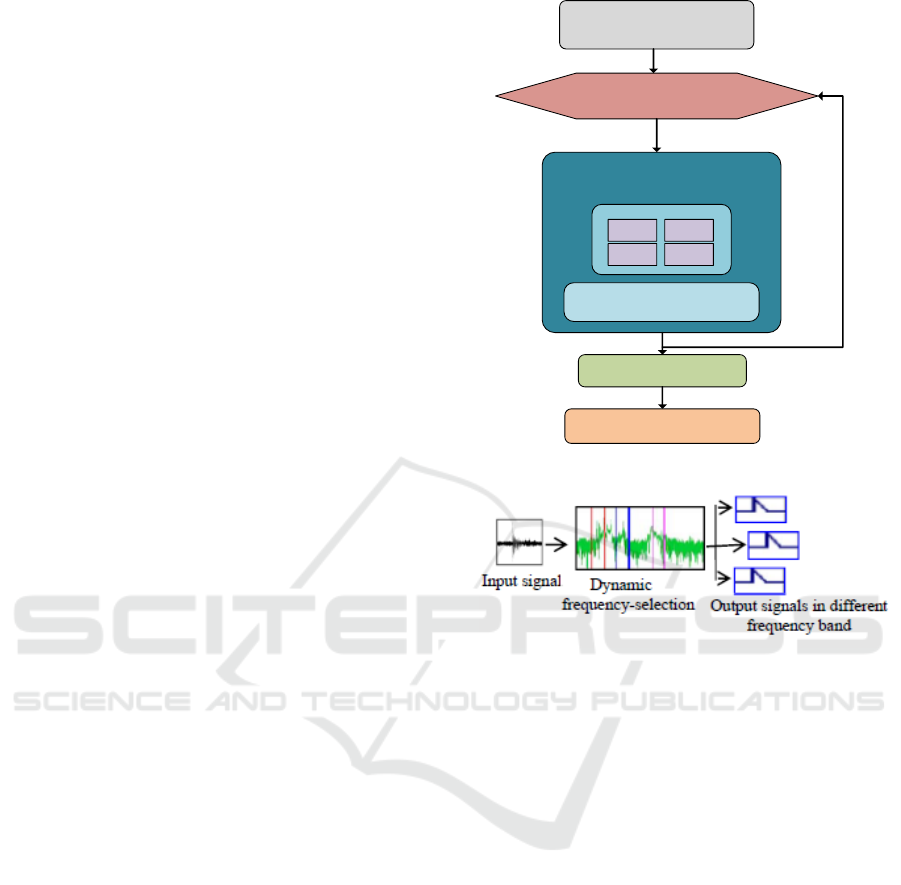
3.1 Intelligent Dynamic Clustering
Strategy
An intelligent dynamic clustering strategy is
proposed in this paper to achieve automatic
optimization of clustering methods and cluster
numbers, as shown in Figure 3.
3.2 New condition Based on Dynamic
Frequency-selection Detection
The conditioner includes three independent local
oscillator sources, and realizes scanning the full-
band of UHF in a 10MHz step by serial control to
find a frequency center with high signal-to-noise
ratio (SNR), which is equivalent to three
programmable adjustable bandpass filter amplifier.
The conditioner has the hardware foundation for
dynamic frequency-selection clustering according to
signal frequency distribution difference, which
avoids many kinds of complicated interferences on
the scene.
The dynamic range of the conditioner is -
70dBm~10dBm and the maximum sensitivity is -
73dBm. The preamplifier has an analog bandwidth
of 300M to 2GHz, and the center frequency is
continuously adjustable from 300MHz to 1.8GHz.
The intermediate frequency signal is amplified by
100MHz low-pass filtering. The schematics of the
structure of the partial discharge UHF conditioner is
shown in Figure 4.
Input cluster sample set
Input the number of cluster
Choosing the optimal
clustering algorithm
FCM GMM
GK FML
Clustering effectiveness
index analysis
Determine the optimal
number of clusters
Output optimal clustering
results
c+1
Figure 3. Flowchart of smart dynamic clustering.
Figure 4. Schematic diagram of the UHF PD signal
conditioner.
3.3 Feature Quantities and Validity
Index of Clustering
The normalized energy fractions for the low
frequency band, medium frequency band, and high
frequency band are defined respectively as
E1=V1/(V1+V2+V3), E2=V2/(V1+V2+V3) and
E3=V3/(V1+V2+V3).
The three-dimensional vector E (E1, E2, E3) is
mapped to the two-dimensional data space to obtain
a two-dimensional vector J (J1, J2), which is used as
a feature quantity of clustering.
The partition coefficient (PC) and classification
entropy (CE) are selected to evaluate the clustering
results in this paper. The PC is used to judge the
degree of separation between the clusters and the CE
is used to calculate the ambiguity of the
classification cluster. In the case where the number
of clusters is the same, the larger the PC, the better
the classification effect and the smaller the CE, the
better the classification effect. The formula of PC
and CE are as (19) and (20).
ICVMEE 2019 - 5th International Conference on Vehicle, Mechanical and Electrical Engineering
386
c
i
N
j
ij
N
cPC
1 1
2
)(
1
)(
(19)
11
1
( ) log( )
cN
ij ij
ij
CE c
N
(20)
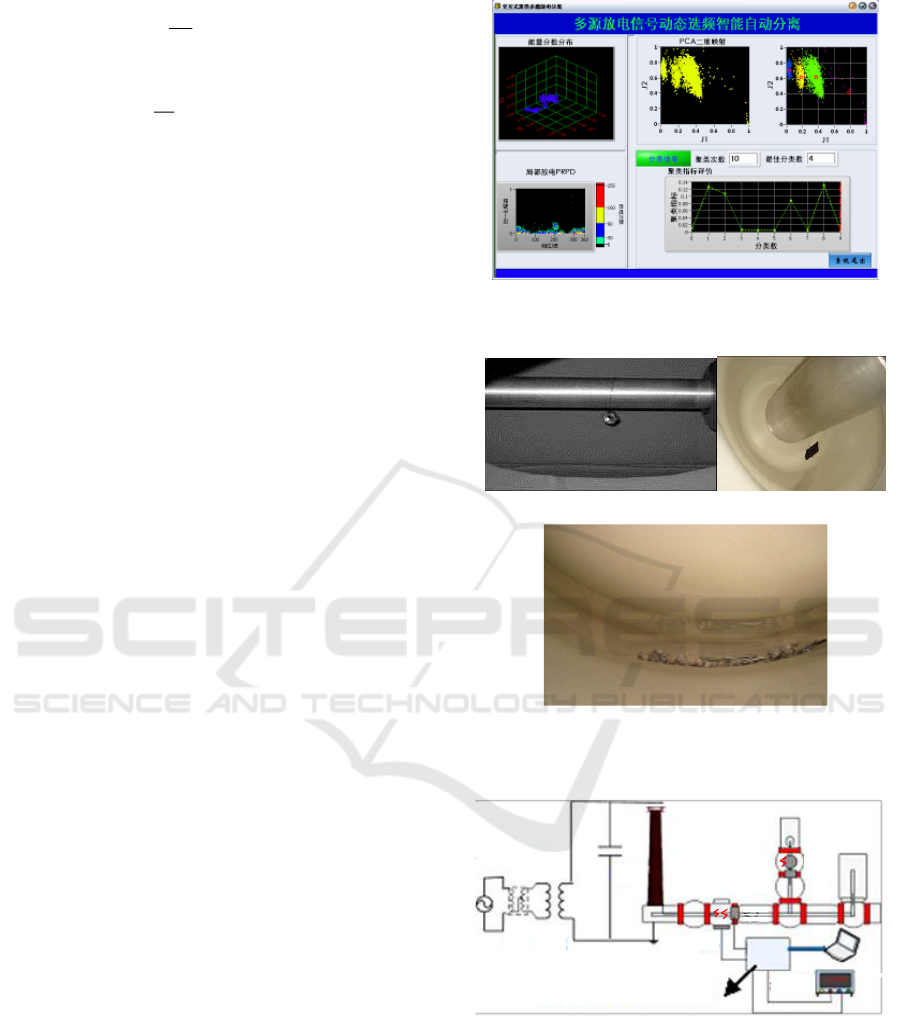
3.4 Software Design
Based on the LabVIEW platform, a software for
intelligent clustering of multi-source discharge
signals is programmed, and the interface of multi-
source signals separation program as shown in
Figure 5. The main functions of the program
includes dimension reduction of three-dimensional
feature vector, normalization of clustering feature
quantities, dynamic and automatic clustering of
multi-source discharge signals, automatic separation
of PD spectra which overlap with each other.
4 VERIFICATION EXPERIMENT
4.1 Experiment Method
A platform is built in this paper to verify the
technology for multi-source PD separation and the
structure of the experimental platform is shown in
Figure 7, where TC1 and TC2 are two chamber of
GIS and S1, S2, S3 and S4 are four UHF sensors.
Three kinds of discharge defects are set in the GIS
cavity to simulate the multi-source discharge which
are floating discharge defect, surface discharge
defect, and metal particle discharge defect and the
floating discharge defect and the surface discharge
defect are set in the chamber TC1, and the metal
particle discharge defect is set in the chamber TC2.
The initial discharge voltages of floating discharge,
surface discharge and metal particle discharge were
determined to be 50, 45, 31kV by preliminary tests,
so the test voltage was 52kV, which ensured stable
discharge of each discharge defect.
Figure 5.Interface of multi-source signals separation
program.
(a) Floating discharge defect (b) Surface discharge defect
(c) Metal particle discharge defect
Figure 6.The mixed discharge defect model.
S4
Signal Conditioning and Embedded
Processing Unit
Oscilloscope
AC220V
T1 T2
TC1
TC2
S3
S1
S2
C0
Figure 7.Experiment platform.
4.2 Experimental Results and Analysis
Through the program control, the three channels of
the signal conditioner are synchronously detected,
and the center frequencies of the three channels are
300M, 700M and 1.2GHz respectively. The energy
fractions of the signals in the three frequency bands
are calculated using the amplitudes of the pulse
Dynamic Frequency-selection Clustering of Automatic Multiple Source Separation based on UHF PD Detection
387
signals detected synchronously through the three
channels, and are plotted in the three-dimensional
view. In order to improve the operation speed, the
PCA method is used to convert the three-
dimensional view into a two-dimensional view, and
then the multi-source PD separation software
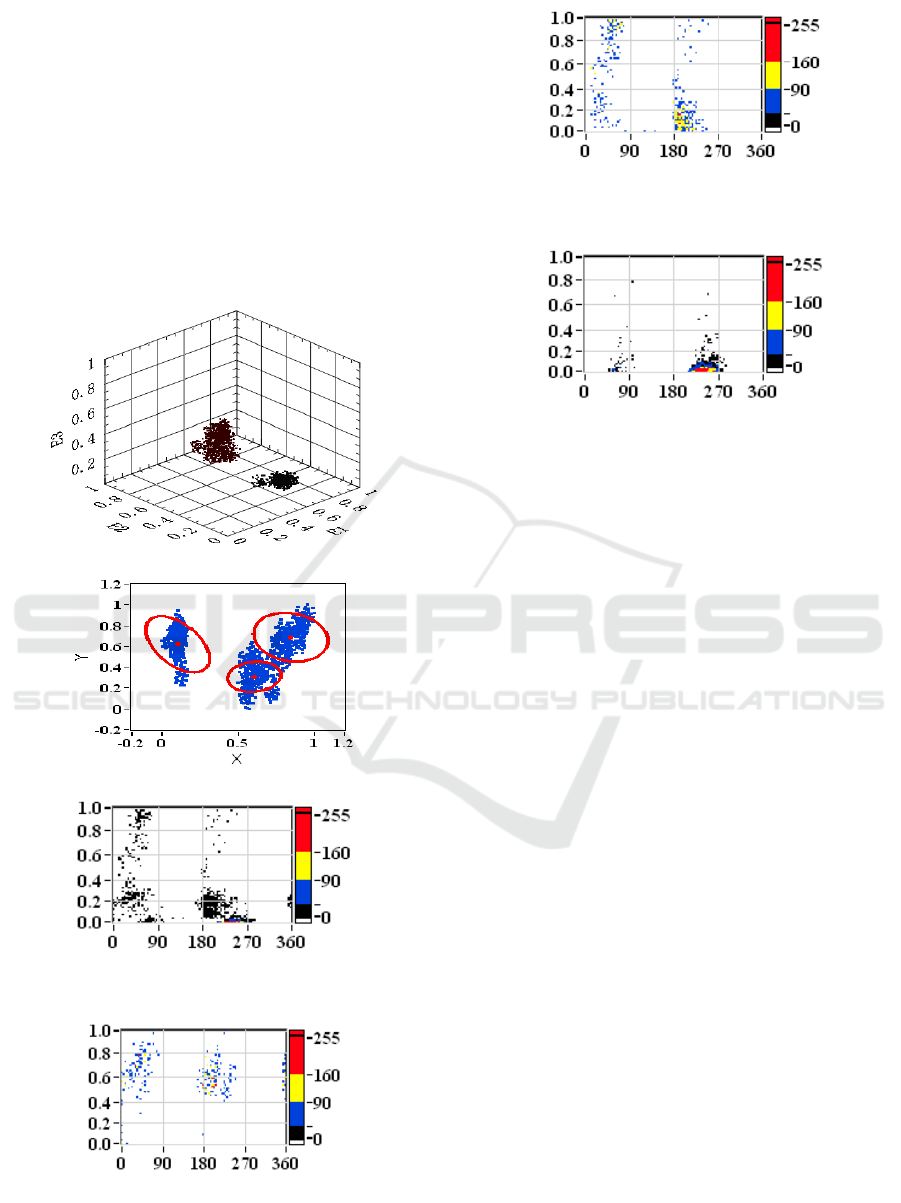
mentioned above is used for three PD signals. Figure
8(a) shows the distribution of energy fractions of all
signals, (b) is a two-dimensional view of energy
fractions, (c) is a superimposed discharge spectrum
that contains three discharge spectra, and (d)-(g) are
three discharge spectra separated from superimposed
discharge spectrum.
(a) Distribution of energy fractions of all signals
(b) Two-dimensional view of energy fractions
Relative amplitude
Phase/degree
Relative discharge
repetition rate
(c) Superimposed discharge spectrum
Relative amplitude
Phase/degree
Relative discharge
repetition rate
(d) Spectrum of floating discharge separated from
superimposed discharge
Relative amplitude
Phase/degree
Relative discharge
repetition rate
(e) Spectrum of metal particle discharge separated from
superimposed discharge
Relative amplitude
Phase/degree
Relative discharge
repetition rate
(f) Spectrum of surface discharge separated from
superimposed discharge
Figure 8. Minimum classification accuracy of any two
type of PD signal.
5 CONCLUSIONS
By analyzing the main causes of missed detection
and false alarm caused by multi-source discharge in
complex electromagnetic environment in substation,
the current status of multi-source discharge
separation technology in the world and main
clustering algorithms are summarized. In addition, a
dynamic frequency-selection clustering method
based on UHF partial discharge detection is
proposed for the problem of automatic separation of
multi-source partial discharge and interference
signals. A 3-channel dynamic frequency selective
UHF conditioner is designed, the normalized energy
fraction is selected as the clustering feature quantity,
the optimal clustering method is selected from the
four clustering algorithms of FCM, GMM, GK and
FML according to the clustering index. So that the
automatic clustering and intelligent separation
technology of multi-source discharge is realized.
Moreover, an experiment with three kinds of
discharge sources was designed in the laboratory and
the result of the experiment verifies the effectiveness
of the method. The research results also show that
the method can automatically judge the number of
discharge sources and separate the multi-source
discharge pulses according to the characteristics of
the multi-source discharge signals, which does
require human intervention and its accuracy is high.
ICVMEE 2019 - 5th International Conference on Vehicle, Mechanical and Electrical Engineering
388

ACKNOWLEDGEMENTS
This research was supported by the Science and
Technology Projects of Test & Maintenance Center
of CSG EHV Transmission Company (Grant No.
CGYKJXM20160025).
REFERENCES
Cavallini, A., Montanari, G.C., 2005. A new methodology
for the identification of PD in electrical apparatus:
properties and applications. IEEE Transactions on
Dielectrics and Electrical Insulation, 12(2), p. 203-
214.
Dey, D., Chatterjee B., Chakravorti, S. and Munshi, S.,
2010. Cross-wavelet Transform as a New Paradigm
for Feature Extraction from Noisy Partial Discharge
Pulses. IEEE Transactions on Dielectrics and
Electrical Insulation, 17 (1): p. 157-165.
Guo, J., Wu, G. N., Zhang, X.Q., 2005. The actuality and
perspective of partial discharge detection techniques.
Transactions of China Electrotechnical Society, 20(2),
p. 29-35.
Herold, C, Wenig, S, Leibfried, T., 2010. Advanced de-
noising of power cable partial discharge signals by
empirical mode decomposition. Universities Power
Engineering Conference (AUPEC), Australasian.
Kuo, R.J., Lin, T.C., Zulvia, F.E., et al., 2018. A hybrid
metaheuristic and kernel intuitionistic fuzzy c-means
algorithm for cluster analysis. Applied Soft Computing,
67.
Liu, Y. P., Wang, Z. J., Li, Y. S., 2013. Study on the
Insulating Spacers Surface Discharge of GIS. Applied
Mechanics and Materials, 385-386, p. 1209-1212.
Lu, Q.F., Li, D.J., Tang, Z.G., et al., 2017. Partial
Discharge Ultra-high Frequency Detection
Technology, China Electric Power Press.
Ma, J.Y., Jie, F.R., Hu, Y.J.,2017. Moving target detection
method based on improved Gaussian mixture model.
Society of Photo-optical Instrumentation Engineers.
Qin, J., Wang, C.C., Shao, W.M., 1997. On certain
integrals of Lipschitz-Hankel type involving products
of Bessel functions Applying UHF to partial discharge
on-line monitoring of electric power apparatus. Power
System Technology, 21(6), p. 33-36.
Savchenko, A.V., 2017. Maximum-likelihood
dissimilarities in image recognition with deep neural
networks. Computer Optics, 41(3), p. 422–430.
Si, W.R., Li, J.H., Li, Y.M., et al.,2009. Detection and
identification techniques for multi-PD source in GIS.
Proceedings of the CSEE, 29(16), p. 119-126.
Tang, Z.G., Wang, C.X., Li, C.R., et al., 2009. Pulse
interferences elimination and classification of on-line
UHF PD signals. High Voltage Engineering, 5 (35), p.
1026-1031.
Tang, Z.G., Jiang, T.T., Ye, H.S., et al., 2017. Statistical
characteristics of electromagnetic interferences for
partial discharge detection in substation. High Voltage
Engineering, 43(09), p. 2998-3006.
Tang, Z.G., Wang, C.X., Chang W.Z., et al.,2012. A
combined noise-rejection method for UHF PD
detection on-site. IEEE Transactions on Dielectrics
and Electrical Insulation, 19(3), p. 917-924.
Wang, C.C., Li, F.Q., Gao, S.Y.,2006. Online Monitoring
and Fault Diagnosis of Power Equipment, Tsinghua
University Press of China.
Wang, C.X., Tang, Z.G., Chang W.Z., et al., 2012. A
method for anti-interference and multi-source
discharge signal separation in ultra high-frequency
partial discharge detection. Power System Technology,
36(3), p. 46-50.
Xiao, Y., Huang, C.J., Yu, W.Y., et al., 2005. Application
of wavelet-based matching pursuits algorithm to
multiple partial discharge pulses extraction.
Proceedings of the CSEE, 25(11), p. 157-161.
Yang, L.J., Sun, C.X., Liao, R.J., et al., 2010. Application
of equivalent time-frequency analysis and fuzzy
clustering to recognize multiple PD sources. High
Voltage Engineering, 36(7), p. 1710-1716.
Zhang, W. B., 2017. Partial Discharge Detection
Technology and Application of Power Equipment,
China Machine Press.
Dynamic Frequency-selection Clustering of Automatic Multiple Source Separation based on UHF PD Detection
389
