
An Efficient and Accurate Contact Model for Rough Surfaces
Considering of Microscopic Interaction
Cheng Zhang
1, a
, Jianrun Zhang
1, b
1
Department of Mechanical Engineering, Southeast University, Nanjing, Jiangsu, China
Keywords: Rough surfaces, Contact model, Interaction, Asperity.
Abstract: Traditional rough surface contact models either neglect the interaction between asperities, resulting in
inaccurate analysis results, or adopt exhaustive method because of considering interaction, resulting in a
huge amount of calculation. In order to establish an efficient and accurate contact model for rough surfaces,
the deformation distribution of asperities considering interaction is analyzed by exhaustive method, based
on Green function. The results show that the deformation of the asperity still obeys the normal distribution
approximately. Therefore, a fitting function is established to describe the distribution of asperities under
micro-interaction through data analysis. Then, a new contact model for rough surfaces considering of
microscopic interaction is established. Compared with the exhaustive method, the correctness of the model
is verified, and the efficient and accurate analysis of rough surface is realized.
1 INTRODUCTION
The contact between rough surfaces has complex
mechanical properties. The identification of stiffness
and other parameters of the contact between rough
surfaces is of great significance to the dynamic and
static analysis of structures. In order to reveal the
deformation mechanism in the contact process, it is
necessary to study the contact characteristics of the
interface on the micro scale.
The earliest rough surface contact model was
proposed by GREENWOOD (Greenwood, 1966),
which is called GW model. The model only
considers the elastic deformation of the asperities. In
order to consider the plastic deformation of
asperities, Chang et al. (Chang, 1987) proposed a
CEB model, which divides the deformation process
of asperities into elastic deformation and plastic
deformation. Zhao et al. (Zhao, 2007) believed that
there should be an elastic-plastic deformation
transition stage between elastic deformation and
plastic deformation. So a ZMC model was proposed
to supplement and improve the whole process of
asperities deformation. On the basis of these three
models, many scholars have further analyzed and
applied the rough surface contact model (Li, 2016,
Xiao, 2019). Ciavarella et al. (Ciavarella, 2006)
established a contact model for rough surfaces
considering interaction and compared it with GW
model. The result shown that there was a large error
between the two models when the loads were large,
which proved that the interaction between asperities
could not be neglected. Iida et al. (Iida, 2003)
considered the interaction of asperities on the basis
of GW model, and calculated the actual contact
force of the interface by exhaustive method.
Although these models have established rough
surface contact models considering microscopic
interaction and can reflect contact characteristics
from the contact mechanism, the use of exhaustive
method makes the calculation amount increase with
the number of asperities on the contact surface,
which is difficult to be analyzed effectively for
contact characteristics of large surfaces such as bolt
joint surface.
In order to comprehensively consider the
accuracy and efficiency of rough surface contact
model, the Iida exhaustive contact model is used to
study the deformation distribution law of the
asperities on the rough surface when considering the
interaction. It is found that the deformation
distribution of the asperities considering the
interaction still obeys the normal distribution.
Therefore, a fitting function is established to
describe the distribution of asperities under
micro-interaction through data analysis. Then, a new
contact model for rough surfaces considering
Zhang, C. and Zhang, J.
An Efficient and Accurate Contact Model for Rough Surfaces Considering of Microscopic Interaction.
DOI: 10.5220/0008855801970202
In Proceedings of 5th Inter national Conference on Vehicle, Mechanical and Electrical Engineering (ICVMEE 2019), pages 197-202
ISBN: 978-989-758-412-1
Copyright
c
2020 by SCITEPRESS – Science and Technology Publications, Lda. All rights reserved
197

of microscopic interaction is established. The
proposed model is compared with the exhaustive
method and the model neglecting the micro-
interaction. The results illustrate the importance of
the interaction on the analysis results and verify the
correctness of the proposed model. Therefore, the
efficient and accurate analysis of rough surface is
realized according to the proposed model.
2 OPTIMIZED ZMC CONTACT
MODEL
The micro-model between two rough surfaces is
very complex. It is difficult to analyze the micro-
model directly. It is found that the contact between
two rough surfaces can be replaced by the contact
between an equivalent rough surface and a rigid
smooth surface. Therefore, this equivalent model is
adopted in general contact model.
The assumption of GW model is adopted in
ZMC contact model, which are: (1) The micro-
morphology of the surfaces is isotropic. (2) The
interaction between the asperities on the surface is
neglected. (3) The top of all asperities is spherical
and the curvature radius is the same. (4) The height
of asperities is random distribution. (5) Only the
deformation of asperities in contact is considered,
while the macro-matrix is not deformed.
Based on the above assumptions and statistical
probability theory, if there are N asperities on
nominal contact area
, the expected number of
asperities contacting with the rigid smooth surface is
, which is
(1)
Where is the distribution density of the number
of asperities, d is the distance between the smooth
rigid plane and the average line of the height of
asperities, is the distance between the height of
each asperity and the average line of the height of
asperities,
is the probability density function of
the height distribution of asperities. A large number
of studies have shown that the height of the
asperities on the engineering surface obeys the
normal distribution. Therefore, the expected
number of asperities contacted is
(2)
Where is the average height of the asperity
peaks, is the standard deviation of the height of the
asperity peaks.
Therefore, the total contact load of the
interface is:
(3)
Where
represent the sum of the loads
of the asperities in the elastic, elastic-plastic and
plastic deformation stages respectively. The
expressions of
are based on Eq. (2) and
have been deduced by Zhao (Zhao, 2007) and Li (Li,
2016) according to Abbott et al's theses (Abbott,
1995, Francis, 1976, Johnson, 1987, Kogut, 2002,
Lin, 2005, Liou, 2010, Timoshenko 1990).
3 STUDY ON DEFORMATION
DISTRIBUTION OF
ASPERITIES AND
EQUIVALENT MODELING
Iida considered that it was unreasonable to neglect
the interaction between asperities on the interface in
GW contact model. Therefore, Iida studied the
influence of interaction between asperities on
contact loads between two rough surfaces by
exhaustive method, based on Green's function. The
normal deformation of the benchmark of asperity i
caused by the contact load of asperity j can be
expressed by Green function (Iida, 2003):
(4)
Where
is the deformation of the benchmark
of asperity i in Z direction caused by the contact
load of asperity j,
is the contact load of asperity j,
are the coordinates of the asperity i
and j in the XY plane respectively.
According to Eq. (4), the deformation
of the
benchmark of asperity i in Z direction caused by the
contact loads of all the other asperities can be
obtained.
(5)
Therefore, the actual deformation
of the
asperity i is
ICVMEE 2019 - 5th International Conference on Vehicle, Mechanical and Electrical Engineering
198

(6)
The relationship between the contact load and
the deformation of a single asperity can be achieved
according to the contact load functions of each
asperity (Zhao, 2007, Li, 2016). Therefore, total
contact load on rough surfaces considering
interaction can be obtained by exhaustive method:
(7)
Where
is the contact load calculation
function of the asperity i.
Iida exhaustive contact model considers the
interaction of asperities on the basis of ZMC contact
model, which makes the result more accurate.
However, for common contact surfaces, such as bolt
joints, the number of asperities on the analysis
surfaces reaches tens of thousands or even more.
Meanwhile, the contact load
in Eq. (4) is also an
unknown parameter related to the deformation
and needs to be obtained by iteration. Therefore,
there is of great calculation complexity when this
method is used.
In order to solve the problem of huge amount of
calculation in Iida exhaustive contact model, the
deformation distribution of asperities on rough
surface considering interaction is studied based on
the Iida exhaustive contact model. According to the
research result, an equivalent model is established to
improve calculation efficiency and ensure
calculation accuracy.
3.1 Study on Distribution Law of
Deformation of Asperities
Considering Interaction
In order to study the deformation distribution of
asperities considering the interaction, the surface in
Iida’s paper (Iida, 2003) is analyzed. The parameters
are shown in Table 1. The material properties of the
two contact surfaces are shown in Table 2. The
contact area analyzed in this paper is square.
When studying the deformation distribution of
asperities, the deformation distribution of asperities
in
range is considered, that is, negative
deformation exists in asperities. Eq. (6) is subs-
tituted into Eq. (7) and the deformation distribution
of asperities considering the interaction is calculated
by iteration. In order to make the results more
obvious, the deformation distribution of 1000 groups
of asperities is calculated. The results are shown in
Figure 1. It can be found that the deformation
distribution of the asperities still obeys the normal
distribution. Therefore, the deformation distribution
function of the asperities considering interaction
obeys
.
The relationship among the mean value
, the
standard deviation
of the deformation distribution
function of the asperities and the contact parameters,
such as the contact area, is further analyzed. The
influence of the change of the distance d between the
smooth rigid plane and the average line of the height
of asperities and the contact area on the mean value
and the standard deviation
of the deformation
distribution function is studied. The analysis results
are shown as Figure 2.
Table 1. Typical Rough Surface Parameters.
Sample
Mean asperity
height
Standard deviation
of asperity height
Asperity radius of
curvature
Asperity density
1
1
Table 2. Properties of contact materials.
Material properties
Upper contact body
Lower contact body
Modulus of elasticity E[Pa]
3.85e11
7.1e10
Hardness H[Pa]
2.34e10
2.37e10
Poisson ratio
0.3
0.244
An Efficient and Accurate Contact Model for Rough Surfaces Considering of Microscopic Interaction
199
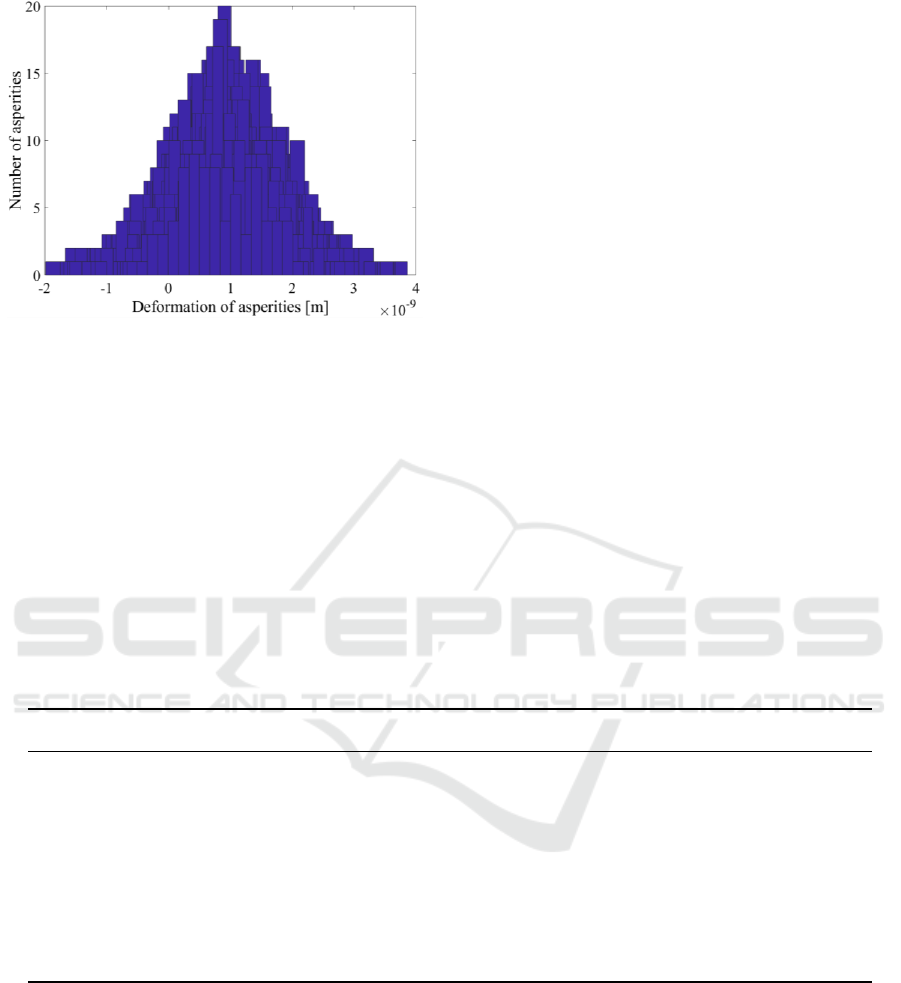
Figure 1. Deformation distribution of asperities
considering interaction.
3.2 Equivalent Contact Model with
High Efficiency and Accuracy
According to the curve shown in Figure 2 and data
analysis, Eq. (8) and (9) are selected to fit the mean
value and standard deviation of the deformation
distribution of the asperities respectively.
(8)
(9)
Where
and
are undetermined
constants, l is the side length of contact area.
The parameters
and
are fitted
with the fitting toolbox cftool in MATLAB, as
shown in Table 3. The R-square of each fitting
function is shown in Table 4.
According to Table 3 and 4, it can be found that
each fitting function (i.e. Eq. (8) and (9)) can fit each
point well.
Furthermore, the relationship between the
distance d between two surfaces and the fitting
functions is studied. Some results are obtained:
(1) The relationship between the parameter
in
Eq. (8) and the distance d satisfies:
. The R-square of the
fitting function is 1.
(2) The parameter
in Eq. (8) varies slightly
with distance d. Its maximum variation is less than
2.7%. Therefore, its average value is taken as the
parameter in the final fitting function.
(3) According to Figure 2(b), the growth trend of
standard deviation of each curve is slow when l >
4e-6m. The maximum change of adjacent points
(spacing 1e-6m) is 0.6%, and the change gradually
tends to zero. Meanwhile, there is little difference in
standard deviation between curves, the maximum
error is 1.1%. Therefore, the average value is taken
as the standard deviation in the final fitting function.
Table 3. Fitting results of the parameters
and
.
Distance d
0
2
4
6
8
10
Mean value
2.014
1.817
1.621
1.424
1.226
1.027
-4.928
-4.863
-4.823
-4.799
-4.807
-4.891
Standard
deviation
7.053
7.055
7.033
7.034
7.049
7.035
1007
796.1
880.9
747.1
159.5
147.9
-4.996
-3.541
-3.678
-3.113
-2.957
-3.559
-1.284
-1.086
-1.137
-1.03
-0.9821
-1.053
ICVMEE 2019 - 5th International Conference on Vehicle, Mechanical and Electrical Engineering
200
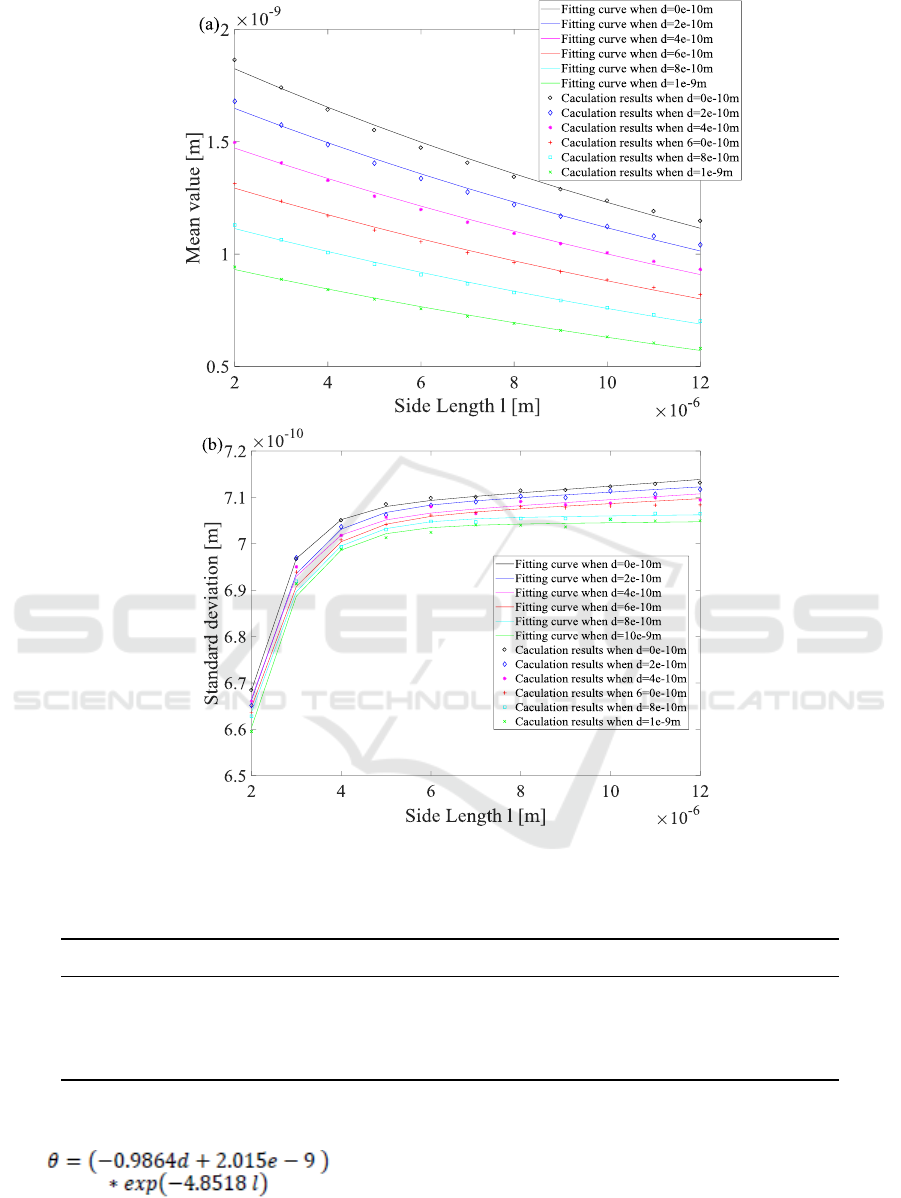
Figure 2: The relationship between the deformation distribution of asperities and the distance d between two surfaces and
the side length l (contact area): (a) mean value, (b) standard deviation.
Table 4. The R-square of each fitting function.
Distance d
0
2
4
6
8
10
Fitting
function
R-square
Mean
value
0.9909
0.9923
0.9933
0.9946
0.9961
0.9971
Standard
deviation
0.9992
0.9917
0.9934
0.9919
0.9958
0.9939
In summary, the fitting function is finally obtained:
(10)
(11)
3.3 Model Validation
In order to verify the accuracy of the proposed
model, the contact forces when the contact area is
10e-6m*10e-6m and the distance d between two
surfaces is are calculated with different
An Efficient and Accurate Contact Model for Rough Surfaces Considering of Microscopic Interaction
201

models. The results are compared as shown in Table
5.
Table 5. The contact forces calculated with different
models.
Calculated
models
/mN
Error with exhaustive
method
Model proposed
in this paper
0.5975
0.27%
Optimized ZMC
Contact Model
1.1316
90%
Iida exhaustive
contact model
0.5959
/
According to the calculation result, the fitting
model proposed in this paper is basically consistent
with the exhaustive model. Meanwhile, it can be
found that the model without considering the
interaction will produce great errors.
4 CONCLUSION
In this paper, the traditional micro-contact model of
rough surfaces is optimized in order to consider the
accuracy and efficiency of calculation compre-
hensively. The deformation distribution law of
asperities considering interaction is studied by using
Iida exhaustive model. Fitting function is established
to describe the distribution of asperities under micro-
interaction through data analysis. Therefore, a new
contact model of rough surfaces is proposed.
Compared with the optimized ZMC model and Iida
exhaustive model, the correctness of the proposed
model and the non-negligibility of the interaction are
verified.
ACKNOWLEDGEMENTS
The work was supported by 2017 Science and
Technology Support Plan of Nanjing Jiangsu China
(Grant No. 201701213) and 2018 Science and
Technology Support Plan of Yunnan China (Grant
No. 2018IC30).
REFERENCES
Abbott E., Firestone F., et al. 1995, Specifying surface
quality: a method based on accurate measurement and
comparison. Spie Milestone Series MS, 107: 63-63.
Chang W., Etsion I., et al. 1987, An elastic-plastic model
for the contact of rough surfaces. Journal of tribology,
109(2): 257-263.
Ciavarella M., Delfine V., et al. 2006, A “re-vitalized”
Greenwood and Williamson model of elastic contact
between fractal surfaces. Journal of the Mechanics
and Physics of Solids, 54(12): 2569-2591.
Francis H., 1976, Phenomenological analysis of plastic
spherical indentation. Journal of Engineering
Materials and technology, 98(3): 272-281.
Greenwood J., Williamson J., 1966. Contact of nominally
flat surfaces. Mathematical and physical sciences,
295(1442): 300-319.
Iida K., Ono K. 2003, Design consideration of
contact/near-contact sliders based on a rough surface
contact model. Journal of tribology, 125(3): 562-570.
Johnson K., Johnson K., et al. 1987, Contact mechanics.
Cambridge university press.
Kogut L., Etsion I., 2002, Elastic-plastic contact analysis
of a sphere and a rigid flat. Journal of applied
Mechanics, 69(5): 657-662.
Li L, Cai A., Cai L., et al. 2016, Micro-contact Model of
Bolted-joint Interface. Chinese Journal of Mechanical
Engineering, 52(07): 205-212.
Lin L., Lin J., 2005, An elastoplastic microasperity contact
model for metallic materials. Journal of Tribology,
127(3): 666-672.
Liou J., Tsai C., et al. 2010, A microcontact model
developed for sphere-and cylinder-based fractal bodies
in contact with a rigid flat surface. Wear, 268(3-4):
431-442.
Timoshenko S., Goodier J.N. 1990, Theory of Elasticity.
Translated by Xu Zhilun. Beijing, China: Higher
Education Press, 481-489.
Xiao H., Sun Y., et al. 2019, Fractal modeling of normal
contact stiffness for rough surface contact considering
the elastic–plastic deformation. Journal of the
Brazilian Society of Mechanical Sciences
and Engineering, 41(1): 11.
Zhao Y., Lu Y., et al. 2007, New elastic-plastic model for
the contact of rough surfaces. Chinese Journal
of Mechanical Engineering, 43(3): 95-101.
ICVMEE 2019 - 5th International Conference on Vehicle, Mechanical and Electrical Engineering
202
