
Effect of Cover Soil to Concentration of Ammonia, Nitrate and
Nitrite in Leachate with Bioreactor Landfill Simulation
Winny Laura C. Hutagalung, Rinaldi and Syarafina Sabilla
Environmental Engineering Study Program, Engineering Faculty, Universitas Jambi, Mestong, Pondok Meja 36364
Keywords: Bioreactor Landfill, Cover Soil, Ammonia, Nitrate, Nitrite.
Abstract: Leachate is one of the wastes from the waste processing site that must be handled appropriately so as not to
pollute the environment. One method of handling leachate is leachate recirculation. Ammonia contained in
leachate can pollute the environment. This study simulated landfills in two bioreactors with recirculation
leachate and the addition of water and distinguished them using (1) and without using cover soil (2). The
study was conducted for 30 days. The parameters analysed were ammonia, nitrate, and leachate nitrite. The
observations of the two bioreactors showed that the concentration of ammonia and nitrate in bioreactor 2
tended to be higher than in bioreactor 1. Nitrite concentrations did not show significant differences in the two
bioreactors. Ammonia, nitrate, and nitrite compounds in both bioreactors have been formed since the
beginning of the study even though they initially had relatively low values. The decrease in the height of the
organic waste is faster in bioreactor 1 with a percentage of final waste reduction of 79.03%. The highest waste
temperature occurs in bioreactor 2, which reaches 43
0
C. The pH of waste in both bioreactors tends to be
neutral, while the pH of leachate in both bioreactors tends to be acidic.
1 INTRODUCTION
Indonesia is a developing country with a population
that continues to increase every year. The impact of
population growth increases the amount of waste
generated. The problem that occurs in Indonesia is the
increasing number of waste generated every day,
while the land that can be used as disposal and
processing of waste is increasingly limited. Waste
generation has a direct impact on environmental
conditions, such as siltation of rivers, air pollution,
causing various diseases, and damaging aesthetic
values.
Jambi City is one city that is inseparable from the
problem of garbage. In 2015 the population of Jambi
City was 569.296 people with an annual waste
generation of 571.444 m
3
(Central Statistics Agency,
2015). The landfill used is the Talang Gulo landfill
which has a controlled landfill system. Many
problems occur in implementing this system, such as
limited land, methane gas production, and the high
volume of leachate produced. Leachate produced
contains various pollutants, including ammonia,
nitrate, and nitrite. Therefore, there must be a way to
accelerate the stabilization of waste to overcome the
problem of limited land and reduce the organic
content of leachate in a faster time. According to
Chan (2002) by conducting leachate recirculation can
improve leachate quality, accelerate the
decomposition of waste, and reduce leachate
processing costs.
Based on the above problems, the authors
conducted a study on the condition of leachate in
landfill modelling to be made with the type of organic
waste in two different reactors, namely using cover
soil and without cover soil. This study was conducted
to analyse the effect of cover soil on decreasing the
height of the waste, the temperature of the garbage,
the pH of the waste and the pH of leachate water in
each reactor. Determine the concentration of
ammonia, nitrate, and nitrite in leachate produced
from each reactor. The landfill is a physical facility
that is used as a place for final waste processing. The
landfill is a method of handling waste by storing
garbage into the soil. The most widely known final
disposal method is open dumping, controlled
landfills, and sanitary landfills (Tchobanoglous et al.,
1993).
Leachate is liquid waste arising from the entry of
external water into landfills, dissolving, and rinsing
dissolved materials, including organic matter
resulting from biological decomposition processes
292
Hutagalung, W., Rinaldi, . and Sabilla, S.
Effect of Cover Soil to Concentration of Ammonia, Nitrate, and Nitrite in Leachate with Bioreactor Landfill Simulation.
DOI: 10.5220/0008553402920299
In Proceedings of the International Conference on Natural Resources and Technology (ICONART 2019), pages 292-299
ISBN: 978-989-758-404-6
Copyright
c
2019 by SCITEPRESS – Science and Technology Publications, Lda. All rights reserved
(Damanhuri, 2008). One of the characteristics in
leachate is ammonia, which, if excessive, is harmful
to the environment. Ammonia in leachate must be
removed because it is toxic, inhibits anaerobic
degradation and can affect human health (Dini, 2014).
Increasing the concentration of ammonia-
nitrogen will increase the level of toxicity in leachate
(Dini, 2014). High concentrations will potentially
inhibit the degradation process and require treatment
of leachate before being discharged into the water
body. In leachate, most ammonia-nitrogen is in the
form of ammonium (NH4 +) because the pH level is
less than 8 (Reinhart et al., 2002 in Dini, 2014).
Parameter of ammonia (NH
3
), nitrite (NO
2
-
) and
nitrate (NO
3
-
) produced in the bioreactors are formed
due to decomposition reactions of organic matter
containing nitrogen, such as proteins and amino acids.
Protein must undergo the process of hydrolysis into
amino acids so that it can be used as an energy source
by a microorganism. The process of protein
hydrolysis and fermentation by microorganisms
causes ammonia (NH
3
) to form in leachate.
The process of changing from amino acids to
ammonia is called ammonification, which helped by
microorganisms such as bacteria and fungi. In the
case of sufficient oxygen, ammonia will be converted
biologically through the nitrification process.
Nitrification is a two-stage process that also involves
two types of bacteria, Nitrosomonas and
Nitrosococcus, which can decompose ammonia into
nitrite, and Nitrobacter, which is able to decompose
nitrite compounds into nitrates.
2 MATERIALS AND METHODS
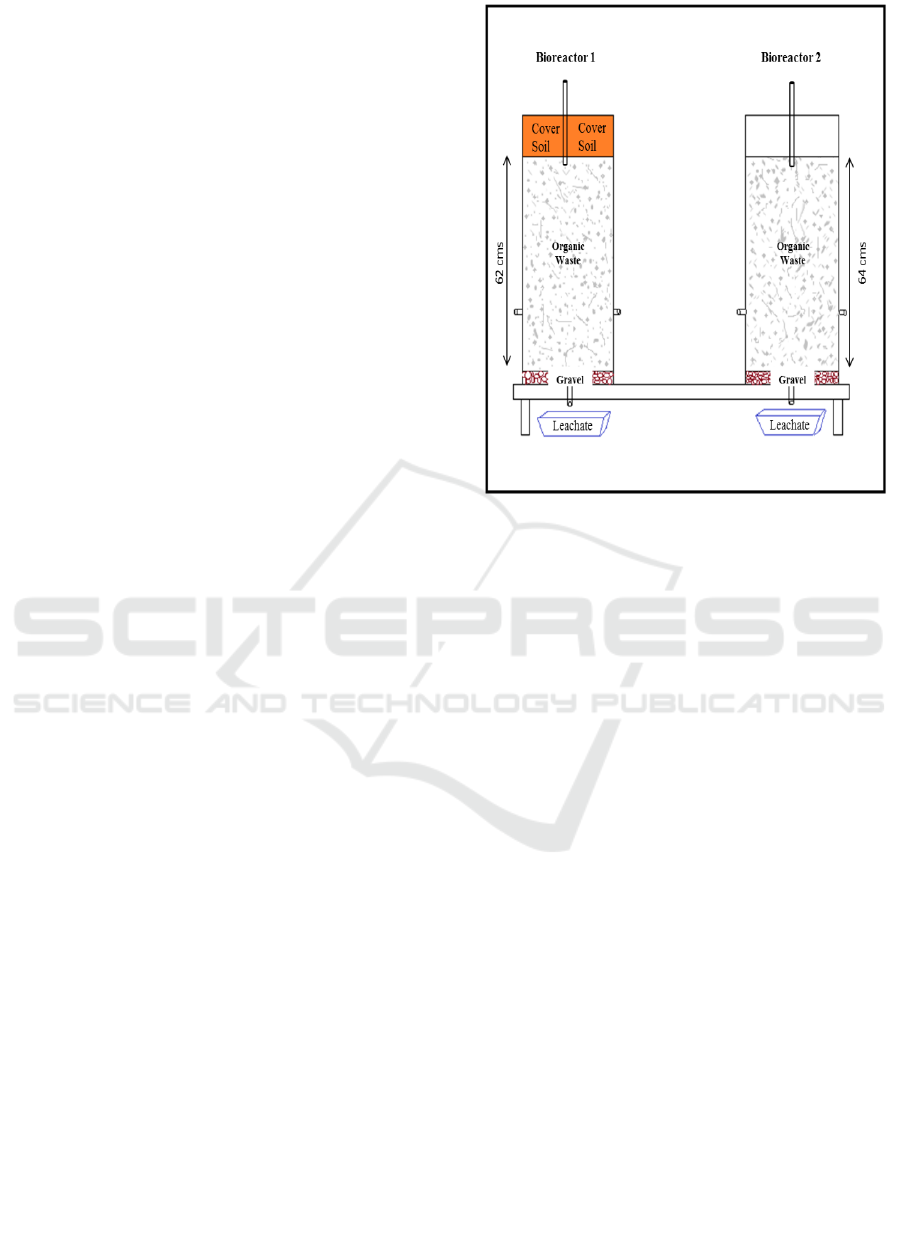
In this study, there were two different bioreactors
those are bioreactor 1, which used cover soil and
bioreactor 2 without cover soil. The cover soil used is
sandy clay soil. The bioreactor is made using 85 cm
tall drums with a diameter of 48 cm. Organic waste
filled into the bioreactors with weight 57 kgs. Organic
waste was taken from Talang Banjar Traditional
Market, Jambi City and was chopped in Makmur
Waste Bank, Eka Jaya.
The temperature of waste is carried out using a
thermometer. Waste temperature is measured at each
port that is in each reactor. The measurement pH of
leachate was carried out every day for 30 days of
study. Leachate water is taken from the reservoir of
leachate water from each reactor, which will then be
measured for its pH value using a pH meter. The
layout of bioreactors used is as follows:
Figure 1: Layout of Bioreactor.
This study was conducted for 30 days. The
parameters observed in this study were the decreased
of the height of waste, temperature, and pH of waste,
pH of leachate, the concentration of ammonia (NH
3
),
nitrite (NO
2
-
) and nitrate (NO
3
-
). Both bioreactors will
be treated with leachate recirculation and addition of
rainwater. Recirculation of leachate carried out will
redistribute nutrients needed by microorganisms in
landfills (Adam, 2015). The amount of water added
was 477 ml, with the calculation of rainfall in Jambi
City. Addition of water is carried out every day
during the study.
Recirculation of leachate is carried out in the first
week for seven days, then in week-2 to week-4 only
once a week. For the addition of water is done every
day. The method used to measure the concentration
of each parameter, like Ammonia is SNI 06-6989.30-
2005, Nitrite (NO
2
) is SNI 06-6989.9-2004, and
Nitrate (NO
3
) is SNI 6989-79-2011.
3 RESULTS AND DISCUSSION
3.1 Effect of Cover Soil to Reduction of
Organic Waste
Decreasing the height of the waste is classified into 3
stages, namely the initial reduction of waste, the
decrease in primary waste, and the subsequent
Effect of Cover Soil to Concentration of Ammonia, Nitrate, and Nitrite in Leachate with Bioreactor Landfill Simulation
293

decrease in waste (El-Fadel, 2014). The reduction in
waste caused by the addition of external loads to the
waste is referred to as the initial reduction in waste.
The external load added above the layer of waste can
reduce the amount of space formed between the
surfaces of the waste (Adam, 2014). The initial
reduction of waste on the day-1 of the bioreactor 1
decreased to 33.87%, while in bioreactor 2 decreased
to 25%.
Furthermore, the reduction of waste height
continues and is observed at each stage. Stage 1 is a
decrease in waste height in the first week of the study.
At this stage, the decrease in the height of the waste
occurs as a result of the weight of the waste itself or
can be said as a primary decline (Elagroudy et al.,
2008). At this stage, the height of waste in bioreactor
1 decreased by 43.55%, while in bioreactor 2
decreased by 51.56%.
At the end of stage 2 on the day-14 of the study,
the height of bioreactor 1 decreased by 62.90%, while
in bioreactor 2 decreased by 62.50%. At the
beginning of stage 3 on the day-15, the height of
waste in bioreactor 1 decreased by 62.90%, while in
bioreactor 2 decreased by 65.63%. At the end of stage
3 on the day-30, the height of waste in bioreactor 1
was 13 cm, while in bioreactor 2 was 14 cm. Based
on the results, it was obtained that the percentage of
reduction of waste in bioreactor 1 was 79.03%, while
bioreactor 2 was 78.13%.
The reduction in waste that occurs from stage 2 to
stage 3 can be categorized as a secondary decrease in
waste. It occurs as a result of the physical and
biochemical decomposition processes that have
occurred (Elagroudy et al., 2008). Reduction in waste
will continue until it reaches a stable condition. As
shown in Figure 2, the accumulated percentage of
waste reduction. In this case, the initial decline in
waste and the decrease in primary waste is shown in
stage 1. While the secondary decrease in waste is
shown in stages 2 and 3.
3.2 Effect of Cover Soil to pH and
Temperature of Organic Waste
In general, the temperature of waste in bioreactor
tends to fluctuate because it is influenced by ambient
temperature or the temperature outside the bioreactor.
Besides that, the temperature is one indicator that
shows that the decomposition process of organic
compounds runs smoothly is the change in the
temperature of the waste. The heat generated from
organic waste is caused by the decomposition of
organic fractions from the waste mass. The heat
generated is influenced by the operating system
applied to landfills and climatic conditions (Yesiller
et al., 2011).
The temperature of waste becomes an important
parameter because it affects the solubility of organic
compounds and heavy metal compounds contained in
waste (Sethi et al., 2013). The measurement of waste
temperature is carried out every day for 30 days. The
results of the temperature of the waste in bioreactor 1
are in the range of 30-36
0
C, this is suitable for the
process of decomposition of waste. Meanwhile, the
temperature of waste in bioreactor 2 is in the range of
30-43
0
C. The condition of microorganisms or
mesophilic bacteria can grow optimally in the range
of 30-38
0
C.
The temperature of waste in each bioreactor has
increased during the first stage. The temperature
range of waste in bioreactor 1, which uses cover soil
during stage 1 is between 33-35
0
C, while the range of
temperature values of waste in bioreactor 2 during
stage 1 is 33-43
0
C. This is related to the phase of
aerobic waste degradation that is taking place at both
bioreactors. In this phase of aerobic waste
degradation, oxygen trapped in waste is consumed
very quickly by aerobic bacteria to degrade the
organic material contained in waste into carbon
dioxide, water, organic residues which are partially
degraded and also produce heat (Anindita, 2013).
The heat generated from the aerobic degradation
process is what causes the initial temperature of the
waste to be high — exothermic processes in waste
degradation caused by respiration and metabolism
microorganism. The metabolism of microorganisms
is closely related to the organic fraction so that if the
temperature of the waste gets higher, it is also the
metabolic process of microorganisms is high
(Rahmawati, 2017).
The value of the waste temperature for bioreactor
2 increased dramatically on the day-3, which was
43
0
C. This is due to an exothermic reaction in the
bioreactor. An exothermic reaction is a reaction that
experiences heat transfer from the system to the
environment or in that reaction can emit heat. In
exothermic reactions generally, the system
temperature will increase. With a waste volume of
0.115 m
3
, it can produce a maximum waste
temperature value of 43
0
C.
At stage 2, the value of the waste temperature
tends to fluctuate. The temperature range of waste
obtained during stage 2 in each bioreactor is between
31-36
0
C for bioreactor 1 and 33-36
0
C for bioreactor
2. The waste temperature during stage 3 is the same
as stage 2 because the temperature of the waste is
fluctuating, but the temperature the waste of the two
bioreactors decreased on the day-30 or at the end of
ICONART 2019 - International Conference on Natural Resources and Technology
294
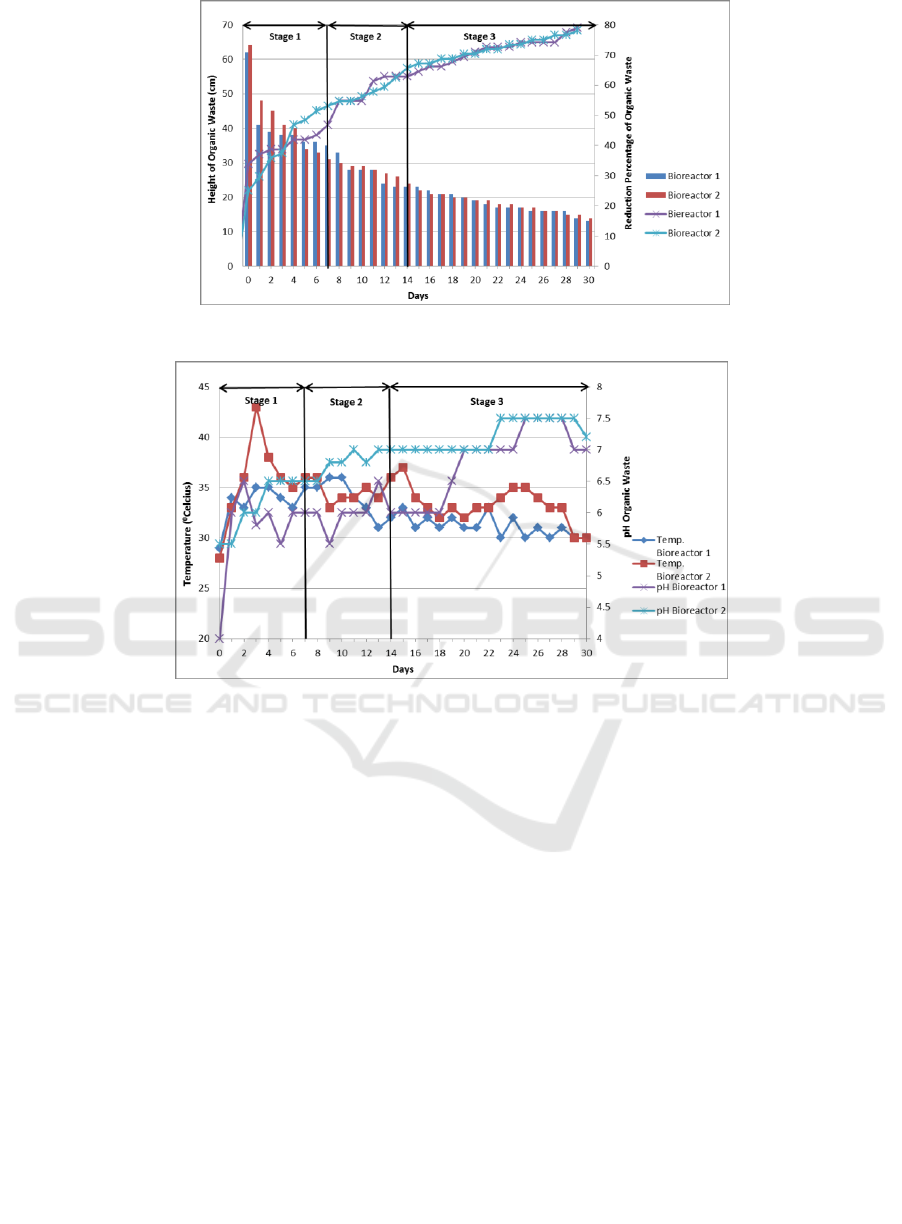
Figure 2: Reduction of Organic Waste.
Figure 3: Temperature and pH of Organic Waste.
stage 3, the study was 30
0
C. According to Sahidu in
Anindita (2013), the optimum temperature for the
growth of anaerobic bacteria ranges from 30-35
0
C.
This indicates that the process of degradation of waste
in both bioreactors after entering the anaerobic
degradation phase does not take place optimally.
The results of pH waste in this study tend to be
neutral in each reactor. The process of recirculation
leachate does not change the pH value to acid. This is
because the process of adding water is done every
day. The process of adding water every day affects
bioreactor 2, in the absence of a layer of soil covering
the water that enters the organic waste, it will seep
faster to the bottom of the organic waste where the
bottom has a port or hole to check the pH of the waste.
The pH of waste in bioreactor 2 is more neutral.
Conversely, the pH of waste in bioreactor 1 is longer
to reach a neutral pH. This is because the addition of
water is done through the cover soil first, then it seeps
into the garbage. Graph of temperature and pH of
waste can be seen in Figure 3.
3.3 Effect of Cover Soil to pH of
Leachate
The pH of leachate is one of the most significant
parameters in influencing leachate concentration in
landfills. In Figure 4, we can see the change in pH of
leachate for 30 days. The pH of leachate is closely
related to the concentration of the material dissolved
in it. The pH of leachate can also provide an
illustration of the ongoing phases in the landfill
reactor. On day-1 until day-30, it was seen that the pH
of leachate tended to be acidic in both bioreactors.
The range of pH of leachate in bioreactor 1 was
ranged from 3.2 until 5.3, while in reactor 2 it was
ranged from 3 until 5.2. This is due to the formation
of organic acids and increased carbon dioxide in the
waste. The formation and accumulation of organic
acids also result in a small amount of methane
produced because acidogenic bacteria, not
methanogenetic bacteria dominated the bioreactor.
Effect of Cover Soil to Concentration of Ammonia, Nitrate, and Nitrite in Leachate with Bioreactor Landfill Simulation
295

The pH of leachate at both bioreactors tends to be
low, indicating that the degradation process that takes
place in the waste has entered the acid phase or
commonly called the acidogenesis phase. In the
acidogenesis phase, there is a decreasing of pH
leachate as a result of the formation of acetic acid and
hydrogen. The pH of leachate in the acidogenesis
phase ranges from 5-6.5 (McBean et al., 1995). If the
leachate has an acidic pH and it recirculates to the
waste without a pH adjustment and buffering, it will
increase the solubility of organic acid in the leachate,
so that the pH of the next produced leachate tends to
decrease due to the accumulation of organic acids
which dissolved in leachate. In this study the pH
value did not reach neutral pH, this was related to
Dini (2014) where the pH value began to enter the
normal stage on the day-35 of the study with a pH of
7.2.
3.4 Effect of Cover Soil to
Concentration of Ammonia, Nitrate
and Nitrite in Leachate
The results obtained from this study were that on the
day-1 of the study, the concentration of ammonia in
leachate was 20.6 mg/L for bioreactor 1 and 11.9
mg/L for bioreactor 2. On day-6, the concentration of
ammonia was increased to 26.4 mg/L for bioreactor 1
and 116.4 mg/L for bioreactor 2.
This increase in concentration occurs because the
process of decomposition of organic material that
contains protein has begun. Proteins are converted
into amino acids in the process of hydrolysis, and
amino acids are converted back to ammonia
(Ayuningtias, 2013). On the day-12, the
concentration of ammonia increased to 468.7 mg/L
for bioreactor 1 and 449.6 mg/L for bioreactor 2.
The concentration of ammonia increased on day-
12 due to leachate recirculation process carried out
for seven days, respectively in the first week of the
study. This result is in accordance with what was
stated by Vazquez (2008) that leachate recirculation
could increase ammonia concentration because the
process can make ammonia in the dissolved
bioreactor in leachate. On the day-18, the
concentration of ammonia in bioreactor 1 decreased
to 175.2 mg/L, but for bioreactor 2 was increased to
462.3 mg/L. On the day-24, the concentration of
ammonia decreased to 19.7 mg/L for bioreactor 1 and
41.3 mg/L for bioreactor 2. Furthermore, on the day-
30 of the study, the concentration of ammonia
continued to decrease to12.35 mg/L for bioreactor 1
and 37.12 mg/L for bioreactor 2.
This decreasing concentration of ammonia is
thought to be due to the recirculation process of
leachate, which is no longer carried out every day but
once a week. In this study, the measured ammonia
concentration tended not to be too high because of the
constant addition of water. Purcell et al. (1999) said
that one method of ammonia removal is by washing
by water. Graph of ammonia concentration can be
seen in Figure 5.
In this study, it can be seen that ammonia
concentration in bioreactor 1 was lower than
bioreactor 2. This is related to the system used at the
landfill.
A landfill that applies a controlled landfill system
which was modeled with bioreactor 1 and open
dumping system was modeled with bioreactor 2.
Comparison of ammonia concentrations from the two
landfill sites with different systems shows that low
ammonia concentrations are found in landfills that
implement a controlled landfill system.
Furthermore, for concentrations of nitrite, there
was not too much difference in both bioreactors.
Concentrations of nitrite showed the nitrification
process in the bioreactor. The nitrification reaction is
triggered by the entry of oxygen due to leachate
recirculation and the addition of water. Besides, it is
estimated that the conditions in the bioreactor are
influenced by oxygen entering through several parts
of the bioreactor that are not tightly closed, such as
holes for testing pH and temperature of the waste. In
this study, the concentration of nitrite continued to
increase until day-12. After increasing, there was a
decrease in the concentration of nitrite in both
bioreactors until the last day of the study. However,
different things happened in bioreactor 1 because of
the concentration of nitrite, which had increased on
the last day of the study. Increase the concentration of
nitrite on day-30 in line with the decrease in ammonia
concentration because it has turned into nitrite
through the nitrification process.
In bioreactor 2, the concentration of nitrite tends
to be higher compared to bioreactor 1. This is because
the waste in bioreactor 2 is more quickly exposed to
the outside air or the waste inside the bioreactor is
readily reacted with oxygen; the nitrification process
will rapidly occur. Conversely, in bioreactor 1, air
from the outside is difficult to enter into the waste in
the bioreactor.
In addition to ammonia and nitrite concentrations,
nitrate concentrations were also examined to see the
association as one of the essential components in the
nitrification reaction. On the day-1 until day-18, the
concentration of nitrate was increased. Furthermore,
until the day-30, the concentration of nitrate was
ICONART 2019 - International Conference on Natural Resources and Technology
296
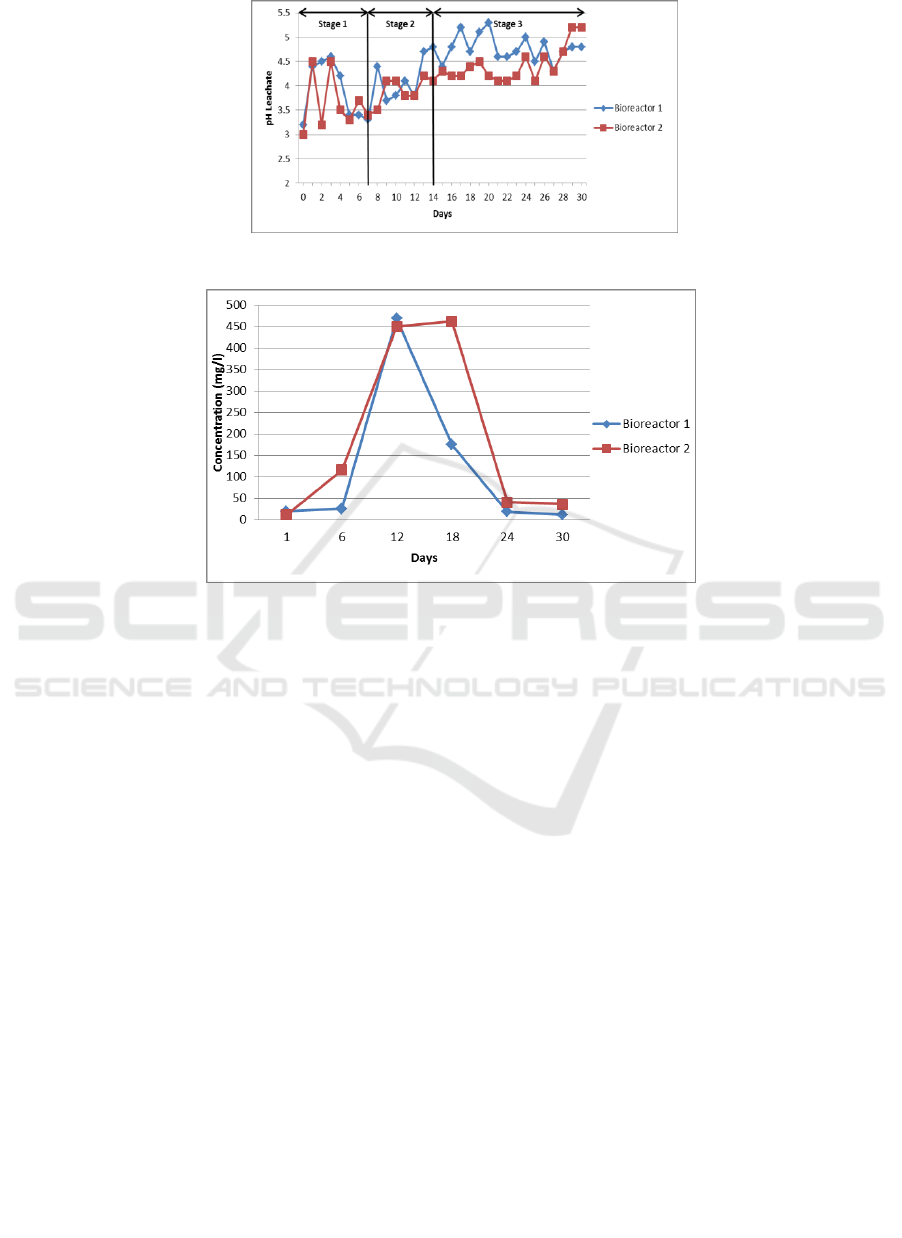
Figure 4: pH Leachate.
Figure 5: Concentration of Ammonia.
decreased. Nitrates can cause water to become
cloudy, reduce dissolved oxygen, and cause foul
odors. This was proven by organoleptic testing,
wherein this study the leachate produced tended to be
colored and foul-smelling. Graph concentration of
nitrate and nitrite can be seen in Figure 6.
3.5 Analysis of Recirculation Leachate
Recirculation of leachate is one of the factors to
accelerate the process of degradation of waste that
occurs in the reactor. Recirculation of leachate water
will trigger the stabilization process of reducing waste
in the reactor because it contains various substances
in leachate such as ammonia, nitrate, nitrite, methane,
carbon dioxide, sulfate, sulfite, water and
microorganisms (Damanhuri, 1993).
In this study, the recirculation of leachate was
carried out at both reactors with the frequency of
leachate administration in the first week of each day
and the following week only once a week. With the
provision of different recirculation in the first week
and the following week, the differences in the results
obtained in this study differ. Decreasing the height of
the waste in both bioreactors tended to occur faster in
the first week of the study, the height of the garbage
was reduced by around 1-21 cm in the first week. For
the pH value of the waste, the effect of recirculation
of leachate is not very visible because of the addition
of rainwater that is done every day so that in the two
reactors the organic waste pH tends to be neutral.
According to Priyambada in Anindita (2013), the
reactor which received leachate water recirculation
treatment experienced an increase in waste
temperature faster, because the content contained in
leachate can increase the rate of stability of waste
degradation. This is indicated by the temperature of
the waste at the two reactors is higher in the first week
compared to the following week. The pH value of
leachate in both reactors tended to be acidic, although
the recirculation of leachate water in the 2nd to the
fourth week was only done once a week.
Ammonia, nitrate, and nitrate concentrations on
the day-12 or at 2 weeks increased. This is due to the
provision of leachate recirculation carried out in the
first week every day. According to Vazquez (2008)
that leachate recirculation can increase ammonia
concentration because the process can make ammonia
in the dissolved reactor in leachate. Then the
concentration of ammonia, nitrate, and nitrite tends to
decrease in the following week.
Effect of Cover Soil to Concentration of Ammonia, Nitrate, and Nitrite in Leachate with Bioreactor Landfill Simulation
297
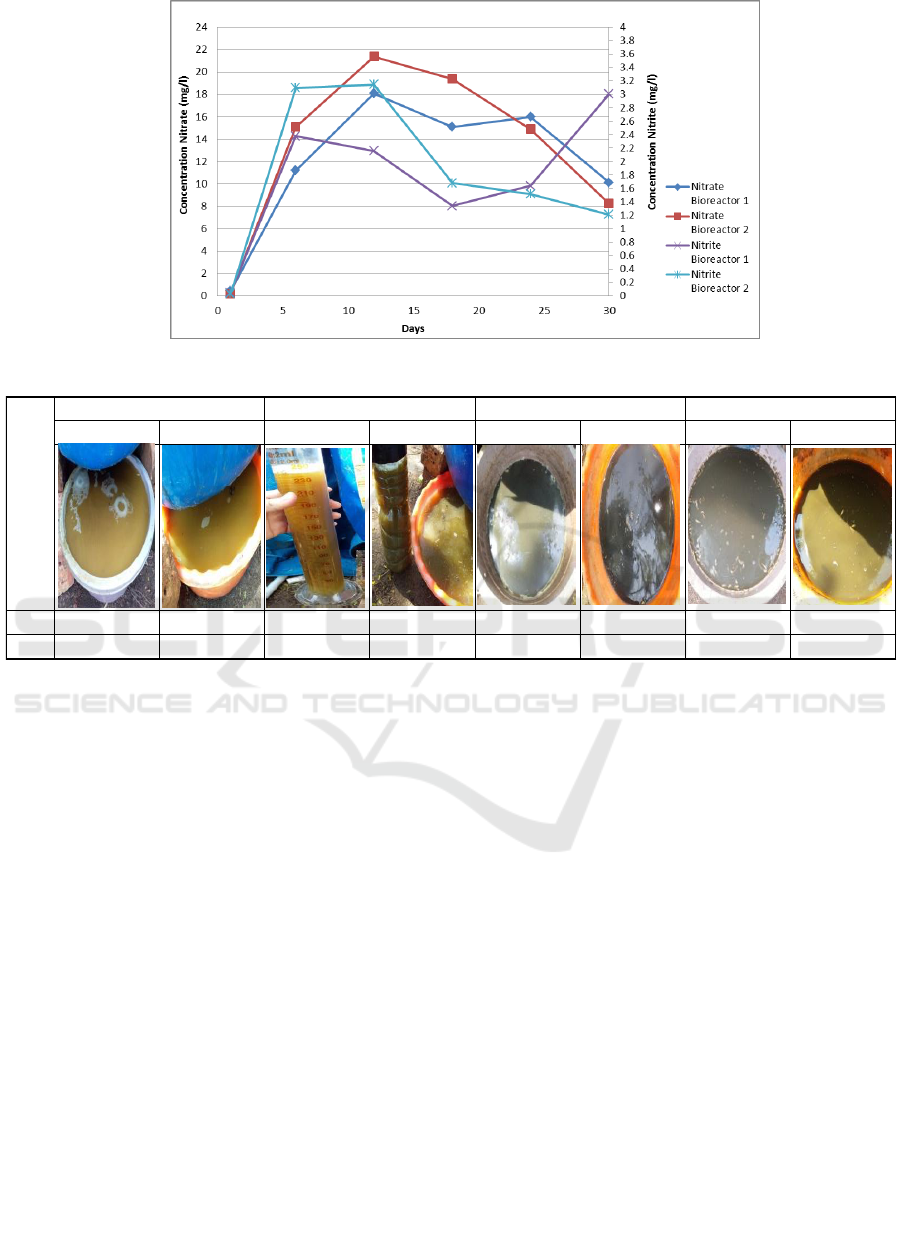
Figure 6: Concentration of Nitrate and Nitrite.
Table 1: Characteristics of Leachate.
Then the concentration of ammonia, nitrate, and
nitrite tends to decrease in the following week.
3.6 Organoleptic Testing to Leachate
Characteristics
Organoleptic test or also called physical test using
testing using sensory devices. In this study, the color
and smell of leachate in each bioreactor will be tested
using the sense of sight and sense of smell. On day-1
the bioreactor 1 produces brownish leachate with a
foul odor. Whereas in bioreactor 2 it produces
brownish yellow leachate and smells sour.
On the day-6 of the study, from bioreactor 1, leachate
was still brownish yellow and sour. Whereas in
bioreactor 2 the leachate is solid yellow and there is
much foam in the water, the smell of leachate at that
time stings foul. On the day-12 until day-30, on
bioreactor 1 the leachate was thick green with a
stinging smell.
While in bioreactor 2 the blackish leachate on the
day-12 of the study with the smell of very thin
leachate was also accompanied by the number of
maggot caterpillars that were accommodated in the
reservoir. For the day-18 until the day-30, the
leachate was thick green with a stinging smell.
According to Yatim and Mukhlis (2013), the odor in
leachate is produced from the process of overhauling
or decomposing organic matter, especially anaerobic
reformation of components will produce rancid and
foul-smelling compounds in the form of ammonia,
H
2
S and methane compounds.
In bioreactor 1, leachate produced better smell and
color of leachate than bioreactor 2. In bioreactor 1,
the odor produced did not smell rancid, but in
bioreactor 2, the odor produced was more stinging
and rancid. The color produced in each reactor is also
different. In the bioreactor 2 colors produced tend to
be darker.
4 CONCLUSIONS
Reduction of waste was faster in bioreactor 1, with
the percentage of final waste reduction was 79.03%.
The percentage of the reduction of waste in bioreactor
Bioreactor 1 Bioreactor 2 Bioreactor 1 Bioreactor 2 Bioreactor 1 Bioreactor 2 Bioreactor 1 Bioreactor 2
Color Brownish Brownish Yellow Brownish Yellow Yellow Green Blackish Green Green
Smell Foul Odor Smell Sour Smell Sour Stings Foul Stinging Smell Stinging Smell Stinging Smell Stinging Smell
Day-1
Day-6
Day-12
Day-30
Organoleptic Testing to
Leachate Characteristics
ICONART 2019 - International Conference on Natural Resources and Technology
298

2 was 78.13%. The pH of waste in both bioreactors at
the beginning was acidic. However, the next day until
the end of the study, the pH of the waste tended to be
neutral at both. The recirculation process of leachate
water in both reactors does not change the pH value
to acidic. This is because the process of adding water
is done every day.
The condition of microorganisms or mesophilic
bacteria that can grow optimally is in the range of 30-
38
0
C. The waste temperature in bioreactor 1 was in
the range of 30-36
0
C; this is suitable for the process
of decomposition of waste. Meanwhile, the
temperature of waste in bioreactor 2 was in the range
of 30-43
0
C. The pH value of leachate in both
bioreactors tended to be acidic for 30 days. In this
study, the pH value did not reach neutral. Ammonia,
nitrate, and nitrite in both bioreactors have been
formed since the beginning of the study, even though
they initially had relatively low values. Over time, the
concentration of the three experienced an increase in
the day-12 of the study, and then finally decreased on
the day-30.
REFERENCES
Adam, G. A., 2015. Influence of Physical-Chemical Waste
Properties on Waste Volume Reduction and Leachate
Characteristics of an Aerobic and Anaerobic
Bioreactor. Unpublished Master Thesis. Environmental
Engineering Study Program, Department of Civil
Engineering, Faculty of Engineering, Universitas
Indonesia (in Bahasa).
Anindita, Fathia. 2013. Effect of Recirculation Leachate to
Total Suspended Solid (TSS) and Total Dissolved
Solids (TDS) in Lysimeter. Unpublished Bachelor
Thesis. Environmental Engineering Study Program,
Department of Civil Engineering, Faculty of
Engineering, Universitas Indonesia (in Bahasa).
Ayuningtias, L., 2013. Analysis of Leachate Recirculation
Effect in Lysimeter on Ammonia, Nitrite, and Nitrate
Concentration in Leachate. Unpublished Bachelor
Thesis. Environmental Engineering Study Program,
Department of Civil Engineering, Faculty of
Engineering, Universitas Indonesia (in Bahasa).
Central Statistics Agency, 2015. Jambi City in Numbers.
Jambi: BPS Jambi City (in Bahasa).
Damanhuri, E., 2008. Leachate Management. Dictate of
Waste Landfilling-Version 2008, Bandung: FTSL ITB
(in Bahasa).
Dini, A., 2014. Leachate Recirculation Effect Analysis on
Bioreactor Landfill Towards Refuse Decomposition
and Concentration of Ammonia, Nitrate, Nitrite With
Continued Waste Filling Method. Unpublished
Bachelor Thesis. Environmental Engineering Study
Program, Department of Civil Engineering, Faculty of
Engineering, Universitas Indonesia (in Bahasa).
Elagroudy, S. A., Abdel-Razik, M. H., Warith, M. A. &
Ghobrial, F. H., 2008. Waste Settlement in Bioreactor
Landfill Models. Waste Management and Research,
0(0) 1-11.
El-Fadel, M., Fayyard, W., & Jihan, H., 2012. Enhanced
Solid Waste Stabilization In Aerobic Landfills Using
Low Aeration Rates and High Density Compaction.
Waste Management and Research, 0(0) 1-11.
McBean E. A., Rovers F. A., & Farquhar G. J., 1995. Solid
Waste Landfill Engineering and Design. Prentice-Hall,
Inc. A. Simon Schuster Company, Englewood Cliffs,
New Jersey 07632
Purcell, B. E., Butler, A. P., Sollars, C. J., & Buss, S. E.,
1999. Leachate Ammonia Flushing from Landfill
Simulators, J.CIWFM, 13
Rahmawati, H.N., 2017. Effect of Aeration on Leachate’s
Characteristic Results for Organic Vegetable Waste
with Biodrying Method (Case Study: Cabbage).
Environmental Engineering Journal, Vol. 6, No. 1
(2017) Universitas Diponegoro (in Bahasa).
Sethi, S. & Kothiyal, N.C. 2013. Stabilization of Municipal
Solid Waste in Bioreactor Landfills – An Overview.
International Journal Environment and Pollution, Vol.
51.
Tchobanoglous, G., Theisen & Vigil, S. A., 1993.
Integrated Solid Waste Management: Engineering
Principles and Management Issues. McGraw- Hill, Inc.
Singapore.
Vazquez, R.V., 2008. Enhanced Stabilisation of Municipal
Solid Waste in Bioreactor Landfills. Netherlands: CRC
Press/Balkema.
Yatim, E. M. dan Mukhlis. 2013. “Effect of Leachate to
Well Water Around Air Dingin Landfill.” Journal
Public Health 7:2(2013):54-59 (in Bahasa).
Yesiller, N., Hanson, J. L., Yoshida, H. 2011. Landfill
Temperature Under Variable Decomposition
Conditions. Conference Paper in Geotechnical Special
Publication, Geo-Frontiers 2011:1055-1065
Effect of Cover Soil to Concentration of Ammonia, Nitrate, and Nitrite in Leachate with Bioreactor Landfill Simulation
299
