
Comparation Study of Color Reading Method
in Gambier Extract Dyed Batik Fabric
Vivin Atika
1
, Agus Haerudin
1
and Zohanto Widyantoko
1
1
Centre for Handicraft and Batik, Ministry of Industry, 7
th
Kusumanegara Street, Yogyakarta
Keywords: spectrophotometer, mathematics counts, digital image, colour difference.
Abstract: Colour reading has an important role in the study of natural colours on batik, because it is one of few methods
in determining the quality of a dye performance in batik fabric. The commonly used method is using visible
ultra violet spectrophotometer that requires substantial cost and complicated operation system. This study
aims to determine the performance method comparison between visible ultra violet spectrophotometer and
mathematical count from digital images as colour difference test method to evaluate the quality of batik's
natural colours from Gambier extract. We have done sample dyeing from previous research and doing colour
difference test by spectrophotometer. Then we take the sample picture by scanner and measure the L*a*b*
values. We count the colour difference from L*a*b* values using mathematics equation. The L*a*b* and ΔΕ
values from both method are compared by statistical t test and ANOVA test. From the results it was found
that the colour difference value of both methods differ significantly, but each method gave good performance
to measure the colour difference. However, it should be noted that the RGB space model depends on the input,
so the more accurate the digital image with the original sample, the value will be closer to the colour difference
values of laboratory measurements.
1 INTRODUCTION
Natural dyes batik is favourite because of its
unique, exotic and tender, yet classic nuance
colouring. Dewi (2006) in Setiawan, et al (2018) said
that dyeing is also take part in determining the quality
of the batik. Colour reading has a colouring quality
on natural dyes of batik fabric. In batik the colour
reading is there are a few methods such as colour
intensity and colour different test. Colour intensity
and colour different tests were conducted using an
ultraviolet visible spectrophotometer. Colour is
calculated using reflectance data (%R) that is
converted into (K/S) score. The (K/S) score is
approximately amount of colour absorbed in the batik
fabric. In colour measurement methods using the
colour reading method of L*a*b* colour space with
the results hue and chrome.
Digital images are taken by electronic media such
as digital cameras, scanners, smartphones, etc. The
used colour space models are RGB and L*a*b*. RGB
colour model space is using transmitted light to
perform colour. Vary compositions and intensity of
three prime colours, green and blue are used to make
colours cyan, magenta, yellow, and white. This model
is applied by television and computer screens, where
coloured pixels are produced by red, green and blue
electron shots on screen. It really depends on the
apparatus performer.
Colour space models International standards
developed by Commission International d'Eclairage
(CIE) on 1976. L*a*b* is composed by luminance
component or lightness (L score = 0-100) with two
chrome components (-120 to +120): component a,
from green to red and component b, from blue to
yellow. L*a*b* colour space is independent from the
apparatus, but the result is the input or apparatus that
produces images (Yam and Papadakis, 2004).
Besides, in L*a*b* colour space the colour
perception is uniform, so the Euclidean distance
between two colours approximately equal to the
colour difference accepted by human eyes. This
model has a wider coordinates compared to RGB or
CMYK.
The use of digital images as an analytical tool has
been widely used, such as in the fields of health (Tam
and Lee, 2012) and food (Tahir, et al., 2007; Larrain,
et al, 2008, Magdić, et al., 2009; Trinderup and Kim,
2015). Digital image of objects are taken using digital
cameras with certain specifications. RGB data is
18
Atika, V., Haerudin, A. and Widyantoko, Z.
Comparation Study of Color Reading Method in Gambier Extract Dyed Batik Fabric.
DOI: 10.5220/0008525500180023
In Proceedings of the 1st International Conference on Intermedia Arts and Creative Technology (CREATIVEARTS 2019), pages 18-23
ISBN: 978-989-758-430-5
Copyright
c
2020 by SCITEPRESS – Science and Technology Publications, Lda. All rights reserved
taken from digital images in JPEG format and
converted into L*a*b* values using sequential
transformation from RGB to CIE L*a*b* (Konica
Minolta, 1998).
Natural colours come from the extracts of plant
parts, animal waste, and minerals. Natural colour is
obtained by extraction using solvents, either by
heating or not (Pujilestari, et al., 2016). The
compound content in it is very complex, so the colour
distribution is not broad and tends to be uneven. In
addition, it is very difficult to reproduce the same
colour using single natural dyes. So to produce a
good colour, repeated inspections are needed.
Commercial colour measurement involves certain
instruments that require high costs and are not easy to
operate. Natural colouring still experiences problems
in colour uniformity, so that practical methods are
needed in colour reading that can be carried out
repeatedly. Batik optical signals from natural
colouring can be used as digital images using various
devices such as colour sensors, cameras and ordinary
scanners.
The purpose of this study is to determine the
performance method comparison between visible
ultra violet spectrophotometer and mathematical
calculation from digital images as colour difference
test method to evaluate the quality of batik's natural
colours from Gambier extract.
2 RESEARCH METODOLOGY
2.1 Experimental Design and Sampling
Samples used in this study were 12 pieces. They
were cotton and silk dyed with Gambier extract.
Gambier extract obtained by heat extracting at
temperature of 100°C for 2 hours using water and
cold soaking with alcohol for 4 days. The extract was
then used to dye the fabric by 6 times dipping. The
dyed fabric were putting into post-mordant using
fixative agent alum, ferrous sulphate and limestone.
2.2 Colour Measurements
Existing samples were measured for colour
reading using spectrophotometry to determine the
value of the lightness (L*), redness (a*) and
yellowness (b*). This value will be the real L*a*b*
value. Digital image of the samples were taken using
canon LiDE 120 scanner with optic resolution
specification 2400 x 4800 dpi and 16 bit deep for each
colour. The estimated L*a*b* value were obtained
from digital image of samples using mathematical
calculation approach.
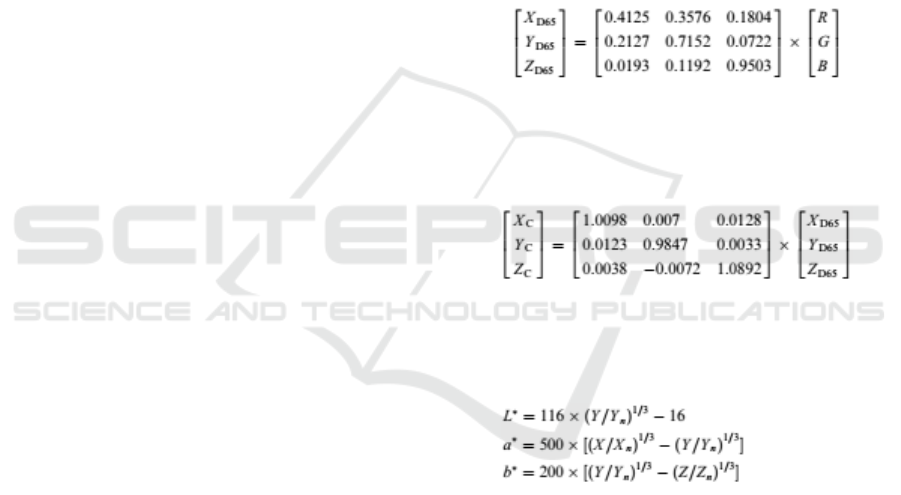
RGB colour measured from digital image, then
converted into CIE L*a*b* colour space using the
sequential transformation from sRGB to XYZD
65
to
XYZ
C
(Pascale, 2003 in Larrain et al., 2008) and from
XYZ
C
to CIE
C
L*a*b* (Konica Minolta, 1998 in
Larrain et al., 2008). The subscript letter referring to
illuminator used.
Referring to Larrain et al. (2008), sRGB value
were linearized by dividing with 255 and then
applying a decoding exponent of 2.2. This decoding
exponent corresponded to 1/γ using a simple
encoding γ of 0.45. Then, linear sRGB was converted
to XYZD65 using the matrix transform (Pascale,
2003):
(1)
Then XYZD65 was converted to XYZC using the
Bradford matrix transform (Pascale, 2003)
:
(2)
Finally, the following equations were used to
convert XYZC to CIEC L*a*b* (Konica Minolta,
1998):
(3)
Where Xn, Yn, and Zn are the values for X, Y,
and Z for the illuminator used, in this case 0.973,
1.000, and 1.161 respectively. Also, (X/Xn)1/3 was
replaced by [7.787 x (X/Xn) + 16/116] if X/Xn was
below 0.008856; (Y/Yn)1/3 was replaced by [7.787 x
(Y/Yn) + 16/116] if Y/Yn was below 0.008856; and
(Z/Zn)1/3 was replaced by [7.787 x (Z/Zn) + 16/116]
if Z/Zn was below 0.008856 (Konica Minolta, 1998).
The real and estimated value of L*a*b* from the
sample are then calculated for colour difference (ΔE)
using the following formula:
∆
√
(4)
Comparation Study of Color Reading Method in Gambier Extract Dyed Batik Fabric
19
All values were collected in form of data group to be
used for further analysing.
2.3 Statistical Calculation
Statistical analysis was performed using the t-test
and ANOVA using α = 0.05, with the hypothesis that
there were no significant differences between groups
of real and estimated data of each value of L*, a*, b*
and ΔE also the measuring tool were giving the same
effect on calculated values.
Data was then plotted to find out the linear
regression equation and provided a correlation
coefficient (R). Thus we could find how much the
relationship/correlation between treatment, real and
estimated value of L*, a*, b*, and ΔE. The relation of
each data were used to described the comparison of
performance colour reading method by
spectrophotometry and digital image analysis using
mathematical calculation.
3 RESULTS AND DISCUSSIONS
3.1 L*a*b* Scores
The measurements results are in the form of real and
estimated data groups from 12 fabric samples and
digital images. Data images and each data group
consists of L*, a*, b* values are presented in Table 1.
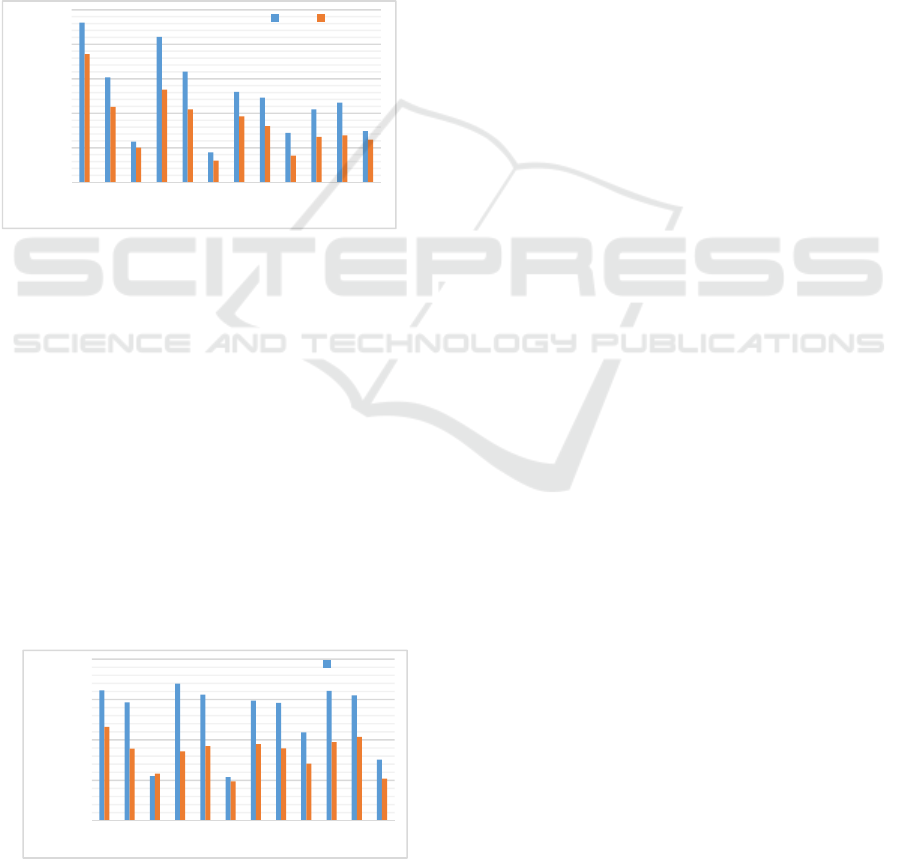
3.2 ΔΕ Score Analysing
The value of ΔΕ obtained from 12 samples were
amount to 66 pieces of data. The analysis was carried
out by the t-test and ANOVA statistical method. The
t-test hypothesis used is that there is no difference
between the real and estimated ΔE value, with the H
0
starting criterion when t count < t table. The result is
t count = 8.10 > from t table = 2.39, H
0
is rejected.
Statistical calculations ANOVA test with α = 0.05
and hypothesis that there are no significant different
effect between measuring tools and calculated data.
The result of ANOVA test is, P value = 1.9072 E-11
< α = 0.05, H
0
is rejected. The two statistical analysis
results means that the real data is different from the
estimation, so the results of direct measurements from
the fabric using spectrophotometers and
measurements using digital images are significantly
different. Moreover the both measuring tools were
giving different effect on data.
The data are then plotted to find out its linear
regression equation, by giving a correlation
coefficient (R) = 0.94, so that between treatment, real
and estimation value of ΔΕ, there are quite
relationship/correlation. This is in accordance with
Figure 1, which in the graph shows the same trend
between real and estimated ΔΕ.
Figure 1: Graphic of real versus estimated ΔE
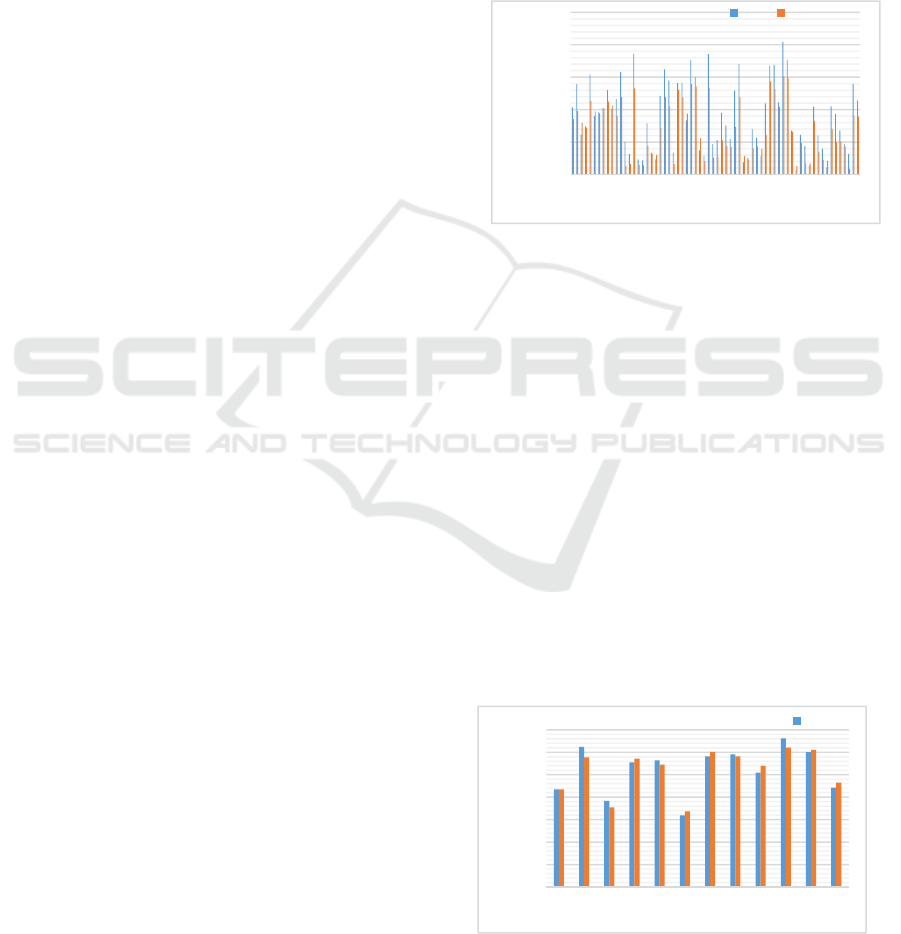
3.3 Lightness Score Analysing
Lightness (L*) single scores are analysed with
statistical t-test and ANOVA calculations. From t-test
results, obtained t score = 0.32 > from t table = 2.72,
so that H
0
is accepted. From ANOVA test with α =
0.05, giving P value = 0.76 > α = 0.05. So, H
0
is
accepted. Both t-test and ANOVA doesn’t show any
significant differences between real and estimated L*
value.
The data are plotted to find out the linear regression,
by giving correlation coefficient (R) = 0.97, so that
between variables, real and estimated L* there are
relation/correlation. This is in accordance with Figure
2, which is in the graphic showing the same trend
between real and estimation.
Figure 2: Graphic of real versus estimated L*
-
10.00
20.00
30.00
40.00
50.00
1 5 9 1317212529333741454953576165
ΔE
samples
real estimated
-
10.0
20.0
30.0
40.0
50.0
60.0
70.0
ABCDE FGH I JKL
L*
Samples
real
CREATIVEARTS 2019 - 1st International Conference on Intermedia Arts and Creative
20
3.4 a* Score Analysing
The value of redness (a*) is analysed statistically by
the t test. From the results of the t test, the value of t
= 6.68 > from t table = 2.72, so that H
0
is rejected.
From ANOVA test with α = 0.05, giving P value =
0.000035 < α = 0.05. So, H
0
is rejected. Both test
result shows that there is a difference between real a*
and estimated a*. The two colour measuring tool also
gives difference effect to form data results.
The data plotted to find out the linear regression
equation, providing R = 0.97. Between treatment, real
and estimated a* value is having correlation or
showing the same trend, in accordance with Figure 3.
Figure 3: Graphic of real versus estimated a*.
3.5 b* Score Analysing
The value of yellowness (b*) is analysed using the t
test. From the results of the t test, the value of t count
= 6.19 > from t table = 2.72, so that H
0
is rejected.
ANOVA test with α = 0.05, giving P value =
0.000068 < α = 0.05. So, H
0
is rejected. This also
shows that there are any significant difference
between real and estimated b* value. Both measuring
tool also gives difference effect on resulting the data.
Linear regression from data provides R = 0.91.
Treatment, real and estimation value of b* are having
correlation. This is in accordance with Figure 4,
where the real and estimated data both shows the
same trend on the graphic.
Figure 4: Graphic of real versus estimated b*.
From the statistical calculation t-test and ANOVA for
ΔE, a* and b*, there are significantly difference
performance on two measuring tool in resulting
colour reading data but highly correlated.
The difference on data results can be caused by
difference source of subject that are measured.
Spectrophotometer measure directly from existing
dyed fabric and mathematical calculation estimate
colour reading value from digital image. There are
bias in measurement because of few factors. Digital
image are RGB based. The L*a*b*'s colour space
cover larger gamut compared to RGB. So that L*a*b*
readings from RGB digital images cannot show
precise colour coordinates location (Yam &
Papadakis, 2004). The use of image converter as
input/input for reading RGB values to the sample lab
also has an effect. Light source of the measuring tool
can also give effect on measuring data results.
Illuminator C in colorimeter puts more emphasis on
the red portion of the light spectrum than cool white
fluorescent light in digital image converter (Larrain,
et al., 2008).
In this study, L* statistical calculation shows no
difference performance. Yet in linear regression
plotting, all data give high R. Means that both
measuring tools are correlated. O’Sullivan, et al.
(2003) and Larrain, et al. (2008) said that in their
study instrumental colour measurements taken from
digital images were more highly correlated than
colorimeter values. This is due to possibility of full
surface evaluation of digital images will get more
representative sampling.
From the result, even though there are bias, digital
image can be used as simple and easy method to
predict or estimate L*a*b* and colour difference
value for natural batik dyed fabric inspection. The
choice of the right digital image converter also
influence the result of measurement. The more it can
convert closely to real image, the more precise the
value obtained.
-
5.0
10.0
15.0
20.0
25.0
ABCDE FGH I J KL
a*
samples
real estimated
-
10.0
20.0
30.0
40.0
ABCDE FGH I J KL
b*
samples
real
Comparation Study of Color Reading Method in Gambier Extract Dyed Batik Fabric
21
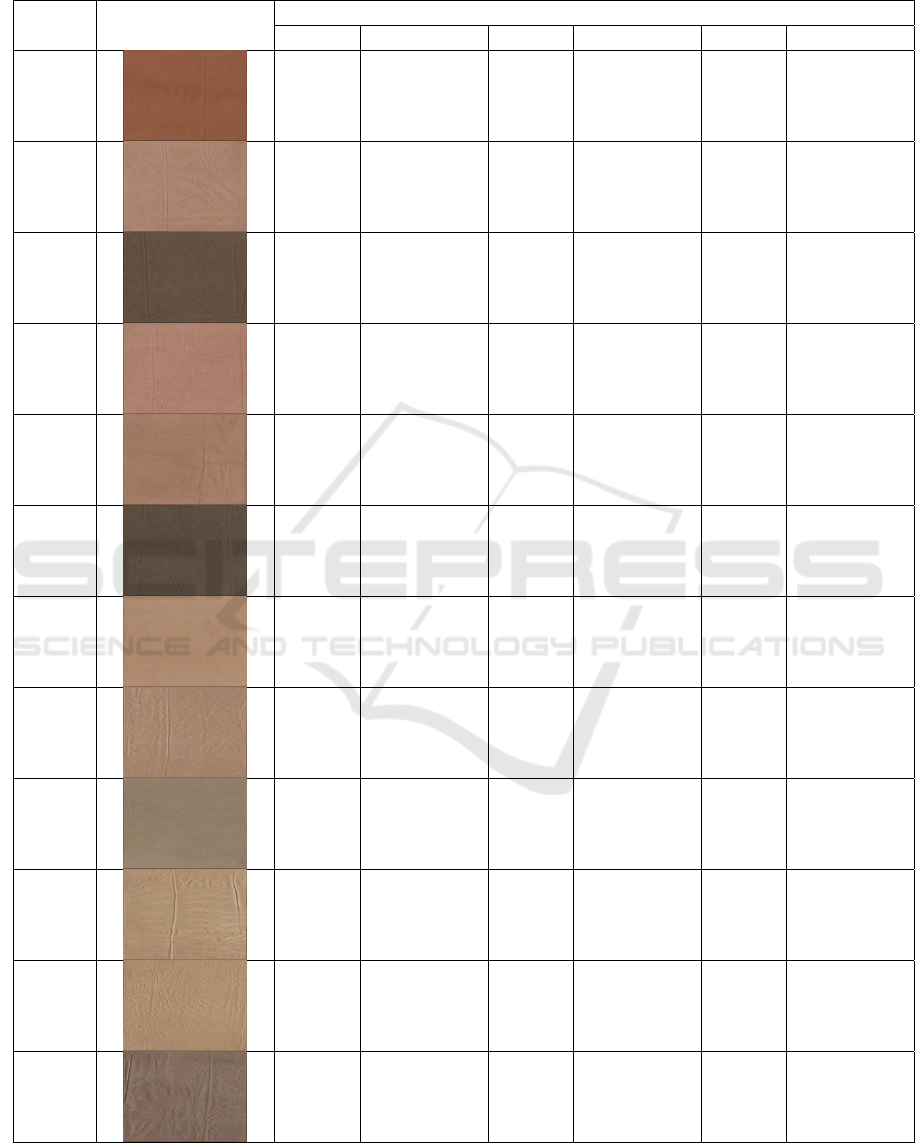
Table 1: Group of real and estimated L*a*b* scores of cotton and silk dyed with Gambier extract.
Samples Digital Image
Value of measurements
Real L* Estimated L* Real a* Estimated a* Real b* Estimated b*
A
43.46 43.43 23.16 18.58 32.30 23.24
B
62.34 57.69 15.21 10.92 29.32 17.88
C
38.32 35.43 5.89 5.02 11.04 11.66
D
55.51 57.14 21.09 13.44 33.96 17.15
E
56.39 54.49 16.02 10.58 31.24 18.49
F
31.85 33.67 4.34 3.14 10.81 9.72
G
58.15 60.10 13.11 9.56 29.76 18.98
H
59.10 58.18 12.29 8.13 29.20 17.93
I
50.95 53.99 7.16 3.87 21.90 14.12
J
66.23 62.09 10.56 6.58 32.13 19.47
K
60.03 61.01 11.55 6.79 31.04 20.77
L
44.29 46.46 7.42 6.18 15.14 10.40
CREATIVEARTS 2019 - 1st International Conference on Intermedia Arts and Creative
22

4 CONCLUSIONS
From the results it was found that the colour
difference value of both methods differ significantly,
but each method gave good performance to measure
the colour difference. However, it should be noted
that the RGB space model depends on the input, so
the more accurate the digital image with the original
sample, the value will be closer to the colour
difference values of laboratory measurements. The
colour measurement method using spectrophotometer
and mathematical calculations from digital images
can be used. However, these two methods cannot
replace each other because RGB is very dependent on
the input produced by the scanner.
ACKNOWLEDGEMENTS
This research was established by funding from Centre
for Handicraft and Batik, Ministry of Industry. We
also give high appreciation for all supported partners
in this research.
REFERENCES
Dewi, S.T., 2006. Analisis Pengaruh Orientasi Pasar dan
Inovasi Produk Terhadap Keunggulan Bersaing
Untuk Meningkatkan Kinerja Pemasaran (Studi
pada Industri Batik di Kota dan Kabupaten
Pekalongan). Universitas Diponegoro. Available at:
http://eprints.undip.ac.id/15810/.
Larrain, R.E., Schaefer, D.M. & Reed, J.D., 2008. Use of
Digital Images to Estimate CIE Color Coordinates of
Beef. Food Research International, 41, pp.380–385.
Magdić, D. et al., 2009. Impact analysis of different
chemical pre-treatments on colour of apple discs
during drying process. Croatian Journal of Food
Science and Technology, 1(1), pp.31–35. Available
at: https://hrcak.srce.hr/58696.
Minolta, K., 1998. Precise color communication: Color
control from perception to instrumentation. Konica
Minolta Sensing, Inc.
O’Sullivan, M. G., Byrne, D. V., Martens, H., Gidskehaug,
L.H. & Andersen, H. J., & Martens, M., 2003.
Evaluation of pork colour: Prediction of visual
sensory quality of meat from instrumental and
computer vision methods of colour analysis. Meat
Science, 65(2), pp.909–918.
Pascale, D., 2003. A review of RGB color spaces from xyY
to R’G’B’. The Babel Color Company.
Pujilestari, T. et al., 2016. Pemanfaatan Zat Warna Alam
Dari Limbah Perkebunan Kelapa Sawit dan Kakao
Sebagai Bahan Pewarna Kain Batik. Dinamika
Kerajinan dan Batik, 33(1), pp.1–8.
Setiawan, J. et al., 2018. Kesesuaian Batik Tulis IKM
Berdasarkan SNI 08-0513-1989. Jurnal
Standardisasi, 20(1), pp.69–76. Available at:
http://js.bsn.go.id/index.php/standardisasi/article/vie
w/618/pdf_1.
Tahir, A.R. et al., 2007. Evaluation of the effect of moisture
content on cereal grains by digital image analysis.
Food Research International, 40, pp.1140–1145.
Tam, W.K. & Lee, H.J., 2012. Dental Shade Matching
Using a Digital Camera. Journal of Dentistry, 40(2),
pp.e3–e10. Available at:
https://www.sciencedirect.com/science/article/pii/S
0300571212001492?via%3Dihub.
Trinderup, C.H. & Kim, Y.H.B., 2015. Fresh Meat Color
Evaluation Using a Structured Light Imaging
System. Food Research International, 71, pp.100–
107.
Yam, K.L. & Papadakis, S.E., 2004. A Simple Digital
Imaging Method For Measuring and Analyzing
Color of Food Surfaces. Journal of Food
Engineering, 61, pp.137–142.
Comparation Study of Color Reading Method in Gambier Extract Dyed Batik Fabric
23
