
Time-driven Activity based Costing Method for Calculating Unused
Capacity of Endoscopy Services: A Case Study of XYZ Hospital
Roberta Fifin Amandaningrum and Thomas H. Secokusumo
Faculty of Economic and Business, Universitas Indonesia, Jl. Salemba Raya No. 4 Jakarta 10430, Indonesia
Keywords: Hospital, Time-Driven Activity based Costing, Cost Analysis, Unused Capacity, Indirect Cost, Endoscopy.
Abstract: Competition in the healthcare industry and the growth of Endoscopy services prompted XYZ Hospital to
evaluate the cost of its services. Management of quality and cost control are key to success in applying value-
based healthcare strategy. The purpose of this case study is to demonstrate how Time-Driven Activity Based
Costing (TDABC) method is applied in Endoscopy unit of XYZ Hospital by understanding the service
processes and the indirect cost allocation using time as the main cost driver so that unused capacity can be
identified, and capacity-based income statement can be prepared for better cost control. This is a descriptive
case study with qualitative and quantitative approaches through cost analysis in the Endoscopy unit. Data
collection based on XYZ Hospital database from January to December 2017 and the results of interviews and
a direct observation conducted in October and November 2018. The result of this case study concludes that
TDABC enables detail and accurate cost and profitability analysis of endoscopy services where indirect costs
are allocated according to the actual usage of resources. Therefore, the efficiency indicator for cost control
can be clearly defined and more measurable by showing the unused capacity of each resource group in the
capacity-based income statement.
1 INTRODUCTION
The hospital industry is trying hard to run its business
process efficiently by always stressing on quality
control, cost control, and patient safety. With the
purpose of cost control implementation, hospital
needs to do cost analysis with appropriate cost
method for all its services. Result of cost analysis will
be used for the decision maker in making policies
about efficiency program, pricing, and business
development strategy. (Porter, Michael E.; Lee, 2013)
The number of hospitals in Indonesia has
increased by around 1,000 hospitals since 2011 until
2017. The growth of hospitals per year reached 13.3%
in 2011 to 2014 and then weakened to around 4.4%
per year in 2014 until 2017. In 2017, 63% of the total
2,724 hospitals in Indonesia were private hospitals.
(Britton, Koseki, & Dutta, 2018)
Since January 1
st
, 2014, Indonesia healthcare
industry has been transforming by the
implementation of Jaminan Kesehatan Nasional
(JKN) conducted by Badan Penyelenggara Jaminan
Kesehatan (BPJS). Until 2017, member of BPJS is
estimated around 175 million people. However, most
of the tariff assigned by BPJS (INA CBGs) are far
below the economic price of private hospital
operations. This gap between the regular tariff of the
hospital and the tariff assigned by BPJS put the
healthcare industry in a big challenge. (Thabrany,
2017).
The hospital business is basically a capital and
labor intensive and carrying out business as well as
social functions. This condition requires operational
management to balance its profitability, service
quality and socio-economic conditions of the
community.
A systematic review of literature conducted by
Keel et al. in 2017 shows that nowadays the
healthcare industry is eagerly applying value-based
healthcare strategy. The hospital’s ability to
understand the cost of care and calculate it
appropriately will enable the hospital in evaluating its
health outcomes and cost for better value delivery.
The study also shows that Time-Driven Activity
Based Costing (TDABC) is a cost accounting system
that applicable in the hospital industry and can help
the hospital in managing cost efficiently. (Keel,
Savage, Rafiq, & Mazzocato, 2017)
XYZ Hospital is type B hospital which is
accommodated by outpatient and inpatient facilities
380
Amandaningrum, R. and Secokusumo, T.
Time-Driven Activity based Costing Method for Calculating Unused Capacity of Endoscopy Services: A Case Study of Xyz Hospital.
DOI: 10.5220/0008431503800387
In Proceedings of the 2nd Inter national Conference on Inclusive Business in the Changing World (ICIB 2019), pages 380-387
ISBN: 978-989-758-408-4
Copyright
c
2020 by SCITEPRESS – Science and Technology Publications, Lda. All rights reserved
with 355 beds and operated total by 1.400 employees.
The number of endoscopy procedures has been
growing about 15% in 2017 (873 procedures) from
2016.
XYZ Hospital has been struggling in estimating
cost per service care and valuating hospital
profitability. Cost calculation in XYZ Hospital is
carried out by traditional cost accounting method
which allocates hospital overhead cost by its service
volume. This cost allocation method creates flat cost
allocation for each service or procedure, therefore,
some services are overcosted or undercosted.
The implementation of Time-Driven Activity-
Based Costing (TDABC) in healthcare has been
growing and has shown its strengths. TABCD simply
use time as the main cost driver, replacing many cost
drivers in Activity-Based Costing method. TDABC
delivers a powerful method for cost analysis because
it provides more accurate cost method than the
traditional method and simpler than Activity-based
costing (Demeere et al.; 2009)
2 METHODOLOGY
This study is a single-case (holistic) design type. This
is a descriptive case study with a qualitative and
quantitative approach through cost and profitability
analysis in the Endoscopy unit. This study illustrates
the application of cost calculation of Endoscopy
procedures in the Endoscopy unit of XYZ Hospital
using Time-Driven Activity Based Costing method.
(Yin, 2013).
Data collection were from primary and secondary
data. Primary data were collected from the interview
result. Interviews were conducted in October and
November 2018 for a Head of Endoscopic Unit, one
internal medicine physicians and two nurses in
Endoscopic unit. Secondary data were collected from
accounting and transaction reports (billing report) of
January – December 2017 and also standard operating
procedures of the endoscopic unit.
2.1 Framework of TDABC Steps
In this study, the steps of applying the TDABC
method was adopted from a pilot study on the
implementation of TDABC at the Metro Health's
Outpatient Clinic (Clark & Sopariwala, 2017), and
are complemented by the studies conducted by
(Campanale, Cinquini, & Tenucci, 2014) and (Keel et
al., 2017).
The steps of applying the TDABC method at the
XYZ Hospital are as follows:
1. Mapping The Process of Endoscopy Procedures
2. Identifying Cost of Resource Group (Cost of
Capacity Supplied)
3. Determining Practical Capacity of Resource
Group (Minutes)
4. Calculating Cost of Resource Group per Minute
(Capacity Cost Rate)
5. Determining The Numbers of Procedures
6. Obtaining Time Estimation of Each Procedure
7. Calculating Total Time Usage and Cost for Each
Resource Group
8. Determining Unused Capacity Costs and Creating
Capacity-Based Income Statement.
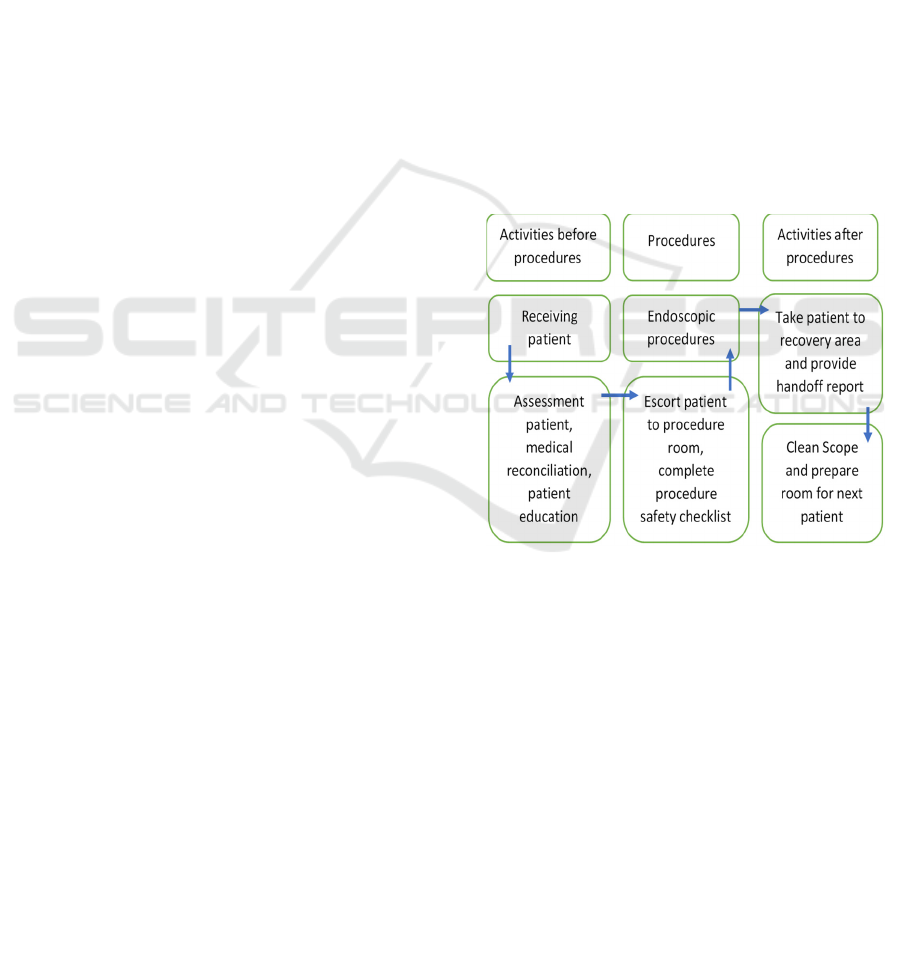
The process mapping shows what resources (who) are
used to carry out activities during certain times and its
frequencies (how). At this stage, the resource group
is identified.
The process stages of endoscopy procedures were
generated from the hospital's standard operating
procedures of the endoscopy unit and the interview
results.
Figure 1: The main activities for endoscopic procedures.
In identifying cost of capacity supplied, the direct
and indirect costs are determined into each group of
resources used. Direct and indirect cost data are
obtained from accounting reports.
Practical capacity is obtained by identifying the
capacity of the resource group used such as employee
work hours, hours of machine/tool usage. The
practical capacity does not include breaks or
downtime. The number of hours of effective work
(practical capacity) is set in minutes.
The amount of capacity cost rate is determined by
dividing the cost of capacity supplied with practical
capacity, the formula can be seen in equation (1). At
this stage, capacity cost rates are calculated for each
resource group.(Kaplan & Anderson, 2007).
Time-Driven Activity based Costing Method for Calculating Unused Capacity of Endoscopy Services: A Case Study of Xyz Hospital
381
Cost of capacity supplied
Capacity cost rate =
Practical capacity of
resources supplied
(1)
The number of frequency of activities (endoscopy
procedures) is attained from transaction data in the
hospital information system.
Time estimation of each endoscopic procedure
can be identified from interviews with key parties
(physicians, nurses, etc.) The time estimates gained
from the interviews can be validated through direct
observation of Endoscopic procedures
The actual total time (minutes) used by each
activity (endoscopic procedure) is the result of the
time estimation of procedure multiplied by the
volume of procedure. While the total cost used for all
endoscopic procedures is obtained by multiplying the
total estimated time of each procedures with the cost
per minute (the capacity cost rate).
The total cost is the sum of the costs of each
procedure. If the total cost of all procedures is smaller
than the cost of capacity supplied, then the difference
is the cost for unused capacity. By knowing the
unused capacity costs of each resource group per
procedure, a Capacity-Based Income Statement can
be prepared.
3 RESULTS AND DISCUSSION
3.1 The Implementation of TDABC
3.1.1 The Process of Endoscopic Procedures
The service process in Endoscopy unit of XYZ
Hospital is carried out in 3 stages, namely pre-
procedure, intra procedure and post procedure. From
service process mapping (figure 2), it can be
identified resource used in each service activities
which are personnel (physicians, nurses), room,
equipment, supplies (drugs).
Figure 2: The main activities for endoscopic procedures.
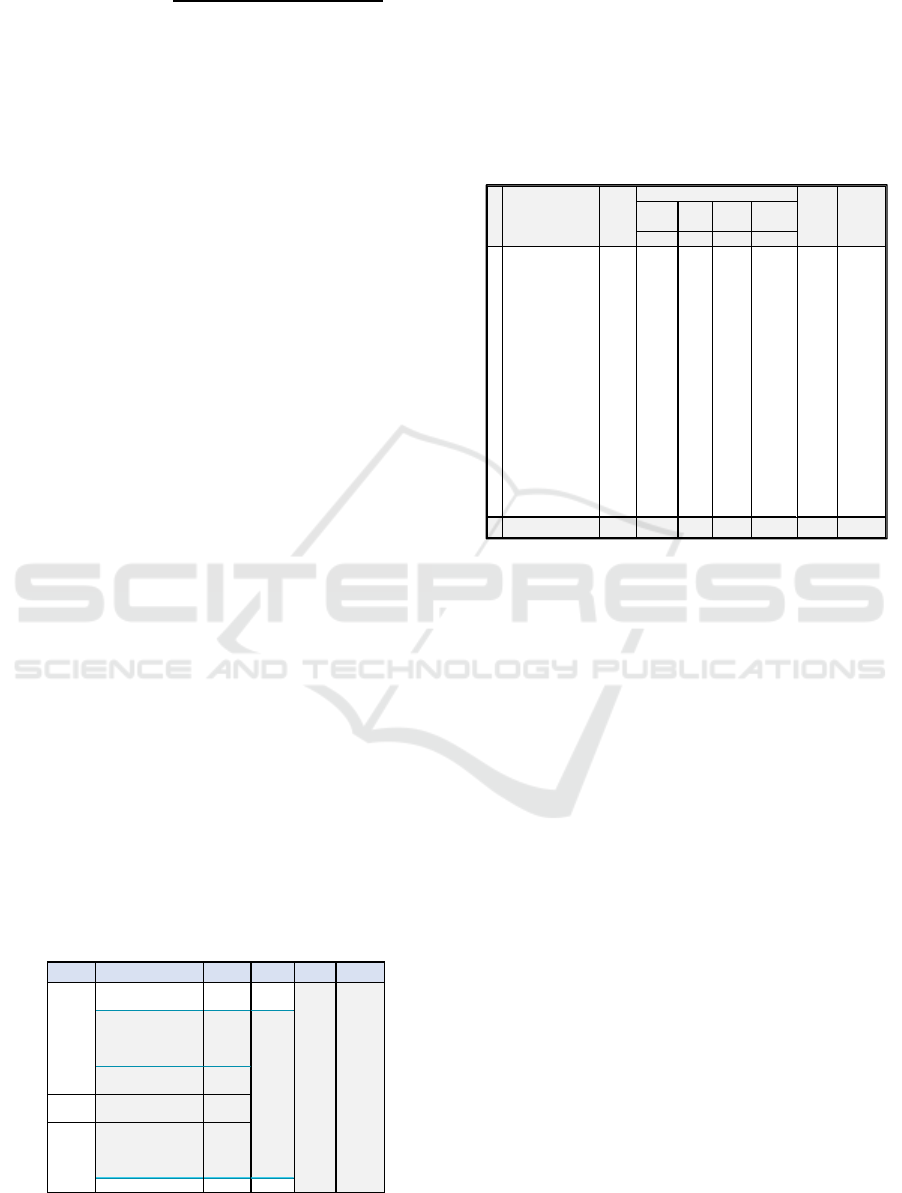
3.1.2 Cost of Capacity Supplied
After resource groups (personnel, room, equipment,
supplies) are identified, the next step is to identify
each cost of capacity supplied of resource groups for
each endoscopy procedure. This step group costs into
direct costs, indirect costs and not allocated costs.
Table 1: Cost of Capacity Supplied of Resource Group.
In Table 1, as income statement report of 2017,
the total direct cost consisting of physician and nurse
fee, drugs and other medical supplies expenses is
Rp.1.759 million. Total indirect cost amount to
Rp.1.060 million consisting of personnel expenses
(salary etc.) Rp. 342 million, room expenses
(electricity, maintenance, etc.) Rp. 82 million,
medical equipment expenses (depreciation,
maintenance, etc.) Rp. 636 million. Not allocated cost
which consists of office department and other
supplies expenses amount to Rp. 171 million.
Office department expenses are not directly
related to procedure activities, while other supplies
expenses are difficult to trace as direct costs for each
endoscopy procedure. Hence, these costs are included
in the not allocated cost group which will be
presented separately in capacity-based income
statement. So that costs can be analyzed in more
detail and accurately. (Sopariwala, 2017)
3.1.3 Practical Capacity
Determining the practical capacity of a resource
group is based on the effective working hours of the
personnel because room and medical equipment can
only function when there are nurses operating.
The number of working hours in 2017 is 291 days
(1.790 hours). The total effective working hours per
year for 1 nurse is 1.790 working hours – (12 day off
Stages Activity Personnel Equipment Room Direct Cost
Assessmen patient, medical
reconciliation, patient education
Physicians,
Nurses
Procedures safety checklist,
patient observation, equipment
preparation, patient's data,
physicians colaboration
Physicians,
Nurses
Premedication & sedation Physicians,
Nurses
Intra
Procedure
Endoscopy Procedures Physicians,
Nurses
Physicians : prepare patient's data
image and handoff report . Nurse
1: oberserve patient reponse.
Nurse 2: Clean scope.
Physicians,
Nurses
Prepare room for next patient Nurse
Pre
Procedure
Endoscopy
Room
Drugs, other
supplies,
physicians &
nurse's fee
Medical
Equipment
Post
Procedure
Description
(In Million Rupiah) Person-
nel
Room Equip. Total
Allocated
a b c d=a+b+c
1 Physicians &
Nurses's fee
1.295 1.295
2 Personnel's Salar
y
342 342 342
3Su
pp
lies
(
dru
g
s
)
465 465
4 Maintenance
(electricity, water,
building, laundry,
sterilization
)
72 72 72
5 Office Departemen
Ex
p
enses
155 155
6 Other supplies
(
office stationar
y)
15 15
7 Medical Equipment
(maintenance,
depreciation,
re
p
lacement cost
)
636 636 636
8 Building
De
p
reciatio
n
9 9 9
Total Expenses 2.990 342 82 636 1.060 1.759 171
Not
Allocated
No Total
Expen-
ses
Indirect cost
(
In Million Ru
p
iah
)
Direct
Cost
ICIB 2019 - The 2nd International Conference on Inclusive Business in the Changing World
382
x 7 hours/day) – (45 training hours) – (10 minutes
briefing x 291 days) – (1 meeting hour x 52 week) –
(1-hour meeting x 12 months) = 1.536 hours per
person /year. The total practical capacity of personnel
for 3 nurses is 276.420 minutes per year. (Table 2).
The practical capacity of the endoscopy room
with 2 bed for procedures and 1 bed for emergency is
184.280 minutes per year (Table 3)
Table 2: Practical Capacity of Personnel.
Resource
Groups
Hours/
Year
Minutes/
Year
Hours/
Person/
Day
Minutes/
Person/
Day
Personnel
(3 nurses)
4.607 276.420 5,3 317
Table 3: Practical Capacity of Room.
Resource
Groups
Hours/
Year
Minutes/
Year
Hours/
Bed/
Day
Minutes/
Person/
Day
Room
(2 bed)
3.071 184.280 5,3 317
While, the practical capacity per year of medical
equipment is 2.027.080 minutes obtained from the
sum of practical capacity of each medical equipment
(Table. 4). Practical capacity of each type of
equipment is calculated by the quantity of equipment
multiply by minutes per day of practical capacity for
291 days.
3.1.4 Capacity Cost Rate
Calculation of the capacity cost rate per minute of
each resource group (Table 5) is done by dividing the
cost of capacity supplied by practical capacity per
year for each resource group (personnel, room,
equipment).
Table 4: Practical Capacity of Equipment.
Table 5: Capacity Cost Rate of Resource Groups.
Resource
Group
Cost of Capacity
Supplied
(million Rp)
Practical
Capacity per
Year
(minutes)
Capacity Cost
Rate
per Minute
(million Rp)
(a) (b) (c=a/b)
Personnel 342 276.420 0,001239
Room 82 184.280 0,000443
Equipmen
t
636 2.027.080 0,000314
Table 6: Capacity Cost Rate of Equipment.
Moreover, the breakdown of the cost of each type
of equipment is described in Table 6. Cost of capacity
supplied of each type of equipment is generated from
medical equipment expenses (depreciation,
maintenance, etc.).
3.1.5 Frequency of Procedures
After knowing the capacity cost rate for each resource
group, the next step is to determine the frequency of
each endoscopy procedure.
It can be seen in Table 7, there are 3 types of
Endoscopy procedures namely Gastroscopy,
Colonoscopy and Bronchoscopy. There are also types
of procedures based on a combined variation of 2
types of procedures and 3 types of procedures taken
in one episode.
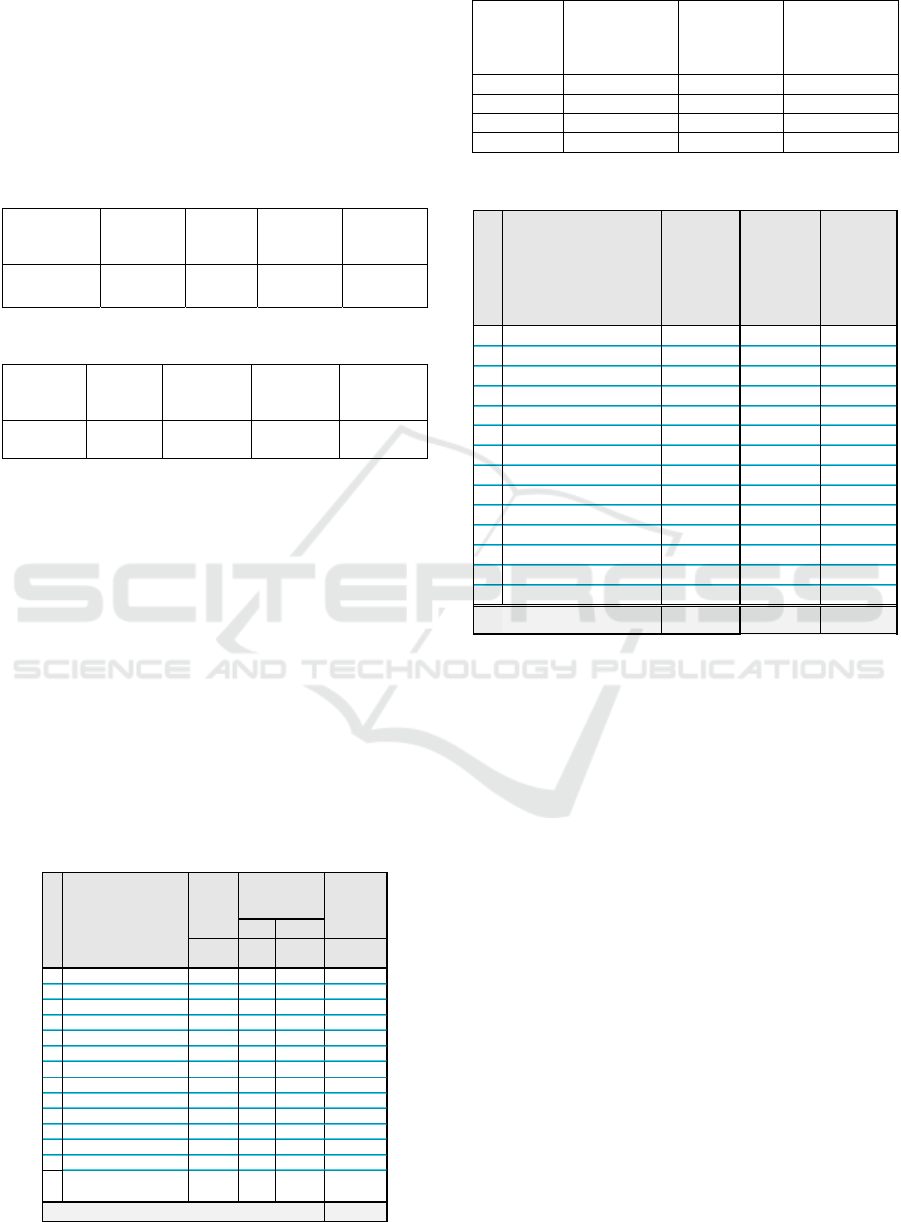
3.1.6 Time Estimation of Each Procedures
Time estimation for Endoscopy procedures are shown
in table 7. The purpose of determining the time
estimation (minutes) of resource used in each
endoscopy procedure is to become a basis for indirect
cost allocation using the TDABC method. Time
Equipment
Hours M inute s (M inute s)
a b c d = a x c x
291 days
1Patient Bed 2 5,3 317 184.280
2Patient Monitor 2 5,3 317 184.280
3 Patient Troley 2 5,3 317 184.280
4 SterilizationTroley 2 5,3 317 184.280
5 Video scope Set 2 5,3 317 184.280
6 Medical Image Station 2 5,3 317 184.280
7 Suction Pump 1 5,3 317 92.140
8 Gastrovideoscope 2 5,3 317 184.280
9 Colonvideoscope 2 5,3 317 184.280
10 Bronchovideoscope 1 5,3 317 92.140
11 Electromic Surgical Unit 1 5,3 317 92.140
12 Duodenovideoscope 1 5,3 317 92.140
13 Anesthesia Machine 1 5,3 317 92.140
14 Flushing Aid (used all
together per procedure)
45,3 317 92.140
Total (Minutes) 2.027.080
Quantity Practical
Ca
p
acit
y
(per day)
Practical
Capacity
(per year)
Resource Grou
p
Me dical Equipments
(million Rp) (minutes) (million Rp )
1 Patient Bed 5 184.280 0,000029
2 Patient Monitor 13 184.280 0,000070
3 Patient Troley 6 184.280 0,000032
4 SterilizationTroley 3 184.280 0,000018
5 Video scope Set 116 184.280 0,000628
6 Medical Image Station 9 184.280 0,000050
7Suction Pump 3 92.140 0,000036
8 Gastrovideoscope 121 184.280 0,000657
9 Colonvideoscope 109 184.280 0,000592
10 Bronchovideoscope 23 92.140 0,000249
11 Electromic Surgical Unit 133 92.140 0,001442
12 Duodenovideoscope 39 92.140 0,000420
13 Anesthesia Machine 39 92.140 0,000427
14 Flushing Aid 16 92.140 0,000176
Total 636 2.027.080 0,000314
Cos t of
Capacity
Supplie d
Practical
Capacity
per Ye ar
Capacity
Cos t Rate
per Minute
Time-Driven Activity based Costing Method for Calculating Unused Capacity of Endoscopy Services: A Case Study of Xyz Hospital
383
(minutes) is the main cost driver in determining the
indirect cost allocation to each procedure.
Table 7: Time Estimation.
The use of personnel and room resource has begun
since the patient admission process when there is
interaction with nurses and physicians as well as the
use of room and bed. The use of medical equipment
begins when the medical equipment is prepared for
procedures.
The use of personnel resource is influenced by the
number of personnel need in carrying out a procedure.
Some procedures can be carried out simultaneously
with 3 nurses so that some procedures use 1,5 nurses
per procedure. Total personnel time is the total time
spent by all nurses.
Table 8: Time Usage of Resource Groups (minutes).
3.1.7 Total Time Usage and Cost for Each
Resource Group
The total time spent for personnel, rooms and medical
equipment is gained from time estimation multiply by
frequency of procedures. The total time of resource
used is 121.678 minutes. The use of a room is 68.436
minutes, and the overall use of medical equipment is
447.838 minutes. (Table 8.)
After the time usage of personnel, room and
equipment is defined, then the next step is calculating
the total cost of each resource group.
Room
Equip-
me nt
I
Gastroscopy
1 Gastroscopy without Biopsy 43 90 60 360
2 Gastroscopy with Biopsy 501 93 62 376
3 Ligation of Esophageal Varices 22 105 70 440
4 Gastric Polypectomy 3 300 100 760
II Kolonoskopi
1 Colonoscopy without Biopsy 60 125 83 544
2 Colonoscopy with Biopsy 92 128 85 560
3 Colon Polypectomy 7 330 110 850
4 Rectosigmoidoscopy without Biopsy 1 98 65 400
5 Rectosigmoidoscopy with Biopsy 11 101 67 416
III Bronkos kopi
1 Bronchoscopy without Biopsy 22 390 130 1.030
2 Bronchoscopy with Biopsy 19 420 140 1.120
IV Combination 2 Procedures
1 Gastroscopy without Biopsy & Gastric
Polypectomy
1
405 135 1.015
2 Gastroscopy without Biopsy & Ligation of
Esophageal Varices
8
210 105 670
3 Gastroscopy with Biopsy & Ligation of
Esophageal Varices
1
214 107 686
4 Gastroscopy without Biopsy &
Colonoscopy without Biopsy
2
276 138 962
5 Gastroscopy with Biopsy & Colonoscopy
with Biopsy
28
284 142 998
6 Gastroscopy with Biopsy & Colonoscopy
without Biopsy
33
280 140 980
7 Gastroscopy without Biopsy &
Rectosigmoidoscopy with Biopsy
1
244 122 818
8 Gastroscopy with Biopsy &
Rectosigmoidoscopy with Biopsy
1
248 124 836
9 Gastroscopy with Biopsy &
Rectosigmoidoscopy without Biopsy
2
244 122 818
10 Colonoscopy without Biopsy & Colon
Polypectomy
7
504 168 1.312
11 Colonoscopy with Biopsy & Colon
Polypectomy
4
510 170 1.330
12 Colonoscopy without Biopsy &
Hemorrhoid Ligation with Scope
1
290 145 920
13 Bronchoscopy without Biopsy &
Gastroscopy with Biopsy
1
561 187 1.403
V Combination 3 Procedures
1 Gastroscopy with BiopsyC & olonoscopy
without Biopsy & Colon Polypectomy
2
645 215 1.805
Grand Total 873 7.093 2.992 21.409
Endoscopy Proce dures
Number
of Fre-
que ncy
Time Es timation per
Procedures (Minutes)
Person-
ne l
Person-
nel
Room
Equip-
ment
I
Gastroscopy
1 Gastroscopy without Biopsy 3.870 2.580 15.480
2 Gastroscopy with Biopsy 46.593 31.062 188.376
3 Ligation of Esophageal Varices 2.310 1.540 9.680
4 Gastric Polypectomy 900 300 2.280
II Kolonoskopi
-
1 Colonoscopy without Biopsy 7.470 4.980 32.640
2 Colonoscopy with Biopsy 11.730 7.820 51.520
3 Colon Polypectomy 2.310 770 5.950
4 Rectosigmoidoscopy without Biopsy 98 65 400
5 Rectosigmoidoscopy with Biopsy 1.106 737 4.576
III Bronkoskopi
-
1 Bronchoscopy without Biopsy 8.580 2.860 22.660
2 Bronchoscopy with Biopsy 7.980 2.660 21.280
IV Combination 2 Procedures
-
1 Gastroscopy without Biopsy & Gastric
Polypectomy
405 135 1.015
2 Gastroscopy without Biopsy &
Ligation of Esophageal Varices
1.680 840 5.360
3 Gastroscopy with Biopsy & Ligation of
Esophageal Varices
214 107 686
4 Gastroscopy without Biopsy &
Colonoscopy without Biopsy
552 276 1.924
5 Gastroscopy with Biopsy &
Colonoscopy with Biopsy
7.952 3.976 27.944
6 Gastroscopy with Biopsy &
Colonoscopy without Biopsy
9.240 4.620 32.340
7 Gastroscopy without Biopsy &
Rectosigmoidoscopy with Biopsy
244 122 818
8 Gastroscopy with Biopsy &
Rectosigmoidoscopy with Biopsy
248 124 836
9 Gastroscopy with Biopsy &
Rectosigmoidoscopy without Biopsy
488 244 1.636
10 Colonoscopy without Biopsy & Colon
Polypectomy
3.528 1.176 9.184
11 Colonoscopy with Biopsy & Colon
Polypectomy
2.040 680 5.320
12 Colonoscopy without Biopsy &
Hemorrhoid Ligation with Scope
290 145 920
13 Bronchoscopy without Biopsy &
Gastroscopy with Biopsy
561 187 1.403
V Combination 3 Procedures
-
1 Gastroscopy with BiopsyC &
olonoscopy without Biopsy & Colon
Polypectomy
1.290 430 3.610
Grand Total 121.678 68.436 447.838
Endoscopy Procedures
Total Time Usage (Minutes)
ICIB 2019 - The 2nd International Conference on Inclusive Business in the Changing World
384
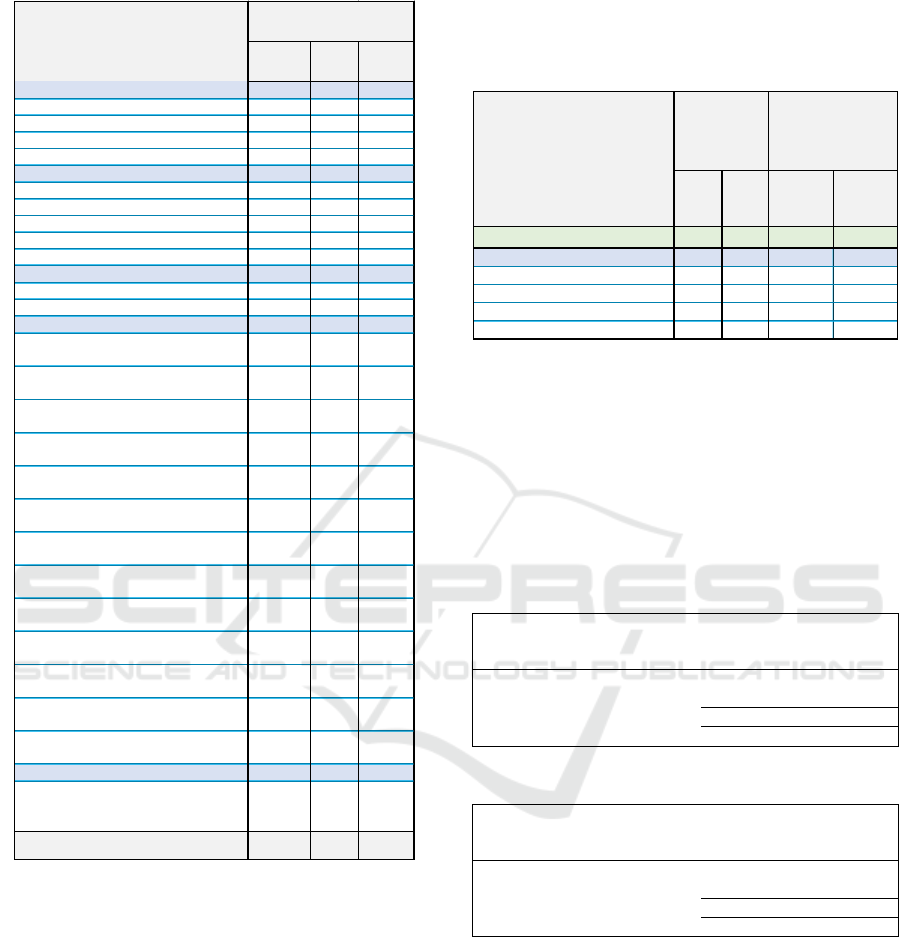
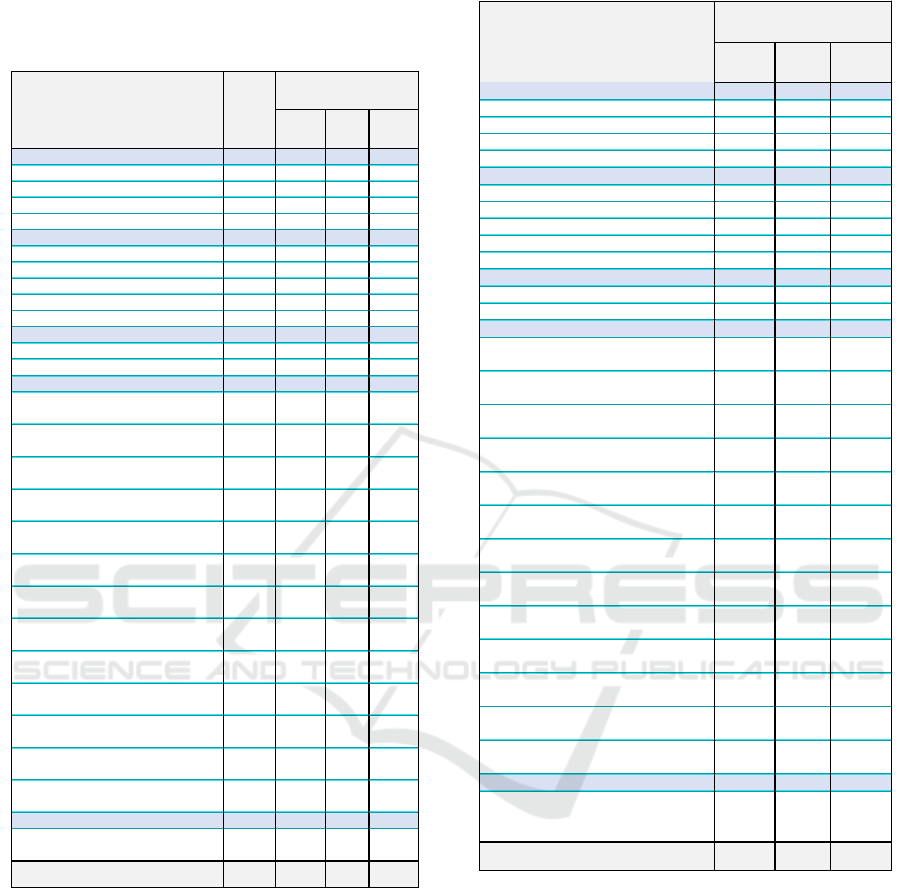
Table 9: Cost of Resource Groups (Million Rp).
The actual cost of the use of a resource group
(personnel, room dan equipment) for all procedures
in 2017 is shown in Table 9. In total, the cost of
personnel usage is Rp.150,73, - million, room usage
is Rp.30,34, - million, and overall usage of medical
equipment is Rp.86,49, - million.
Table 10 shows the sample of calculating cost of
each type of equipment for each procedure
(gastroscopy).
3.1.8 Unused Capacity Costs and Capacity-
based Income
One of the main advantages of the TDABC method is
that TDABC is able to describe the idle capacity or
unused capacity of available resources for each
service product/cost object. (Kaplan & Anderson,
2007).
Table 10: Cost of Each Type of Equipment.
As in table 11, the value of unused capacity of
personnel is 56%, there are 154.742 minutes a year or
2.95 hours per day per person. The cost of unused
personnel capacity is Rp. 191,68 million.
While the value of unused capacity for room is
63%. In table 12, with the capacity of 2 beds, there
are 115,854 minutes per year or 3,3 hours per day that
the beds are not used. The amount of unused capacity
is Rp.51,35,- million.
Table 11: Unused Capacity of Personnel.
Resource Group
Personnel
Resource Rate
per Minute
(million Rp)
Capacity
Usage
(Minutes)
Cost
(million Rp)
Used Capacity 1.239 121.678 150,73
Unused Capacity 154.742 191,68
Total 276.420 342,41
56% 56%
Table 12: Unused Capacity of Room.
Resource Group
Room
Resource Rate
per Minute
(million Rp)
Capacity
Usage
(Minutes)
Cost
(million Rp)
Used Capacity 443 68.436 30,34
Unused Capacity 115.844 51,35
Total 184.280 81,69
63% 63%
The unused capacity of medical equipment shows
varying values according to their utility. As in table
13 and table 14, Unused capacity of medical
equipment reaches Rp. 549,49 million, - with an
average of 79% of unused capacity. This high unused
capacity is also affected because there are medical
devices that are only used for a certain procedure,
such as Gastrosvideoscope for Gastroscopy,
Colonosvidescope for Colonoscopy, Electronic
Surgical Units for Polypectomy, Bronchovidescope
and Anesthetic for Bronchoscopy.
Person-
nel
Room
Equip-
ment
I
Gastroscopy
1 Gastroscopy without Biopsy 4,79 1,14 2,79
2 Gastroscopy with Biopsy 57,72 13,77 34,06
3 Ligation of Esophageal Varices 2,86 0,68 1,76
4 Gastric Polypectomy 1,11 0,13 0,72
II Kolonoskopi
1 Colonoscopy without Biopsy 9,25 2,21 5,75
2 Colonoscopy with Biopsy 14,53 3,47 9,08
3 Colon Polypectomy 2,86 0,34 1,85
4 Rectosigmoidoscopy without Biopsy 0,12 0,03 0,07
5 Rectosigmoidoscopy with Biopsy 1,37 0,33 0,80
III Bronkoskopi
1 Bronchoscopy without Biopsy 10,63 1,27 3,80
2 Bronchoscopy with Biopsy 9,89 1,18 3,58
IV Combination 2 Procedures
1 Gastroscopy without Biopsy & Gastric
Polypectomy
0,50 0,06 0,32
2 Gastroscopy without Biopsy &
Ligation of Esophageal Varices
2,08 0,37 0,98
3 Gastroscopy with Biopsy & Ligation of
Esophageal Varices
0,27 0,05 0,13
4 Gastroscopy without Biopsy &
Colonoscopy without Biopsy
0,68 0,12 0,43
5 Gastroscopy with Biopsy &
Colonoscopy with Biopsy
9,85 1,76 6,26
6 Gastroscopy with Biopsy &
Colonoscopy without Biopsy
11,45 2,05 7,24
7 Gastroscopy without Biopsy &
Rectosigmoidoscopy with Biopsy
0,30 0,05 0,18
8 Gastroscopy with Biopsy &
Rectosigmoidoscopy with Biopsy
0,31 0,05 0,19
9 Gastroscopy with Biopsy &
Rectosigmoidoscopy without Biopsy
0,60 0,11 0,36
10 Colonoscopy without Biopsy & Colon
Polypectomy
4,37 0,52 2,85
11 Colonoscopy with Biopsy & Colon
Polypectomy
2,53 0,30 1,65
12 Colonoscopy without Biopsy &
Hemorrhoid Ligation with Scope
0,36 0,06 0,16
13 Bronchoscopy without Biopsy &
Gastroscopy with Biopsy
0,69 0,08 0,23
V Combination 3 Procedures
1 Gastroscopy with BiopsyC &
olonoscopy without Biopsy & Colon
Polypectomy
1,60 0,19 1,23
Grand Total 150,73 30,34 86,49
Endoscopy Procedures
Total Cost of Resource
Usage (million Rp)
Patient
Bed
Gastro
video-
scope
Patient Bed Gastro
video-
scope
Equipment Cost Rate / Minute 0,000029 0,000657
I
Gastroscopy
1 Gastroscopy without Biopsy 60 40 0,001756 0,026298
2 Gastroscopy with Biopsy 62 42 0,001814 0,027613
3 Ligation of Esophageal Varices 70 50 0,002048 0,032873
4 Gastric Polypectomy 100 80 0,002926 0,052596
Equipment
Usage per
Procedure
(Minutes)
Equipment Usage per
Proc edure (millio n Rp)
Endoscopy Procedures
Time-Driven Activity based Costing Method for Calculating Unused Capacity of Endoscopy Services: A Case Study of Xyz Hospital
385
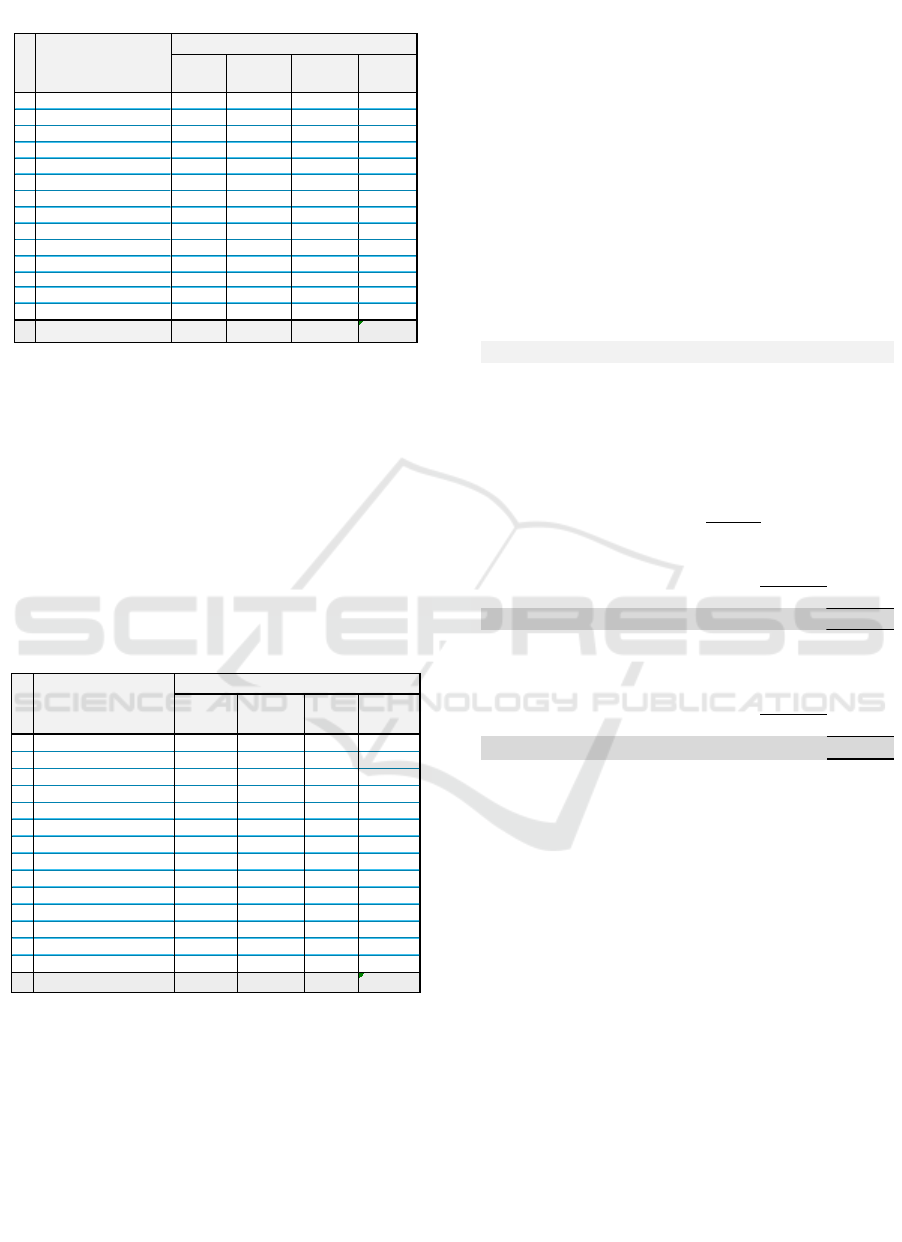
Table 13: Unused Capacity of Equipment (Minutes).
Also, there is a medical device
(Gastrovideoscope) that requires backup with
consideration of the high volume of use of the tool
and the length of time needed to repair the device if
damage occurs. A backup tool is provided to reduce
the risk of service that is hampered due to damaged
medical devices. The more medical devices that are
owned means the higher the cost of available capacity
(capacity cost supplied) so that at the same utilization
level will increase the unused capacity cost of the
tool.
Table 14: Unused Capacity of Equipment (million Rp).
Endoscopic procedures consist of pre, intra and
post stages. The post stage takes quite a long time
because it is necessary to observe the patient's
condition by the nurse to ensure the patient has fully
recovered when exit the Endoscopy room. At that
stage, even though the procedure process (use of
medical devices) is complete, the room facilities are
still used until the patient recovers.
The capacity-based income statement shows in
figure 3 that the operating income is Rp.1.464,88, -
million or 40% of total income. However, the idle
capacity reaches an amount of Rp.792,53, - million
(22% of total revenue). If the idle capacity is
calculated, then the net income becomes Rp. 672,35
million, or 18.4% of total revenue. Unused capacity
takes a portion of 26.5% of the total cost (Rp.2.990,12
million, -) which consists of direct costs, indirect cost
(used capacity), not allocated cost and idle capacity
cost.
By creating a capacity-based income statement,
the target improvement plan can be clearer and more
measurable. This idle capacity information can be
used as a performance indicator for management to
improve performance.
Figure 3: Capacity Based Income Statement.
4 CONCLUSIONS
By using TDABC, the cost of endoscopic procedures
can be calculated in more detail per type of
procedures. It also enables the calculation of various
services. Calculation of costs can be done for the total
cost, per group of resources (personnel, facilities and
room, medical equipment) and per type of
procedures.
TDABC allocates indirect costs to each resource
group in accordance with the actual usage of
resources, so that unused capacity (idle capacity) can
be presented separately. Information on the amount
of unused capacity in the form of time (minutes) and
costs (rupiahs) then can be used as a clearer and more
measurable management indicator in order to
improve performance through efficiency measures.
1 Patient Bed 68.436 115.844 184.280 63%
2 Patient Monitor 49.126 135.154 184.280 73%
3 Patient Troley 49.126 135.154 184.280 73%
4 SterilizationTroley 49.126 135.154 184.280 73%
5 Video scope Set 49.126 135.154 184.280 73%
6 Medical Image Station 49.126 135.154 184.280 73%
7 Suction Pump 49.126 43.014 92.140 47%
8 Gastrovideoscope 31.906 152.374 184.280 83%
9 Colonvideoscope 19.605 164.675 184.280 89%
10 Bronchovideoscope 4.637 87.503 92.140 95%
11 Electromic Surgical Unit 2.841 89.299 92.140 97%
12
Duodenovideoscope -
92.140 92.140 100%
13 Anesthesia Machine 4.637 87.503 92.140 95%
14 Cleaning Equipment 21.020 71.120 92.140 77%
Total 447.838 1.579.242 2.027.080 79%
Re s ource Group
Equipment
Equipment (Minute s)
Used
Capacity
Unus e d
Capacity
Total Idle
Capacity
1 Bed Pasien 2,00 3,39 5,39 63%
2 Patient Monitor 3,43 9,43 12,85 73%
3 Patient Troley 1,57 4,31 5,88 73%
4 Troley Bahan Steril 0,88 2,42 3,30 73%
5 Set Video scope 30,87 84,93 115,80 73%
6 Medical Image Station 2,45 6,74 9,19 73%
7 Suction Pump 1,78 1,56 3,35 47%
8 Gastrovideoscope 20,98 100,18 121,16 83%
9 Colonvideoscope 11,60 97,45 109,05 89%
10 Bronchovideoscope 1,15 21,76 22,91 95%
11 Electromic Surgical Unit 4,10 128,73 132,82 97%
12 Duodenovideoscope - 38,72 38,72 100%
13 Mesin Anastesi 1,98 37,34 39,32 95%
14 Pembersih alat 3,71 12,54 16,25 77%
Total 86,49 549,49 635,99 79%
Total Unus e d
Capacity
Resource Group
Equipme nt
Equipme nt (million Rp.)
Use d
Capacity
Unuse d
Capacity
Revenue 3.662,47
Less : Expenses
Direct Cost 1.759,29
Indirect Cost (Used Capacity)
Personnel 150,73
Room 30,34
Equipment 86,49
267,56
Not Allocated Cost
Office Departement & Other Supplies 170,74
2.197,59
Operating Income
1.464,88
Less :
Idle Capacity Cost
Personnel 191,68
Room 51,35
Equipment 549,49
792,53
Net Income
672,35
C
A
PACITYBASEDINCOMESTATEMENT
Total Cost
ICIB 2019 - The 2nd International Conference on Inclusive Business in the Changing World
386

REFERENCES
Britton, K., Koseki, S., & Dutta, A. (2018). Expanding
Markets while Improving Health in Indonesia: Private
Health Sector Market in the JKN Era. Washington, DC:
Palladium; Health Policy Plus; Jakarta, Indonesia:
TNP2K.
Campanale, C., Cinquini, L., & Tenucci, A. (2014). Time-
driven activity-based costing to improve transparency
and decision making in healthcare. Qualitative
Research in Accounting & Management, 11(2), 165–
186. https://doi.org/10.1108/QRAM-04-2014-0036
Clark, J., & Sopariwala, P. R. (2017). Applying Time-
Driven Activity-Based Costing to Metro Health’s
Outpatient Clinic. Cost Management, 31(2), 16–29.
Retrieved from https://search.proquest.com/docview/
1901188028?accountid=39260
Kaplan, R. S., & Anderson, S. R. (2007). Time-driven
activity-based costing: a simpler and more powerful
path to higher profits. Harvard Business School Press
Books, 82, 266. https://doi.org/10.1080/
09638180701814171
Keel, G., Savage, C., Rafiq, M., & Mazzocato, P. (2017).
Time-driven activity-based costing in health care: A
systematic review of the literature. Health Policy,
121(7), 755–763. https://doi.org/10.1016/j.healthpol.
2017.04.013
Porter, Michael E.; Lee, T. L. (2013). The Strategy That
Will Fix Health Care. Harvard Business Review,
(October), 1–39. Retrieved from http://hbr.org/2013/
10/the-strategy-that-will-fix-health-care/ar/1
Sopariwala, P. R. (2017). FACILITY-LEVEL ACTIVITY
COSTS. Cost Management, (july/August), 41–48.
Retrieved from remote-lib.ui.ac.id:6066/docview/
1929405512/578C46F04E324CC2PQ/1?accountid=17
242
Thabrany, H. (2017). JKN Mematikan Swasta. Retrieved
from https://kompasi.id/baca/opini/2017/04/08/jkn-
mematikan-swasta/
Yin, R. K. (2013). Validity and generalization in future case
study evaluations. Evaluation, 19(3), 321–332.
https://doi.org/10.1177/1356389013497081.
Time-Driven Activity based Costing Method for Calculating Unused Capacity of Endoscopy Services: A Case Study of Xyz Hospital
387
