Should Telkom Do IPO for Telkomsel?
Eggi Ahmad Hidayat and Riko Hendrawan
Telkom University, Jalan Gegerkalong Hilir No.47, Bandung, Indonesia
Keywords: DDM, FCFF, IPO, Relative Valuation.
Abstract: The objective of this research is to estimate the fair value of Telkomsel share price in the initial public offering
plan using FCFF and DDM approach with the verification of the result by using Relative Valuation method
with the PBV approach and Price to Earnings Ratio. This research used three scenarios, namely the
pessimistic, the moderate, and the optimistic, with historical financial data from 2012-2017 used as the
baseline for projections for 2018 – 2022 conditions. Outcomes from this research show that by using the DCF-
FCFF method in every one of the three scenarios, Telkomsel’s value is in the range of 80% to 93% of
Telkom’s (TLKM.ID) Market Price. Comparison with DDM valuation shows the FCFF valuation range
extend in an acceptable range - on the other side, relative valuation method used is the PER and PBV
approach, where the calculation for Telkomsel PBV is above Telco Industry market range and Telkomsel
PER value is still within market range.
1 INTRODUCTION
Liberalization of the Indonesian telecommunication’s
industry began in 2000, with the enactment of Law
No. 36 of 1999 concerning Telecommunications.
Since then the Indonesian telecommunications
industry has become open to the private sector and
foreigners. Telkomsel, which is a subsidiary of
Telkom, is a State-Owned Enterprise with an
ownership structure of 65%, at that time the only
provider of cellular telecommunications services
owned by the government, had to compete freely with
new cellular telecommunications operators entering
the Indonesian cellular telecommunications industry,
and must continue to innovate and improve efficiency
so that they can compete with other operators or
providers of cellular telecommunications services.
Previously the Indonesian cellular
telecommunications market was dominated by three
companies that had operating licenses from the
government, namely Telkomsel, Indosat, and XL.
However, now, the operator numbers have grown to
become five cellular operators and three Fix Wireless
Access (FWA) mobile operators, with the number of
mobile cellular subscribers in Indonesia being 439
million customers (GSMA Global Report 2018)
which currently exceeds the population of Indonesia.
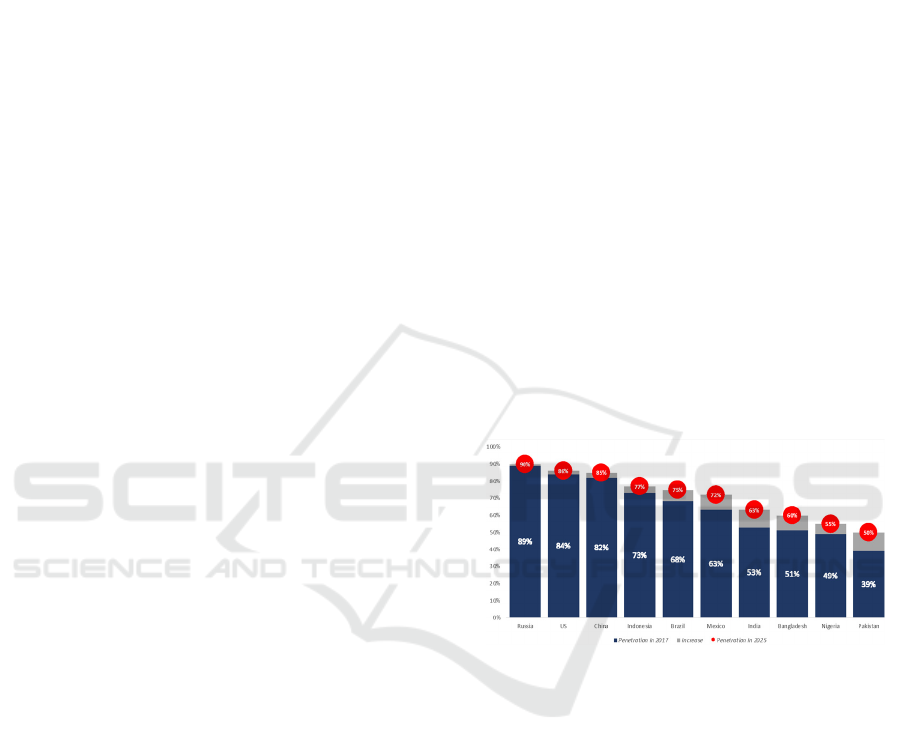
Figure 1: Countries with the unique penetration mobile subs
largest in the world.
Cellular phone customers in Indonesia have a
penetration rate above the population, GSMA in the
Global Report 2018 issue the results of the unique
calculation of subscribers in the country to be 73%.
The penetration of Indonesia's cellular customer has
the fourth position in the penetration of unique
cellular customers throughout the world, other
countries that have customer penetration above
Indonesia are Russia, the United States, and China.
Regarding unique customers growth, Indonesia still
has room to grow compared to the three countries,
where Indonesia still has 4% of space to grow while
Russia, the United States, and China only have 1%,
2%, and 3%. The numbers above can also be an
indicator that the telecommunications business still
has a strong foundation. Regarding customer
productivity, Indonesian cellular customers in the
Hidayat, E. and Hendrawan, R.
Should Telkom do IPO for Telkomsel ?.
DOI: 10.5220/0008431003370347
In Proceedings of the 2nd International Conference on Inclusive Business in the Changing World (ICIB 2019), pages 337-347
ISBN: 978-989-758-408-4
Copyright
c
2020 by SCITEPRESS – Science and Technology Publications, Lda. All rights reserved
337
past three years still have a reasonably positive
customer productivity level compared to the average
growth rate of customers worldwide. Which is
presented in Figure 2, where % ARPU mobile subs
growth from 2009 still experiencing negative growth,
although in the past three years it has been able to
withstand or slow down the rate of decline in its
ARPU growth. Despite ARPU in Indonesia has
declined, its growth rate remains above the growth
rates of other operators in the World.
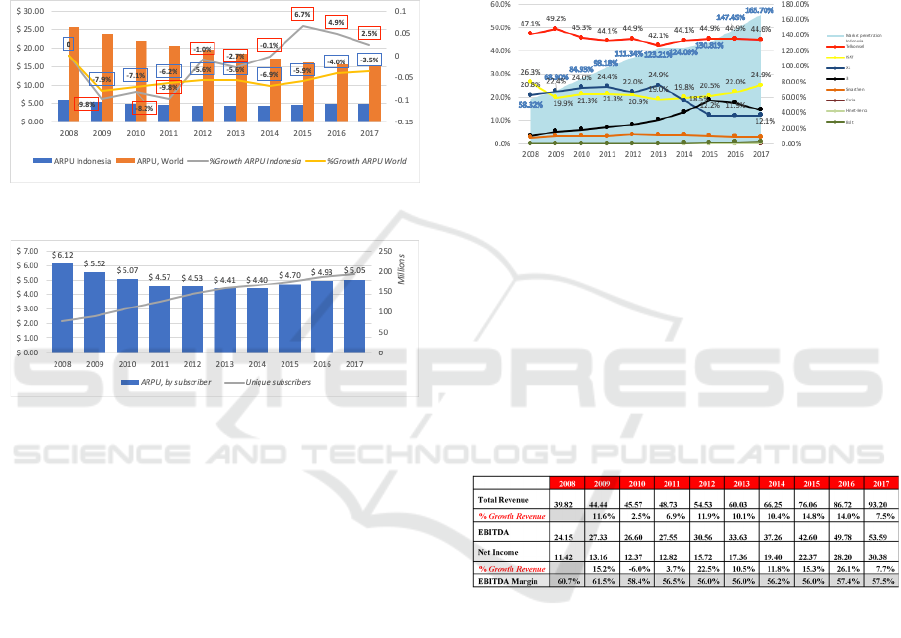
Figure 2: APRU Indonesia and World Growth 2008-2017.
Figure 3: Indonesia’s Cellular customers and APRU 2008-
2017.
Average Revenue Per User (ARPU) is an
expression of income produced by customers or
devices per unit of time in the telecommunications
network. Usually, telecommunications sector use
ARPU as a driver and to track the amount of revenue
generated per user and also to assist in estimating
future service revenues generated from the customer
base. The graphs of growth in customer numbers and
Indonesian ARPU directly show that there is still
potential for growth of cellular business in Indonesia.
This is evidently true if we go deeper into the
competitive conditions of the telecommunications
industry in Indonesia where the market penetration of
the cellular industry is growing from 58.3% from
2008 to 10 years later to 165.7%. Telkomsel had a
high level of superiority and was able to survive in
the competitive Indonesia's cellular market, owing
market share in the range of 42.1% to 49.2%, where
this is entirely different from other operators in the
competition, e.g., initially (2009) Indosat ranked
second only own 26.3% market share. The following
six years showed XL struggled hard to overtake
Indosat's position - XL, which previously in 2009 was
third (20.8%), continuously becoming the second
place in 2009-2013. The last three years (2015-2017)
the second position was returned to Indosat, and 3
(three) (Hutchinson) passed XL to be in third place.
Telkomsel's superiority with an average market share
gap of 20% above other cellular operators is quite an
exciting phenomenon to deepen, when the condition
of the mobile cellular industry in the world is not in a
very good growth condition, whereas Indonesia still
has momentum for stable growth.
Figure 4: Indonesia Cellular market penetration vs. operator
market share.
Looking at the condition of the comparison of the
growth of the world and domestic cellular industries
as described in the two figures above, if seen more
deeply in Figure 4, over time, Telkomsel has a
constant increase in the number of customers, and this
represents its superiority in Indonesia’s cellular
market share.
Table 1: Performance Revenue, Net Income Telkomsel and
EBITDA 2008-2017.
Based on the above conditions, which are shown
in Figure 1.5 and Table 1, the authors see it is possible
for Telkomsel to get higher enterprise value when
Telkomsel plan for an Initial Public Offering (IPO) in
the years to come, while also improving alternative
sources of funding and operational funding. The
initial price of Telkomsel's IPO shares will affect the
condition of secondary shares which will change
based on the law of supply and demand. So if
Telkomsel conducts an IPO, the condition of
Telkomsel as the market leader will have a significant
influence in gaining the trust of investors and
shareholders. Wahyudi & Surya (2013) asserted in
their 2012 research results that IPO benefits for
companies in the stock market with the aim of carved-
out, can significantly have higher incomes than the
industry average during the first three years after the
ICIB 2019 - The 2nd International Conference on Inclusive Business in the Changing World
338

IPO, and parent company also have a higher ROA in
the first year after releasing share ownership in their
subsidiary. With both the value of the shares of the
subsidiary and the parent company increasing, the
overall value of the company will rise, and
shareholder value will increase.
This Telkomsel valuation will produce intrinsic
value information which is then compared to the bid
price to determine the position of purchase or sale of
initial shares at the time of the IPO, one of which is
an investment guide, so investors need to carry out
fundamental analysis using financial data or valuing
intrinsic value of company shares.
2 LITERATURE REVIEW
2.1 Corporate Value Theory
Maximizing company value is one of the essential
things for the company, not only for the shareholders
but also for the other stakeholders. Company value
usually acts as an indicator of the performance of the
company in the long term, and it also can be
functioned as indicative measurement on company’s
health status, for example, companies that maximize
their value, will have more value in creating jobs,
treating their employees, and giving their customers
more satisfaction.
The value of a company that has gone public is
reflected in the market price of a company's stock,
while the selling price can measure the value of a
company that has not gone public if the company not
only reflects the value of the company's assets but
also covers the level of business risk, company
prospects, management, environment effort, and
other factors. With this condition, there are several
ways to determine the value of a company, because
the value of this company is one of the determining
factors for investors to invest their capital. It’s the
assessment can be categorized into 3 (three) methods,
namely:
1. The Economic Assessment Method.
The method comes from the idea that an asset can
be assessed from how the asset produces
economic value or benefits for the company in the
future, one approach that includes the Discounted
Cash Flow (DCF) and Economic Value Added
(EVA)
2. Relative or Market Assessment Method.
Which departs from the value of an asset depends
on the assessment of other components that make
up the asset, by comparing with similar assets or
similar transactions, for example, Price To Equity,
Price to Earning and EV / EBIT
3. Asset-based Method.
This method emphasizes the value of assets in
determining the fair value of a company,
particularly intangible assets, the commonly used
approach is the Liquidation Model.
2.2 Stock Valuation
Stock valuation is a process used to determine the fair
value of a stock. First, fundamental analysis is an
analysis that considers multiple good factors
concerning company performance, analysis of
business competition, industry analysis, and
economic analysis both macro and micro. The second
analysis is technical analysis. Which is a technique
that analyzes fluctuations in stock prices in a certain
period. The purpose of this analysis is to find out
whether a stock is in an overbought or oversold
condition.
Damodaran (2012) says that fundamental analysis
is appropriate for valuation of stock prices because
fundamental analysis relates indicators related to the
characteristics and financial condition of the
company, both from the condition cash flow, risk
profile and even growth potential, due to the varying
focus areas of investors, where there are more
investors looking at the quality of assets, the
composition of capital and equity and even the future
potential of the company. Some approaches from the
stock valuation method according to Damodaran
(2012), can be categorized as follows: "There are
three approaches to valuation. The first, discounted
cash flow valuation, relates the value of assets to the
present value of the expected future cash flows on that
asset. The second, relative valuation, estimates the
value of assets relative to a common variable like
earnings, cash flows, book value, or sales. The third,
contingent claim valuation, uses option pricing
models to measure the characteristics of these assets.”
The three approaches described as follows:
1. Discounted Cash Flow (DCF).
Discounted Cash Flow is a valuation method for
determining the present value of an asset by
discounting cash flow in the future, where assets
are discounted based on the level of risk
associated with cash flow, whereas the discounted
cash flow method is a stock valuation method
based on the concept of the time value of money.
The Discounted Cash Flow method has three
types of calculation approaches that can be used
according to individual needs, namely Dividend
Should Telkom do IPO for Telkomsel ?
339

Discount Models, Free Cash Flow to Firm and
Free Cash Flow to Equity stated in Neaxie &
Hendrawan (2017).
2. Relative Valuation.
Relative valuation is one of the most commonly
used asset valuation methods by comparing the
same company. According to Damodaran (2012),
relative valuation is a company assessment
carried out by looking at how the market price of
similar assets. Investors often decide whether a
stock is cheap or expensive by comparing prices
with similar stocks (usually within the peer
group).
3. Contingent Claim Valuation.
Contingent claim valuation is the method of
valuation of assets rated if it is in a certain
condition, that is if the value of the underlying
asset exceeds the predetermined value for the call
option or less than the predetermined value for the
put option. At present, there has been much
development of this model option, and the pricing
model option has been used to assess all assets
that have the features mentioned above.
2.2.1 Discounted Cash Flow
Discounted Cash Flow approach can be described as
follows:
a. Dividend Discount Models.
DDM is a calculation model with discount
dividends which is then used to calculate the
intrinsic value of shares by discounting future
dividend flows to their present value. It can be
said that the value of a company (its share price)
is the accumulation of all money distributed to
shareholders in the form of dividends as long as
the company stands. This is then discounted at a
certain discount rate.
b. Free Cash Flow to Firm.
Neaxie & Hendrawan (2017) argues that FCFF
calculates the value of companies without debt,
where operating costs have been excluded from
tax and discounted using capital costs (WACC).
FCFF can assess the amount of accounting cash
flow after the company conducts operations and
investment activities.
c. Free Cash Flow to Equity.
FCFE is a value calculation model based on the
remainder of the cash flow after payment of
interest and principal loans, used for capital
expenditure both for current operations and for
future growth. FCFE which will be calculated
must be a value of cash flow remaining after
calculating the value of reinvestment and
additional working capital needed by the
company to create future growth and repayment
of debt installments.
Summarized by Neaxie & Hendrawan (2017)
suggesting the proper use of FCFF and FCFE
approaches, as will be presented in Table 2 below:
Table 2: FCFF Differences with FCFE.
FCFF FCFE
1. FCFF used to calculate
companies that have
not to go public.
2. For companies listed
public, according to the
shareholder who is less
interested in a stable
dividend.
3. The valuation results
are intended for large
investors or
shareholders majority
as funders.
4. FCFF according to
count companies with
debt levels or high
capital expenditure, as
an example in
company’s high tech
and
telecommunications.
1. The FCFF approach
is not recommended
use for calculating
values in companies
high tech.
2. FCFE is right for
calculating the cash
flow for minority
shareholders, where
they focus on a stable
flow of dividends.
3. FCFE is used to
calculate the value of
a company with the
purpose of
acquisition (taken
over).
4. FCFE is suitable for
calculating the value
of a company with a
possible level of debt.
2.2.2 Free Cash Flow to Firm
FCFF is the amount of cash flow available to all
investors in a company, including common
stockholders, bondholders, or preferred-stockholders,
it also can be calculating company value without debt,
where operating costs incurred from taxes and
discounted using capital costs (WACC), calculated
using the formula:
FCFF = (EBIT x (1-Tax)
+ Depreciation
– Capex
–
N
WC
(1)
And then the value of the company can be calculated
by:
Valueo
f
Firm
(2)
Whereas if there is some expected rate of return, the
researcher uses FCFF Two-Stage Model:
ICIB 2019 - The 2nd International Conference on Inclusive Business in the Changing World
340

Valueo
f
thefirm
FCFF
1WACC
FCFF
/
WACC g
1WACC
(3)
2.2.3 Cost of Capital
The cost of capital is a cost that reflects all funding
sources used by the company, including from funding
sources that come from debt and equity, usually this
capital cost in general termed as weighted average
cost of capital (WACC), which can be defined as the
average cost after tax of each source of capital used
by companies to fund a project, where the weight of
each post reflects the proportion of the total funding
from each source. WACC is one of the main factors
in calculating DCF valuations, where there is a
change in the proportion of capital costs that can
significantly influence the measured value.
WACC can be calculated by the following
formula:
WACC
costo
f
equit
y
x
equit
y
debtequity
costo
f
debtx
debt
debt equit
y
x
1tax
(4)
2.2.4 Dividend Discount Model
DDM is the calculation model with discount
dividends which is then used to calculate the intrinsic
value of shares by discounting future dividend flows
to their present value. The Dividend Discount Model
can be formulated as follows:
ValuePerShareofStock
E
DPS
1k
(5)
The following formula use for the variable dividend
payout ratio, where the model is based on two stages
of growth.
P
∑
.
.
where
P
DPS
k
.
g
(6)
2.2.5 Relative Valuation
According to Damodaran (2012), relative valuation is
a company carried out by looking at how the market
price of similar assets. Investors often decide whether
a stock is cheap or expensive by comparing prices
with similar stocks (usually within the peer group).
a. The Price Earnings Ratio.
The estimating the intrinsic value of shares in
company analysis can be done by utilizing two
essential information components, namely
earnings per share and earnings multiplier. The
formula for determining the intrinsic value of
shares through the approach Price Earnings Ratio
(PER)is as follows:
PER
P
EP
S
(7)
If the intrinsic value of a stock has been estimated, the
next step is to compare the intrinsic value of the stock
with its market price.
b. Approach Price per Book Value (PBV).
The relationship between stock market prices and
book value per share can be used as an approach
to determine a share value. Theoretically, the
market value of stock must reflect the value of the
book. PBV can be calculated using the following
formula:
P/B
V
P
B
V
ROExPayoutratiox
1g
k
g
(8)
2.2.6 Previous Research
Based on previous research on related subjects and
methods, we can see some previous studies that deal
with the valuation of company values and valuation
of stock prices for companies engaged in or related to
telecommunication value chains. The similarities of
some previous studies with this research is to analyze
the intrinsic value of stock prices with fundamental
analysis with the Discounted Cash Flow approach,
while other methods used in previous studies include
Relative Valuation, EBITDA Multiple, and Residual
Income.
Zemba & Hendrawan (2018) states that on
company valuation can using two approaches, the
DCF method relies on the assumption that is built to
perform projection or estimate of the future. Just like
a forecast in common, the results can exceed or less
than actual, and Relative Valuation that has three
approaches of calculation, Price to Earnings Ratio,
Price to Book Value, and Enterprise Multiple. The
valuation will be compared in three comparison
scenarios, in order to have view if it is growing much
better than that it has been estimated or otherwise
even worse than that. The Scenario can be stated as
the optimistic scenario that obtained from the
predicted growth of the industry, plus the difference
between a history of the company's growth and
history of industrial growth, plus half of the
difference in the history of industrial growth and
predicted growth of the industry, taken in half
Should Telkom do IPO for Telkomsel ?
341

because it is considered the probability of growth of
the industry is not all affect the full at any one
company, but there contributed to the growth of other
companies in the same industry. Moderate scenario
obtained from industrial growth predictions, plus the
excess of the company's growth history and history of
industrial growth. Pessimistic scenario obtained only
from industrial growth projections, without
considering factors that historical growth of the
company which is usually always higher than the
industry growth.
Research conducted by Saplista & Iryna (2008),
has a foreign telecommunications companies as the
object of research, while other studies have domestic
companies as the object of research. There is a
research that discusses stock valuation which aims to
provide information about the intrinsic value of
shares which is then compared with market prices to
determine investment decisions. The research that
discusses the comparison between intrinsic value and
market value which then produces three stock
conditions, namely undervalued, overvalued and fair
valued conducted by Neaxie & Hendrawan (2017),
show that in previous years the valuation research of
Telecommunications sector companies was oriented
as a comparison of company performance and
company growth.
Valuation is crucial for investment decision
making process. Investors and analysts can use
different models and tools in order to determine stock
intrinsic value, the research find that stock values
calculated with DCF model are very close to average
market prices which suggest that market prices
oscillate near stock values, which follows to
conclusion that DCF models are reliable tools for
calculation of companies’ enterprise values on long
term. Analysis by using this model can get long-term
picture for real stock value as well as enterprise value,
which is solid base for investment decision-making.
Chirputkar, Kulkarni, Vadgama & Prabhu (2016)
state on their research that valuation on
telecommunication company can be using Market
Capitalization and Enterprise Value Method, where
the market capitalization method can be relevant to
most of the operators are not listed in open market,
meanwhile the enterprise valuation method is often
used for operator’s valuation due to debt component
and its capital structures. Using Discounted Cash
flow approach is most suitable to operators since it is
based on cash flows of the company. Here the value
of the firm is present value of cash flow during
explicit forecast period, however in a DCF method,
for discounting purpose, we need to calculate
discounting rate which is based upon weighted cost
of capital from all sources.
The research conducted by Glaum and Friedrich
(2006) stated that for telecommunications companies
that tend to be oriented to cash flow, one of them is
because telecommunications companies as service
companies but also have the nature as infrastructure
companies, so it is said that the most frequently used
company valuation methods are DCF, while Relative
Valuation is usually just a comparison. This is also
stated by Wahyudi and Surya (2013), where there is a
significant gap between DCF valuation and relative
valuation. Both of these studies are studies that aim to
assess the intrinsic value of shares with the same goal
as this research, namely to determine the condition of
the intrinsic value of shares or actual value through
assumptions based on company fundamentals and can
be considered suitable for use by telecommunications
companies. The researcher uses the DCF valuation
method, which uses Free Cash Flow to Firm and
Dividend Discount Model and Relative Valuation.
Based on the information and research, the
valuation will produce intrinsic value information
which is then compared to the share price to
determine the position of purchase or sale of initial
shares at the time of the IPO, one of which is an
investment guide, so investors need to carry out
fundamental analysis using financial data or valuing
intrinsic value of shares company. The purpose of this
research is to estimate the fair value of Telkomsel
share price in the initial public offering plan.
2.3 Thinking Framework
Fundamental Valuation of company value is based on
assumptions and projections of the condition of the
company, where in this study the historical data used
is historical data from 2012 - 2017 as the basis for
calculation, and then projections are made to
determine future cash flow and its present value.
Determination of future cash flow from this
projection is carried out based on a choice of certain
assumptions and scenarios, with underlying
assumptions made that have different conditions
where later alternative decisions and projections will
be obtained stated by Ivanoska, Ivanovski, &
Narasanov (2014).
These underlying assumptions use three scenarios
of conditions, namely pessimistic conditions (below
the industry growth rate), optimistic conditions
(above industry growth rates) and moderate
conditions. These conditions calculated after looking
at data and information from situational and
environmental data from the telecommunications
ICIB 2019 - The 2nd International Conference on Inclusive Business in the Changing World
342
industry and business and moderate conditions are
possible conditions to occur from the principal
figures of the company. Pessimistic conditions are a
condition in which the company is assumed to grow
below the industry figure, which means it is a
condition that is considered as the worst condition
reference, while optimistic conditions are conditions
in which the company's growth is above the industry
figure.
The next process is the determination of valuation
based on the Discounted Cash Flow method with the
Free Cash Flow to Firm approach where previously
the value will be searched for from Cost of Capital
(WACC) of each condition, which is then calculated
to obtain the equity value or called the intrinsic value
of the company. Finally, a fair price per share for each
of these conditions can be obtained. Another process
in valuing this company is to perform the calculation
of Discount Model Dividend as the second reference
of the company's intrinsic value, which determines
the level of dividend growth in each scenario with the
same data used by FCFF and determines the expected
dividend rate in the future.
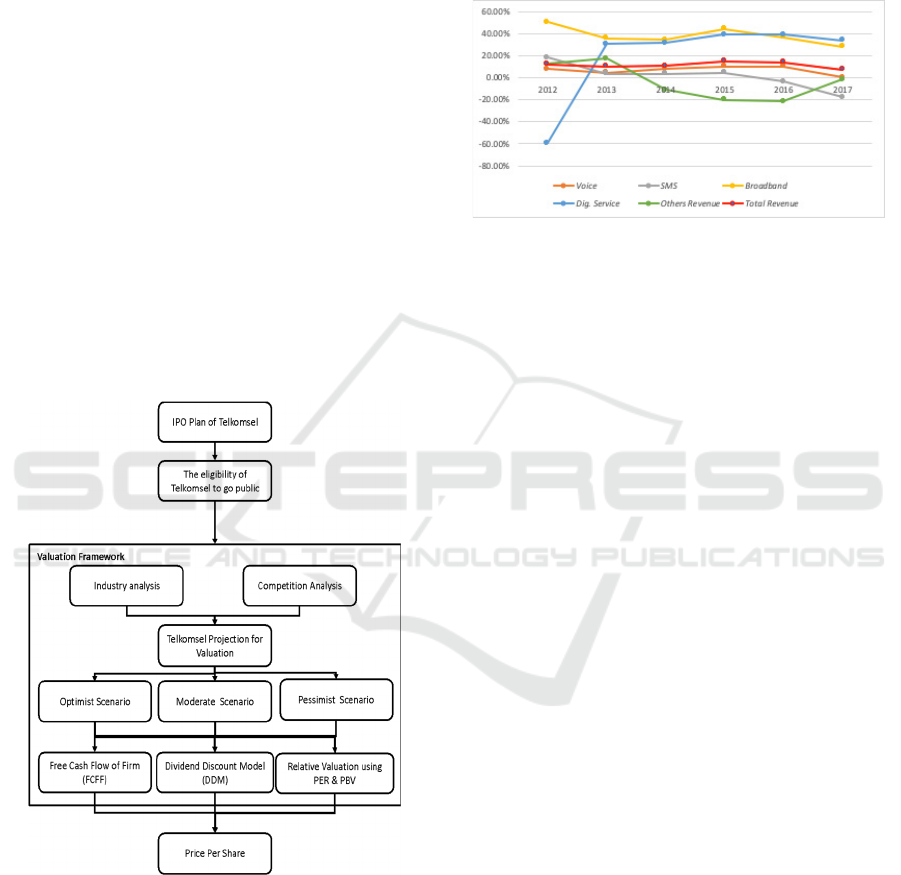
Figure 5: Thinking Framework.
As described earlier, the research framework can
be presented as shown in Figure 5.
3 RESULTS AND DISCUSSION
3.1 Historical Performance Analysis
3.1.1 Growth Revenue per Service
Figure 6: Growth Revenue per Service 2012-2017.
Figure 6 shows that the total revenue growth of
Telkomsel has increased by trend successively each
year enabling Telkomsel to experience significant
growth amounting to 11.90% in 2012, 10.09% in
2013, and 10.36% in 2014, 14.80% in 2015, and
14.03% in 2016. However, later in 2017 Telkomsel
experienced decreased growth in total revenue to
7.49%. Based on service to revenue contribution, the
increase in Telkomsel's revenue growth essentially
still supported by Voice service revenue, as
evidenced in the year of 2012 when Telkomsel Voice
service posted a revenue of 53.7% from total revenue
and up until the year of 2017, the service still
increasing plainly.
The most influential service in the changing of
revenue growth in Figure 6 above is shown by the
growth of Voice service in 2012 when the service had
a growth rate of 7.86%, which then declined in 2013
to 4.51%. After that Voice service revenue increased
again to 7.83% in 2014, 10.09% in 2015 and 10.06%
in the following year, but in 2017, even though it still
had positive growth it experienced a significant
decline in growth at a rate of 0.21%, whereas in other
services such as SMS, despite the steady growth rate
in the period from 2013 to 2015, it experienced
negative growth in 2016 amounted to -3.38% which
was then in 2017 decreased by -17.82%. Other
services which have a relatively high average growth
in the period 2013 to 2017 are broadband services (at
a growth rate of 35.7%) and digital services (at a
growth rate of 34.7%).
3.1.2 Capital Expenses per Revenue
Based on Figure 7, there is a downward trend for
CAPEX per revenue for the last three years. Where in
Should Telkom do IPO for Telkomsel ?
343
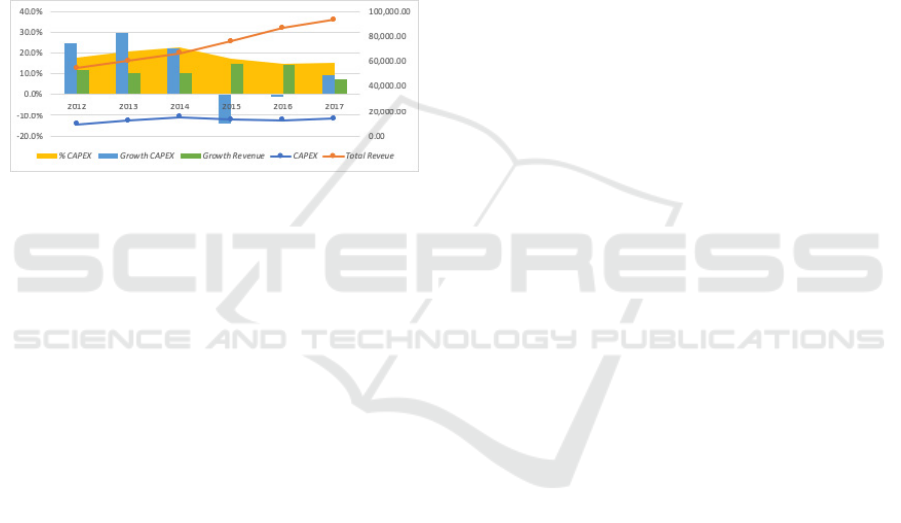
the year 2012, CAPEX per revenue was at 17.6%,
growing at 24.7% from the previous year compared
to revenue growth of 11.9%, in 2013 CAPEX per
revenue grew to 20.7% where in that year the number
of CAPEX issued by Telkomsel grew by 29.4%
compared to revenue growth of 10.1%. In 2014
CAPEX per revenue experienced a re-growth to
22.9% with CAPEX growth of 22.3% from the
previous year (the figure dropped by 7.1%),
compared to revenue growth of 10.4%. Then in 2015,
there was a decrease in Telkomsel CAPEX per
revenue to 17.2%, this was due to the negative growth
of CAPEX issued from the previous year by -13.9%
even though the growth of revenue have increased to
14.8%.
Figure 7: CAPEX per Revenue.
In 2016, CAPEX per revenue began to decline,
where in that year, Telkomsel recorded CAPEX per
revenue of 14.9% accompanied by a decrease in the
number of CAPEX issued by -1.2% from the previous
year, compared to Telkomsel revenue growth at 14%.
And then the following year CAPEX per revenue was
15.1% with a CAPEX growth percentage of 9.5%
compared to revenue growth of 7.5%.
Telkomsel CAPEX per revenue in 2012 to 2017
has an average of 18% with the most substantial value
in 2015 of IDR 15.16 trillion (proportion of 22.9%)
and second in 2017 with a nominal IDR 14.12 trillion
(proportion of 15.1%). The average annual CAPEX
growth in the 2012-2017 period is in the range of
11.8% with the condition of achieving revenue
growth averaging 11.4%.
3.2 Revenue Projection
The projection scenario used for Telkomsel growth
scenario for the next 5 years starting from 2018 to
2012, where in the preparation of the projection,
growth assumptions are made using the necessary
conditions in historical growth in each service along
with its projection and then reduced or added by the
average growth of service related in the
telecommunications industry.
3.2.1 Pessimistic Scenario Projection
The revenue growth projection in the pessimistic
scenario is obtained, for Voice service with a decrease
in 2018 of -7.22% with nominal revenue of IDR 37.2
trillion, then the consecutive decrease in service to
IDR 36.12 trillion in 2019, IDR 34.97 trillion in 2020,
IDR 33.43 trillion in 2021 and IDR 31.85 trillion in
2022, which means a negative growth of -4.71% from
the previous year. As for SMS service, the condition
of decline in 2018 was -8.01% with nominal revenue
service of IDR 9.97 trillion, then the progressive
decrease in the service to IDR 8.19 trillion in 2019,
IDR 6.4 trillion in 2020, IDR 4.55 trillion in 2021 and
IDR 2.7 trillion in 2022, which means a negative
growth of -40.63% from the previous year.
For Broadband services with revenue growth
which increased in 2018 by 0.23% with nominal
revenue of IDR 35.6 trillion, will provide additional
revenue growth to IDR 39.66 trillion in 2019, IDR
43.80 trillion in 2020, IDR 47.57 trillion in 2021 and
IDR 51.37 trillion in 2022, which means there is a
growth of 7.98% from the previous year. In the
Digital services, Telkomsel is projected to have
service revenue growth in 2018 amounted to 2.27%
with a nominal value of IDR 4.03 trillion, which in
the following year added additional service revenue
growth to IDR 4.57 trillion in 2019, IDR 5.14 trillion
in 2020, IDR 5.67 trillion in 2021 and IDR 6.21
trillion in 2022, which means there is a growth of
9.54% from the previous year. The average EBIT
from Telkomsel if calculated by this method will be
IDR 38.44 trillion in 2018, IDR 39.21 trillion in 2019,
IDR 39.99 trillion in 2020, IDR 40.39 trillion in 2021,
and IDR 40.8 trillion in 2022.
3.2.2 Moderate Scenario Projection
The growth projection is obtained with the projection
scenario used for the next five years starting from
2018 until 2022, where in the preparation of these
projections, growth assumptions for Telkomsel are
made using the necessary conditions in historical
growth in each service. Voice service with a decrease
in 2018 of -7.22% with nominal revenue of IDR 37.2
trillion, then the sequential decrease in service to IDR
36.48 trillion in 2019, IDR 35.66 trillion in 2020, IDR
34.43 trillion in 2021 and IDR 33.13 trillion in 2022,
which means a negative growth of -3.77% from the
previous year. As for SMS service, the condition of
decline in 2018 was -8.01% with a nominal service of
IDR 9.97 trillion, then the progressive decrease in the
service to IDR 8.27 trillion in 2019, to IDR 6.53
trillion in 2020, IDR 4.68 trillion in 2021 and IDR
ICIB 2019 - The 2nd International Conference on Inclusive Business in the Changing World
344
2.81 trillion in 2022, which means a negative growth
of -40.04% from the previous year.
For Broadband service with growth in service
revenue which increased in 2018 by 0.23% with
nominal revenue of IDR 35.6 trillion, in the following
year will provide additional service revenue growth
to IDR 40.05 trillion in 2019, IDR 44.67 trillion in
2020, IDR 48.99 trillion in 2021 and IDR 53.42
trillion in 2022, which means there is a growth of
9.05% from the previous year. Telkomsel’s digital
service revenue is projected to have growth in 2018
service revenue amounted to 2.27% with a nominal
value of IDR 4.03 trillion, which in the following year
provided additional service revenue growth of IDR
4.62 trillion in 2019, IDR 5.24 trillion in 2020, IDR
5.84 trillion in 2021 and IDR 6.46 trillion in 2022,
which means there is a growth of 10.63% from the
previous year. The average EBIT from Telkomsel if
calculated by this method will be IDR 38.44 trillion
in 2018, IDR 39.59 trillion in 2019, IDR 40.78 trillion
in 2020, IDR 41.6 trillion in 2021, and IDR 42.43
trillion in 2022.
3.2.3 Optimistic Scenario Projection
The growth projection is obtained by revenue
projections in an optimistic scenario used for the next
5 years starting from 2018 to 2012, where the growth
assumptions are made using the necessary conditions
of historical growth in each service was then added to
the average growth of service in the
telecommunications industry. Voice service with a
decrease in 2018 of -7.22% with nominal revenue of
IDR 37.2 trillion, then the consecutive decrease in
service to IDR 36.83 trillion in 2019, IDR 36.36
trillion in 2020, IDR 35.27 trillion in 2021 and IDR
34.11 trillion in 2022, which means a negative growth
of -3.3% from the previous year. As for SMS service,
the condition of decline in 2018 was -8.01% with a
nominal service of IDR 9.97 trillion, then the
progressive decrease in the service to IDR 8.35
trillion in 2019, becoming IDR 6.66 trillion in 2020,
IDR 4.8 trillion in 2021 and IDR 2.89 trillion in 2022,
which means a negative growth of -39.75% from the
previous year.
Broadband service with growth in service revenue
which increased in 2018 by 0.23% with nominal
revenue of IDR 35.6 trillion will provide additional
service revenue growth of IDR 40.44 trillion in 2019,
IDR 45.54 trillion in 2020, IDR 50.19 trillion in 2021
and IDR 55 trillion in 2022, which means there is a
growth of 10.21% from the previous year. The Digital
service is projected to have growth in 2018 service
revenue amounted to 2.27% with a nominal value of
IDR 4.03 trillion, which in the following year
provided additional service revenue growth to IDR
4.66 trillion in 2019, IDR 5.34 trillion in 2020, IDR
5.98 trillion in 2021 and IDR 6.58 trillion in 2022,
which means there is a growth of 10.97% from the
previous year. The average EBIT from Telkomsel if
calculated by this method will be IDR 38.44 trillion
in 2018, IDR 39.81 trillion in 2019, IDR 41.58 trillion
in 2020, IDR 42.62 trillion in 2021, and IDR 43.68
trillion in 2022.
3.3 Relative Valuation
Table 3: Relative Valuation.
Projections PBV PER
Pessimist 5.09 9.56
Moderate 5.53 10.38
Optimist 5.83 10.94
Based on Table 3 it can be seen Relative Valuation
with the approach of PER and PBV values in the
Pessimistic, Moderate and Optimistic Scenario. With
the pessimistic scenario, Telkomsel has a PBV value
of 5.09 times and a PER of 9.56 times, while the
moderate scenario of Telkomsel has a PBV value of
5.53 times and PER of 10.38 times. Then in the
optimistic scenario, Telkomsel has PBV value of 5.83
times and PER of 10.94 times.
3.4 Discussion
3.4.1 Free Cash Flow to Firm
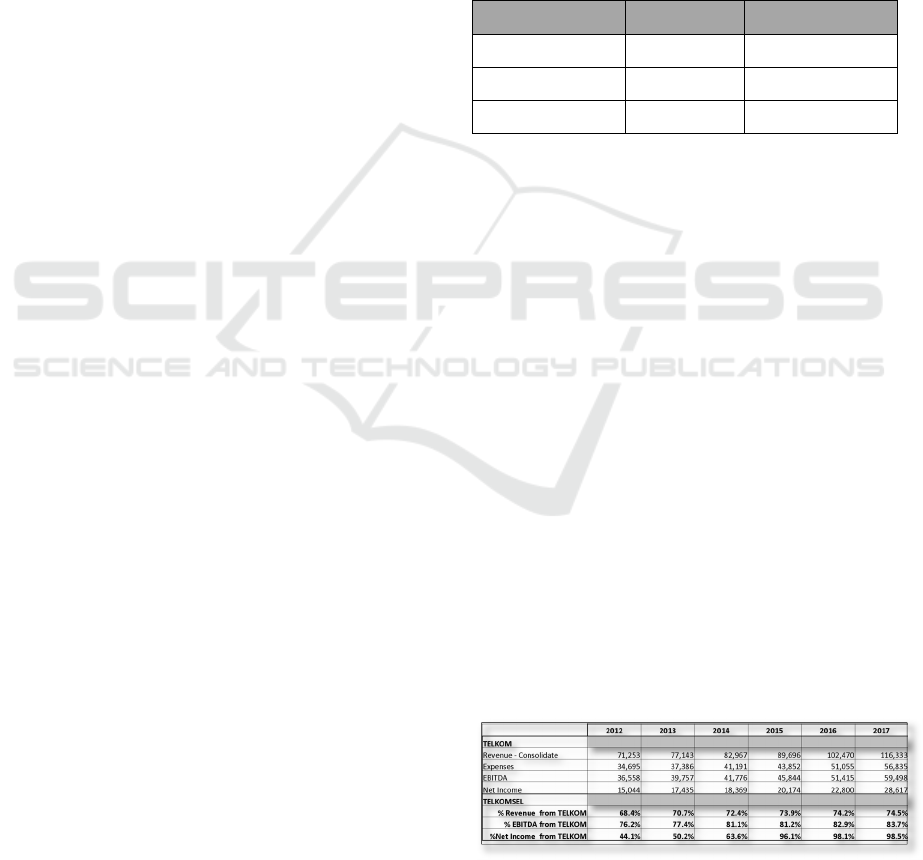
Based on Table 4, it is explained that Telkom’s
Consolidate Revenue, compared to Telkomsel
revenue is in range of 68.4% to 74.5% from year 2012
to 2017, where if we go to Net Income comparison,
we will see that the Telkom’s Net Income is more
dependent to Telkomsel's performance where is
recorded from 44.1% going exponentially increasing
to 98.5% in the year 2017.
Table 4: Telkom and Telkomsel Comparison.
Should Telkom do IPO for Telkomsel ?
345
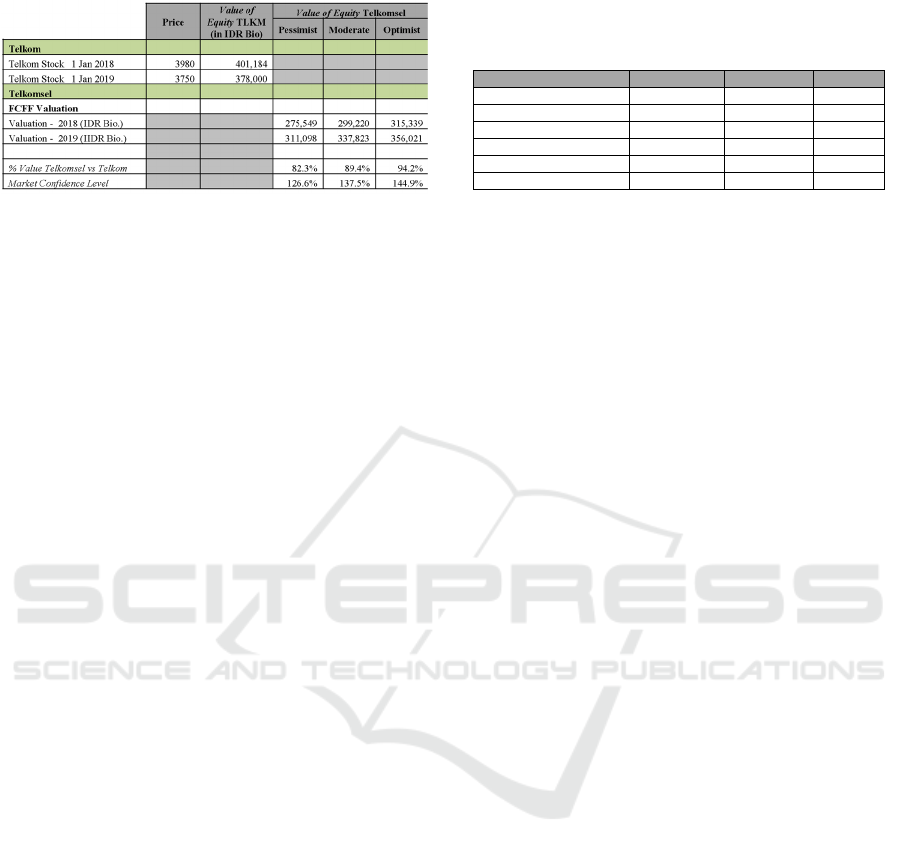
Table 5: Comparison of Telkomsel Valuation.
Based on Table 5 above, it is explained that
Telkom's share price at the opening of the beginning
of 2018 is at the price of IDR 3980, whereas Value of
Equity based on market price is IDR 401.18 trillion,
and at the beginning of the following year, namely
2019, the opening price of the beginning of 2019 fell
to IDR 3750 and Value of Equity of IDR 378 trillion,
this shows a decrease in Telkom's share price in the
market of IDR 230 within one year.
For comparison with the results of the previous
Telkomsel valuation where fair value was obtained in
2018, the calculation is done by involving the
calculation of WACC, so that the figure value of
Equity for the pessimistic scenario for 2019 is IDR
311.09 trillion, then for the moderate scenario the
calculation of Value of Equity becomes IDR 337.82
trillion, and for the optimistic scenario to be IDR
356.02. If a comparison of carried Value of Equity is
out by the two companies, where Telkom as a
Telkomsel shareholder with a 65% share, then the
market confidence level is 126.6% for the pessimistic
scenario, 137.5% for the moderate scenario and 144.9
% for optimistic scenarios.
3.4.2 Dividend Discount Model
Based on Table 6, it can be seen that the intrinsic
value of Telkomsel shares in the Pessimistic scenario
with the FCFF method is IDR 1509.28 while the
DDM method is IDR 1402.68 with a value difference
of 7.6%. For the Moderate scenario, the intrinsic
value of Telkomsel's shares with the FCFF method is
IDR 1638.93 while the DDM method is IDR 1515.01
with a value difference of 8.2%. For Optimistic
scenario, the intrinsic value of Telkomsel's shares
with the FCFF method is IDR 1727.22 while the
DDM method is IDR 1519.19 with a difference in the
value of 8.5%. In Value of Equity Pessimistic
scenario, the value obtained by the FCFF method is
IDR 275.58 trillion while the DDM method is IDR
256.08 trillion. In the moderate scenario, Value of
Equity Telkomsel's with the FCFF method is IDR
299.22 trillion while the DDM method is IDR 276.59
trillion. On the optimistic scenario Value of Equity
using the FCFF method is IDR 315.33 trillion while
the DDM method is IDR 290.5 trillion.
Table 6: Comparison of FCFF vs. DDM.
3.4.3 Relative Valuation - PER and PBV
Based on the results of the calculation, we then
process and analyze overall data of Telkomsel's stock
valuation using the Relative method Valuation
attached in the previous Table 4.14 using the
pessimistic, moderate and optimistic scenario. The
results showed that the PBV value in the pessimistic
scenario was 4.97 times, the moderate scenario was
5.44 times, and the optimistic scenario was 5.75
times.
If we make a comparison with quarterly IDX
statistical data (Q1 2018), it shows that the average
value of PBVs in telecommunications companies is
1.33 times, with the lowest value in PBV, namely the
value of PT. Bakrie Telecom Tbk. (BTEL) at -0.13
times and the highest PBV in PT. Telekomunikasi
Indonesia (Persero) Tbk. (TLKM) at 3.24 times. This
shows that the results of the research calculations are
above the PBV range that is in the market at this time.
For the calculation of the Telkomsel PER, the
results showed that the PER value in the pessimistic
scenario was 7.0 times, the moderate scenario was
7.66 times, and the optimistic scenario was 8.1 times.
If we make a comparison with quarterly IDX data (Q1
2018) which shows that the average PER value of
telecommunications companies is 21.55 times, with
the lowest value PER, namely PT. Smartfren
Telecom Tbk. (FREN) at -1.72 times and the highest
PER value in PT. XL Axiata Tbk. (EXCL) at 71.78
times. This shows that the results of research
calculations are within the range of PER in the market
at this time.
4 CONCLUSIONS
The study described how we calculate the fair value
of the company and the stock price of Telkomsel
using Free Cash Flow to Firm, Discount Model
Dividend, and Relative Valuation methods. We
calculated the fair value of the company and the
intrinsic value of Telkomsel shares by using the Free
Sce n a r i os P e ssi m i st M o d er a t e O p t i m i st
EV (IDR Bio) 275,548.76 299,220.11 315,338.78
Intrinsic Value of Shares (IDR) 1509.28 1638.93 1727.22
DDM Valuation
EV (IDR Bio) 256,087.51 276,595.26 290,503.46
Intrinsic Value of Shares (IDR) 1402.68 1515.01 1591.19
Shar e Pr ice D i f f . 7.6% 8.2% 8.5%
ICIB 2019 - The 2nd International Conference on Inclusive Business in the Changing World
346

Cash Flow to Firm method in a pessimistic scenario,
the moderate scenario and the optimistic scenario. If
compared with the condition of the market value of
PT. Telkom (TLKM) as the holding company at the
beginning of 2019, the fair value of the Telkomsel is
still in a favorable condition, where the confidence
level of the Value of Equity TLKM is 126.6% for the
pessimistic scenario, 137.5 % for moderate scenarios
and 144.9% for optimistic scenarios.
Using the Dividend Discount Model method in a
pessimistic scenario resulted in 5.2% difference
compared to FCFF valuation, and for the moderate
scenario resulted in 6.5% difference, while in the
optimistic scenario resulted in 7.3% difference in
intrinsic stock value from the FCFF valuation. The
Relative Valuation method used is the PER (approach
Price Earnings Ratio) and PBV (Price Book Value),
to evaluate the fair value of the company and the
intrinsic value of Telkomsel shares, which in the
pessimistic scenario gives the PBV value of 4.97
times and PER of 7 times, while the moderate
scenario of Telkomsel has PBV value of 5.44 times
and PER of 7.66 times, then in the optimistic scenario
Telkomsel has PBV value of 5.75 times and PER of
8.1 times. The calculation results, when compared
with the market conditions in the IDX (statistical data
for financial, quarterly) during Q1 2018 period in the
telecommunications industry, will give the PBV
above the market range, while the PER value is still
within the range currently in the market.
Based on the results of the conclusions above, the
authors can make several suggestions that can be
taken into consideration in further writing. For
companies, to develop and increase the value of
shares in the market, especially for companies that
have not made an initial offer (IPO), in addition to
improving company performance with revenue and
Net Income, the company should also consider
alternatives to model the mapping of cost and expense
of the companies for both OPEX and CAPEX in this
company, of which this research shows the change in
the proportion of expenses, which can indicate
patterns of expenditure that are not effective.
For the next study, in order to gain significant
result whether the valuation theory can be applied in
any different context in Indonesia and
telecommunication industry, the researcher should be
able to describe the conditional assumption in the
industry environments, not only counting the forecast
based on historical financial numbers. This is critical
because valuation is very dependent on the
assumptions used so that the valuation between
researchers might yield different results.
For investors, in addition to paying attention to the
target stock price and enterprise value, we should
consider the fundamental conditions and company
performance outside the financial statement
information, such as competitor condition and market
awareness in other industry, as a comparison in
decision making. Theoretically, in decision making,
it is usually recommended to buy shares under the
intrinsic value, but it must be noted that other
conditions can support the sustainability of the
company's business as well.
REFERENCES
Chirputkar, A., Kulkarni, P., Vadgama, C., Prabhu, S.,
2016. Valuation Techniques in Telecommunication
Industry – An Alternative Approach based on
Operating Cash Flow and Number of Subscribers,
Telecom Business Review, SITM Journal Volume 9.
Damodaran, A., 2012. Investment Philosophies: Successful
Strategies and the Investors Who Made Them Work
Investment Philosophies, John Wiley & Sons Inc,
United States of America.
Glaum, M., Friedrich, N., 2006, After the ‘‘Bubble’’:
Valuation of Telecommunications Companies by
Financial Analysts, Journal of International Financial
Management and Accounting 17:2, 160-174.
Ivanovska, N., Ivanovski,Z., Narasanov. X., 2014.
Fundamental Analysis and Discounted Free Cash Flow
Valuation of Stocks at Macedonian Stock Exchange.
UTMS Journal of Economics 5 (1): 11–24.
Neaxie, LV., Hendrawan,R., 2017. Stock Valuations in
Telecommunication Firms: Evidence from Indonesia
Stock Exchange, Journal of Economic & Management
Perspectives 11 (3), 455-455.
Saplitsa, Iryna, 2008. Business Analysis and Valuation of
Vodafone Group. Economics and Business
Administration program, NORGES
HANDELSHØYSKOLE.
Wahyudi, A., Surya, B., 2013. Company Valuation
Analysis On PT Dayamitra Telekomunikasi in
Preparation of IPO, The Indonesian Journal Of
Business Administration Vol. 2.
Zemba, S. Hendrawan, R., 2018. Does Rapidly Growing
Revenues Always Produce An Excellent Company’s
Value? DCF & P/E Valuation Assessment on Hospital
Industry. Proceeding of Management: Vol.5.
Should Telkom do IPO for Telkomsel ?
347
