
Transportation Strategy in Optimization the Economic Value and
Operational Reliability (Case Study of PT Adaro MetCoal (AMC),
Subco from PT Adaro Energy Tbk)
Hadi Purnomo and Kin Tjendrasa
School of Business and Management, Institut Teknologi Bandung, Gd. Graha Irama 12th Floor,
Jl. H.R. Rasuna Said Kav. 1-2, Kuningan Timur Jakarta Selatan, 12950, Jakarta Campus, Indonesia
Keywords: Logistics & Coal Supply Chain, Barge to Barge Transfer in the River, Optimizing Logistics Cost Saving,
Logistics Improvement.
Abstract: PT Adaro MetCoal Companies (AMC) is one of the subsidiaries of PT Adaro Energy, Tbk, which in October
2016 was acquired 100% from BHP Billiton. AMC has assets consisting of seven Coal Contracts of Work
(CCoW). BHP Billiton initially explored the Maruwai Coal Basin, in which the seven CCOWs are located
and made a significant capital investment over a number of years for studying and defining the potential and
coal quality of the area. AMC requires more than 73 km to transport coal from the Pit (mining location) to
Stockpile by hauling trucks in the road and about 615 km from Stockpile to the Taboneo offshore port,
transported by tug and barge through the river. AMC faces difficulties in their existing coal supply chain.
There are three transportation options that required investment which can be carried out by Adaro Group as a
logistics solution for AMC, namely Optimizing existing operations, direct barging (upper and lower cycles)
and Transferring trough the river. The study was carried out by analyzing technical, operational, financial of
the three options, with the same indicators to get the through-put cost per ton. The results of the study show
that the third option provides sufficient investment returns and efficiency to AMC in their logistics costs.
1 INTRODUCTION
In the existing coal port to port logistics, AMC needs
more than 73 km to transport the coal from mining pit
to stockpile, which located near from River Port, by
hauling truck via road and 615 km from its stockpile
to the Taboneo Offshore Anchorage, in the mount of
Barito River, by tug & barge. AMC faced difficulties
in their existing coal supply chain. Total production
is 0.5 million ton in 2016 needs 125 shipments with
eight dedicated set of tug & barges employed. This
condition is still far from AMC target to produce and
sale with production volume target about 3 million
ton per annum (MTPA) started in the year of 2020.
The existing of AMC infrastructure in the entire
their coal supply chain was first designed with the
particular capacity to be used at a certain project time.
It is clear that to increase production in succeeding
years, and the infrastructure will finally reach its
limit. The maximum capacity was designed with
production volume 1 MTPA. This maximum capacity
is influenced not only by the infrastructure but also by
the natural condition, since the AMC operation
located in the Central of Kalimantan with several
difficulties supply chain due to port and river
condition at hulu barito, tug & barge size limitation,
and weather uncertainty which cause tidal river draft.
Below table describes the total existing through-
put logistics cost (TC) per ton that AMC pays to the
third party. With total volume 1 MTPA and total TC
about 16.67 per ton (rise and fall formula applied for
fuel price & exchange rate), AMC spent about 16.7
million USD per year.
The question that needs to be answered is
highlighted on the improvement and development in
current operation, which faced on the logistics port to
port coal supply chain from the Pit to the export point,
Taboneo Offshore Port;
“What is the efficient way to operate coal
transportation about 3 MTPA for Adaro
MetCoal (AMC) in Central Kalimantan trough
Barito River?”.
Purnomo, H. and Tjendrasa, K.
Transportation Strategy in Optimization the Economic Value and Operational Reliability.
DOI: 10.5220/0008430903290336
In Proceedings of the 2nd International Conference on Inclusive Business in the Changing World (ICIB 2019), pages 329-336
ISBN: 978-989-758-408-4
Copyright
c
2020 by SCITEPRESS – Science and Technology Publications, Lda. All rights reserved
329
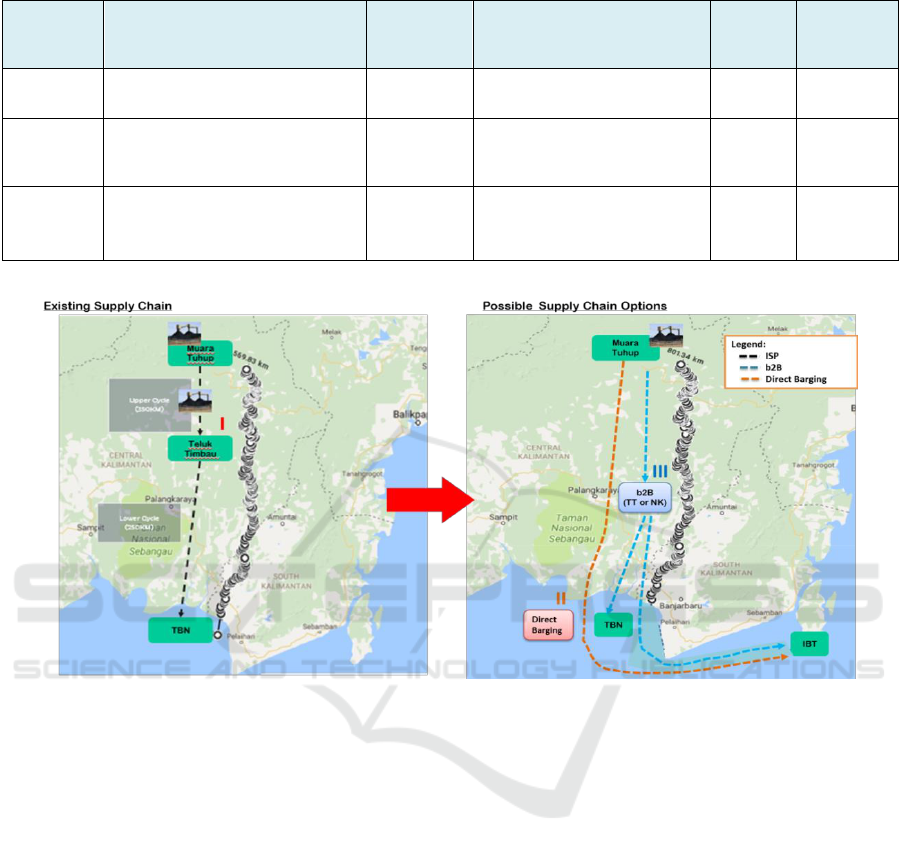
Table 1: AMC Existing Logistics Capacity & existing through-put logistics cost (TC) per ton.
Service
Product/Service Description
Maximum
volume
handled
The dedicated capacity provided
Unit Cost
(USD/mt)
Service
provider
Upper Cycle
route
Freight Services
1 Mtpa coal
12 set dedicated small Tug &
Barges 230ft employed
7.56
Third party
Intermediate
stockpile
Coal Handling –
Discharging/Stockpiling/Loading
1 Mtpa coal
Total Installed Capacity is
1,312,000 mt, while dedicated to
AMC is 150.000 mt
4.2
Third party
Lower Cycle
route
Freight Service
Transshipment service
1 Mtpa coal
3 set dedicated a large size of Tug
& Barges 300-330ft employed
1 unit Floating Crane
3.4
1.5
Third party
Source: Company Data
Figure 1: Identifying Options along Barito River (Source: Company Data).
Hence, the objective is to seek the best alternative
on the port to port supply chain model to transport
coal with production volume plan 3 MTPA for AMC
in Central Kalimantan trough Barito River without
sacrifice safety and coal security.
2 IDENTIFYING OPTIONS
To be able to transport 3 MTPA efficiently, herewith
the three options to be compared from this paper:
1. Optimizing existing operation with additional
investment in current facilities and equipment.
2. Direct barging method to transport coal directly
from Muara Tuhup to IBT Onshore Terminal in
Pulau Laut as a hub for export shipment.
3. Conducting river barge to Barge transfer (b2B) to
transport coal from Muara Tuhup using a small
barge to be transferred to a large barge then head
to Taboneo Offshore anchorage for export
shipment.
The map can be seen in figure 1.
3 METHOD AND DATA
COLLECTION
The analysis will be done through both quantitative
and qualitative assessment. Quantitative will focus on
financial matters (investment indicators) while
qualitative will focus on the comparison of several
factors, which covers technical, operational, safety
and other important components.
The quantitative assessment is carried out by
comparing existing TC with the new TC obtained
from the investment calculation of each option, with
an economic variable defined as a company standard.
Data Collected consist of primary data and secondary
data, however mostly secondary data from the
ICIB 2019 - The 2nd International Conference on Inclusive Business in the Changing World
330
Company's Internal Database, Consultants, Annual
Report, Conferences and Investor Presentations, as
well as from the internal study of the relevant
literature.
4 RESULT AND DISCUSSION
4.1 Coal Overview
4.1.1 Global Coal Overview
Coal price in Indonesia highly depends on the global
situation. China and India are key players in the coal
markets, both as producer and consumer. They give
import a balancing role to fulfill the portion that
cannot be covered by domestic supply, so due to the
large scale of these countries, fluctuations in their
imports can influence the global market. China
currently operates approximately 920 gigawatts
(GW) of coal-fired power plants, with more than 140
GW additional capacities expected to commence
operations in the next three years. In the long run,
China's plan to continue relying on coal as the main
fuel for power generation will keep it the most
dominant consumer in the global coal market.
On the other side, the projected industrial growth
of India is expected to push the country to require
more coal. India currently has approximately 70 GW
of coal-fired capacity under construction, and another
130 GW under the proposal. To support their
electrification, the Indian government has
implemented aggressive plans to increase domestic
coal production from Coal India. Regardless of the
efforts, the higher ash content and impurities of
Indian coal requires the country to continue importing
coal of lower pollutant content in order to balance its
domestic coal. India is estimated to be one of the key
drivers in the seaborne thermal coal markets along
with the Southeast Asian countries.
Southeast Asia (SEA), currently the 3rd largest
economic region in Asia and the 7th largest globally,
is a major driver of Asia's economic growth. The
region's rapidly growing economy and population
have increased demand for electricity by an average
rate of 6% per annum since 2000. Wood Mackenzie
predicts that the demand will keep growing at a rate
of 4.6% per annum until 2035. As of 2016, the region
had approximately 240 GW installed power
generation capacity, and an addition of 111 GW is
expected by 2025.
4.1.2 Indonesia Coal Overview
Indonesia, currently expected its 35,000 MW
electrification program, is spearheading the growth of
coal-fired power plants in Southeast Asia. The
program expects to add approximately 20,000 MW of
coal fired capacity, which translates to an addition of
70 Mt to 80 Mt of coal demand on top of the current
level as in table 2. For Indonesia, coal is not only the
most consumed fuel for the electrification program
but also a significant contributor to the country's
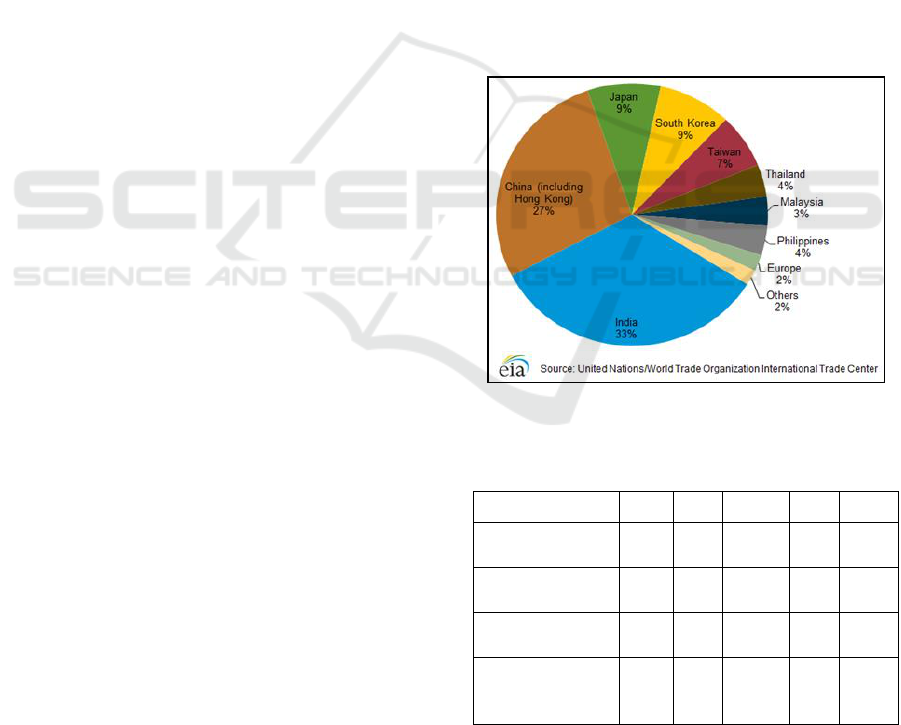
foreign reserves and non-tax revenues. As in figure 2,
96% of Indonesia coal export focuses on the region of
Asia with India and China.
It is projected that domestic coal consumption will
increase significantly due to the government policy
for electricity using coal power plant. Rupiah per
kWh for coal is the lowest price compared to other
sources of energy. In 2017, the using of coal as a
source of energy valued Rp. 859 per kWh, meanwhile
fuel valued Rp. 6.691 per kWh.
Figure 2: Indonesia Coal Export by Destination.
Table 2: Coal Production Data during Period of 2013 –
2017.
Description
2013
2014
2015
2016
2017
Total Production
(Millon Tons)
474
458
461
463
476
Export
(Millon Tons)
402
382
375
372
369
Domestic (Millon
Tons)
72
76
86
91
107
Domestic to
Total Coal
Production
15%
17%
19%
20%
22%
Source: Ditjen Minerba 2017
Transportation Strategy in Optimization the Economic Value and Operational Reliability
331

4.2 Industry Analysis
Coal remains as the fuel of choice for developing
economies in Southeast Asia, Affordable and
abundant. For Indonesia, it will need to constantly
balance its export and domestic market, especially in
the near term when exports remain high. Exports are
expected to remain strong in the near term, staying
around 350-360 Mt until 2020.
Applying the result of the analysis through
Porter's 5 Forces Model to the Indonesia coal
industry, the result emerges as in table 3.
Table 3: Porter’s 5 Forces Model to the Indonesia coal industry.
Bargaining Power of Suppliers (low to medium)
• Coal is a commodity product
• Suppliers are concentrated, especially coal mining
contractors
• Limited or no potential of forwarding integration by
suppliers
• The industry association is important for players,
especially in influencing government policy
• High switching cost for players
Bargaining Power of Buyers/Customer (low to medium)
• Contract sales consist of a direct order from buyer, trader, and spot
sales from small companies. Mostly dominated by trader with a
long term contract
• Coal price easily benchmarked among suppliers
• Limited or no potential of backward integration by customers
• Limited type of product (coal). Easily compared with the
competitors
• Type of product (coal) affects customer’s overall production costs
• High switching cost for customers (to switch the sources of
product)
Competitive Rivalry within the Industry (low to medium)
• Only a few companies operate on a larger scale
• Industry growth is relatively directly correlated to (global) economic growth
• The industry has a high fixed cost
• This industry characterized high exit barriers
• Competitors approach customers in relatively the same way/style
The threat of substitute (low to medium)
• Few substitutes exist for coal, which are Oil, LNG, and
Renewable Energy. Their switching or application
requires adjustments in technology and equipment)
• Growth of the energy sector outpaces the rate of growth
of emergence and development of the substitute for
coal
• Regulation is critical to the success of development and
application of new substitute
The threat of New Entrants (low to medium)
• High capital requirement (to develop coal concession area, to
acquire heavy equipment, or to employ a massive work force)
• Regulation intensive (a company must obtain permits and license
to operate in this sector)
• Limited availability of coal concession areas for new players
• Economy of scale (on supply-side) is important to achieve
operational cost-efficiency
• Network effect (on demand-side) exists, especially in gaining
long-term sales contract
• High advantages for incumbents, especially in access to raw
materials, locations, government relations, and international
market
Table 4: Adaro Group SWOT Analysis.
Strengths:
• Diversified mining operations with several types of
calorie product
• Qualified operation & technical team
• Robust financial performance
• Awards and recognition
• Integrated Port to port operational within one holding
group company
• Strong Shareholder support for Management
Weaknesses:
• For certain mining concession is far from the
export point, impacting on the high logistics cost
Opportunities:
• Increasing coal demand, both of Domestics and
Export.
• Robust of government expenditure in
Infrastructure development, particularly for
domestic Coal Fire Power Plant (CFPP)
Threats:
• Government intervention on the concession given
• Operational hazards
• Adverse weather conditions
ICIB 2019 - The 2nd International Conference on Inclusive Business in the Changing World
332
4.3 Internal Analysis
The SWOT Analysis of PT. Adaro Energy, Tbk
(Adaro Group) based on the history, current
achievement, and future opportunity are detailed as in
table 4.
4.4 Supply Chain Management
Concept
According to Hui Jiang (2006), et al. through their
research on "The study on characteristics of Coal
Supply Chain", the development of coal supply chain
should be designed based on characteristics of R, S,
C, T, which described in the following quote.
“The manufacturing industry emphasizes the Q
(quality), C (Cost), S (service), V (Velocity),
emphasize the quick in action and logistics service,
after-sales service. This is different from the
situation of coal products. Coal is a consumptive
energy product, and the consumer needs change
slightly, just some changes in ash, moisture, sulfur
or size, and others. So, coal supply chain
management should emphasize the stability and
price, and the content of stability includes two
aspects, the stable quantity, and stable quality. The
stability of supply is influenced by distance and
transport conditions. Therefore, the core of the
coal supply chain management is R (resources), S
(stability: including Q (quality) and Q (quantity)),
C (cost), T (Transport)".
The transportation method will be a leading indicator
to generate the level of trough-put cost (TC) expected.
Hence, to be considered on the parameter, those three
options will definitely impact on the total TC paid by
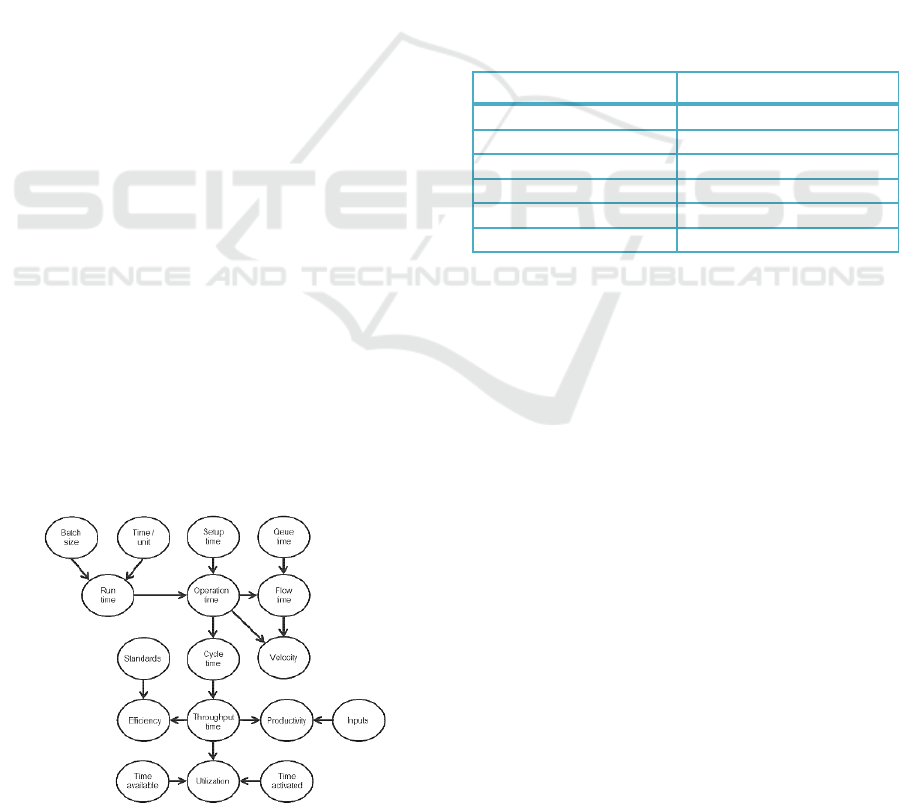
AMC To support the quantitative analysis, Chase and
Jacobs (2011) explained the relation of several
important factors through Process Performance
Matrices, as in figure 3.
Figure 3: Process Performance Matrices.
Above figure is explained as follows:
Operation time = Setup time + Run time
Flow time = Average time for a unit to move
though the system
Velocity = Flow time/Value-added time
Cycle time = Average time between
completion of units
Throughput rate = 1 / cycle time
Efficiency = actual output /standard output
Productivity = Output/Input
Utilization = Time activated / Time available
5 RESEARCH RESULT
To obtain total through-put cost is required to run a
financial model with basis variable economic from
Adaro Group Standard as in table 5.
Table 5: Variable economic used.
Parameters
Variable Economic
WACC
12.5%
Projection period
15 years
Tonnage volume
3 MTPA
Talk time
2000 TPH
Fuel Price
USD 1.06 per litre
Exchange rate
Rp 15.178 per USD
Source: Company Data
5.1 Option 1, Optimizing Existing
Operation with Additional
Investment in Current Facilities
and Equipment
There are two cycles in the existing operation to
transport the coal using Tug & Barges from Stockpile
Port to Taboneo Offshore Anchorage. The first cycle
is called Upper Cycle, which is the cycle transporting
the coal from Stockpile Port in Muara Tuhup (mining
site) to Intermediate Stockpile (ISP) in Teluk Timbau.
In this cycle, due to port and river condition at Hulu
Barito, Tug & Barge size limitation, coal only can be
carried out by small Tug & Barges with capacity 4000
DWT or 230-250 feet.
The second cycle is called lower cycle, that is the
cycle transporting the coal from ISP Teluk Timbau to
Taboneo Offshore Terminal for conduction ship to
ship transfer to Mother Vessel (Bulk Carrier) for
export shipment.
The financial result is described in table 6 and
table 7.
Transportation Strategy in Optimization the Economic Value and Operational Reliability
333
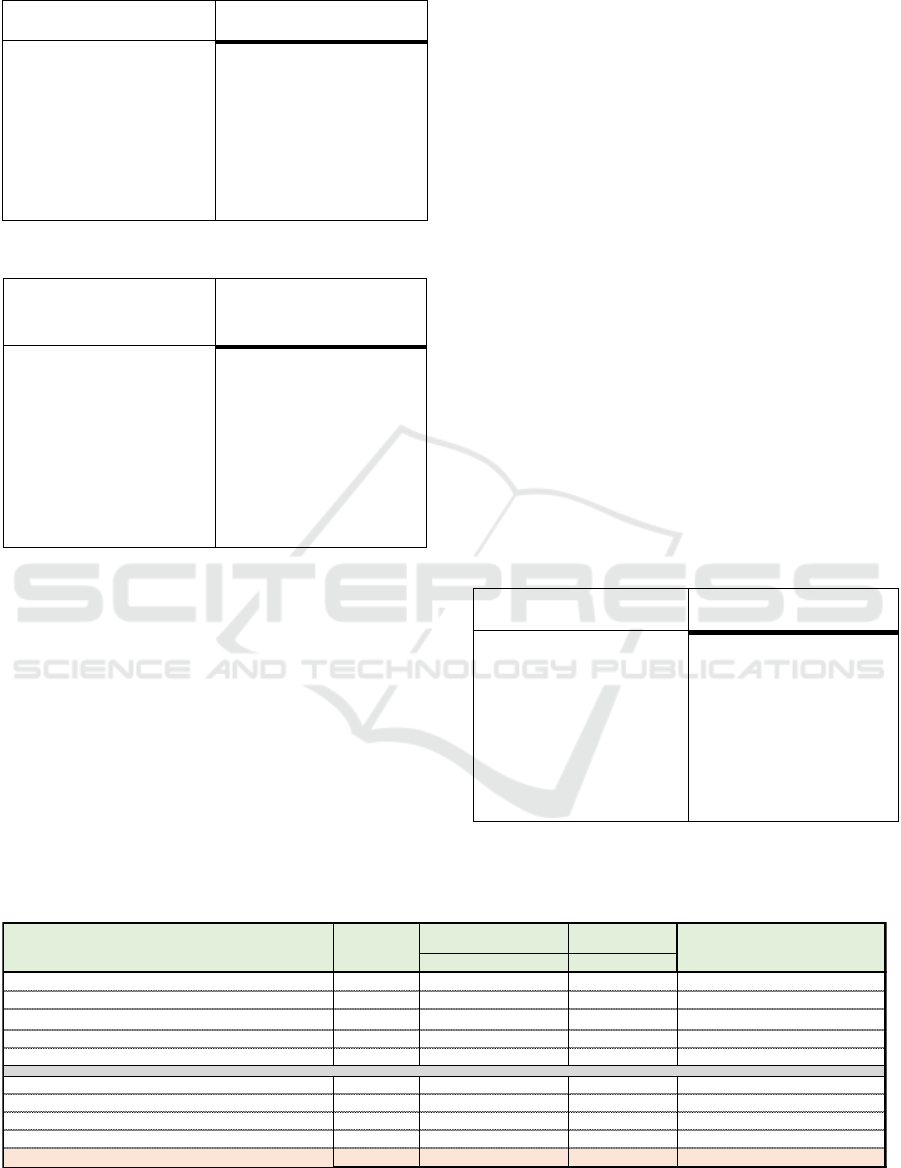
Table 6: Upper Cycle Barging Investment Result.
Financial Summary: upper
cycle barging investment
Annual figure (USD)
Revenue
30.275.783
EBITDA
13.774.729
EBITDA Margin
45%
Net Profit
10.128.896
Net Profit Margin
33%
Capex Investment
72.916.667
Fleet Requirement
29 set Tug &Barge
Payback Period
Six years
Throughput-Fee (TF)
10.09 per tonne
Table 7: Lower Cycle Barging Investment Result.
Financial Summary:
Lower cycle barging
investment
Annual figure (USD)
Revenue
11.235.585
EBITDA
4.303.310
EBITDA Margin
38%
Net Profit
1.783.310
Net Profit Margin
16%
Capex Investment
25.200.000
Fleet Requirement
7 set Tug & Barge
Payback Period
7 years
Throughput-Fee (TF)
3.75 per tonne
Based on financial analysis on the new investment
in sets of tug and barges in this option, the comparison
between the actual costs which AMC pays to the third
party as table 1 and new TC obtained from the
investment financial modelling particularly from new
tug and barge in the upper and lower cycle are
described in table 8.
According to table 8, total saving obtained from
the optimizing existing operation with additional
investment in current facilities and equipment,
particularly tug & barge in the upper and lower cycle
is 48 cent per ton which is equivalent to USD
1.440.000 per year.
5.2 Option 2, a Direct Barging Method
to Transport Coal Directly from
Muara Tuhup to IBT Onshore
Terminal in Pulau Laut as a Hub
for Export Shipment
The second option is to use a direct barging method
which there will be no separation in the shipment
cycle, either the upper cycle or lower cycle. The coal
will be transported directly from Muara Tuhup to IBT
using small size tug and barges, with size 4000 DWT.
IBT, Indonesia Bulk Terminal, is a subsidiary
company from Adaro Logistics, Subholding
Company of Adaro Energy which located in Pulau
Laut, South Kalimantan. The total distance from
Muara Tuhup Port to the IBT is 799 km, through river
and sea. The allowable speed for tug & barge depends
on the weather and crowd along Barito River. The
range of allowable speed for tug & barge is 3.5 – 6
knot, hence one round trip for that vessel from Muara
Tuhup to IBT and back to the Muara Tuhup is 18.5
days.
The financial result is described in the following
table 9.
Table 9: Direct Barging Investment Result.
Financial Summary:
direct barging investment
Annual figure (USD)
Revenue
57.271.445
EBITDA
21.740.573
EBITDA Margin
38%
Net Profit
15.490.573
Net Profit Margin
33%
Capex Investment
125.000.000
Fleet Requirement
50 set Tug &Barge
Payback Period
7 years
Throughput-Fee (TF)
18.94 per tonne
Table 8: Option 1 Result.
Existing cost (TF) OPTION I
based on Formula
Fuel Price USD/Ltr 1.06 1.06
FX IDR/USD 15,179 15,179
Projection year year 15 years
Annual Throughput volume MT/ yr 1 MTPA 3 MTPA
Lower cycle barge capacity DWT 10,000 10,000
Upper Cycle (4000 dwt) USD/ ton 10.18 10.09 Option 1: new investment
Current ISP cost USD/ ton 4.20 4.20 third party income
Lower cycle USD/ ton 4.14 3.75 Option 1: new investment
Transshipment at Taboneo (Gearless) USD/ ton 1.94 1.94 adaro group income
TOTAL COST USD/ ton 20.46 19.98 saving: 48 cent usd
Description
UOM
Remarks
ICIB 2019 - The 2nd International Conference on Inclusive Business in the Changing World
334
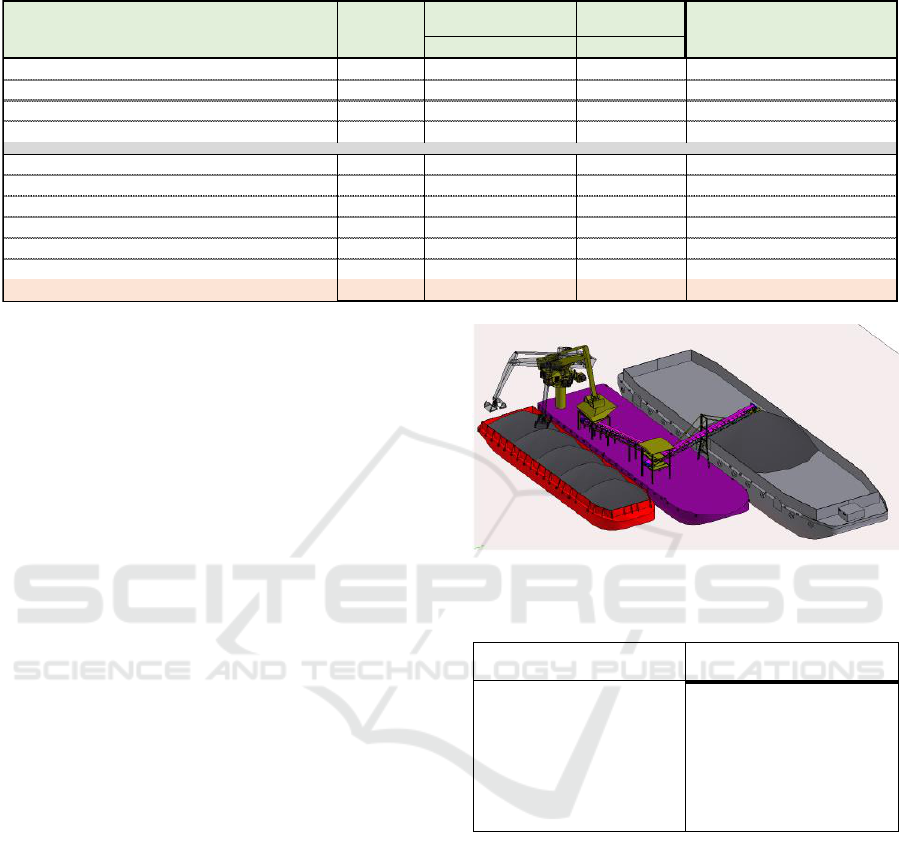
Table 10: Option 2 Result.
Based on financial analysis on the new investment
in sets of tug and barges in this option, the comparison
between the actual costs which AMC pays to the third
party and new TC obtained from the investment
financial modeling particularly from new tug and
barge in direct barging method are described in the
table 10.
The option 2, direct barging method, is more
expensive than total existing TC, where instead it
contributes negatively by USD 2.940.000 per year.
5.3 Option 3, Conducting River Barge
to Barge Transfer (b2B) to
Transport Coal from Muara Tuhup
using a small barge to be
Transferred to a Large Barge then
head to Taboneo Offshore Port for
export Shipment
As in figure 1, the b2B transfer method is the new
method replacing ISP requirement, which it is used to
transfer coal directly from small barge to the large
barge in the river without unloading the coal to the
onshore facility (ISP). There will be still required two
cycles for barging activity, upper and lower cycle.
The export point stills same to be located at Taboneo
offshore port.
The financial result is described in the following
table 11.
Based on financial analysis on the new investment
in sets of tug and barges and b2B transfer facility in
this option, the comparison between the actual costs
which AMC pays to a third party and new TC
obtained from the investment financial modeling are
described in table 12.
Figure 4: Process Performance Matrices.
Table 11: b2B Transfer Facility Investment Result.
Financial Summary: direct
barging investment
Annual figure (USD)
Revenue
12.061.790
EBITDA
6.128.782
EBITDA Margin
51%
Net Profit
1.229.259
Net Profit Margin
10%
Capex Investment
38.483.744
Payback Period
6 years
Throughput-Fee (TF)
4.02 per tonne
The total saving obtained from conducting river
barge to Barge transfer (b2B) to transport coal from
Muara Tuhup using a small barge to be transferred to
large barge in the river then head to Taboneo Offshore
Anchorage is 66 cent per ton which is equivalent to
USD 1.980.000 per year.
5.4 Qualitative Assessment
Qualitative assessment will focus on the comparison
of several factors, which covers technical,
operational, safety and other important components
which explained in table 13.
Existing cost (TF) OPTION II
based on Formula
Fuel Price USD/Ltr 1.06 1.06
FX IDR/USD 15,179 15,179
Projection year year 15 years
Annual Throughput volume MT/ yr 1 MTPA 3 MTPA
Upper Cycle (4000 dwt) USD/ ton 10.18
Direct Barging (4000 dwt) USD/ ton 18.94 Option 2: New Investment
Current ISP cost USD/ ton 4.20
Lower cycle USD/ ton 4.14
Transshipment at Taboneo (Gearless) USD/ ton 1.94
IBT Handling Fee USD/ ton 2.50 Adaro Group Income
TOTAL COST USD/ ton 20.46 21.44 loss: 98 cent usd
Description
UOM
Remarks
Transportation Strategy in Optimization the Economic Value and Operational Reliability
335
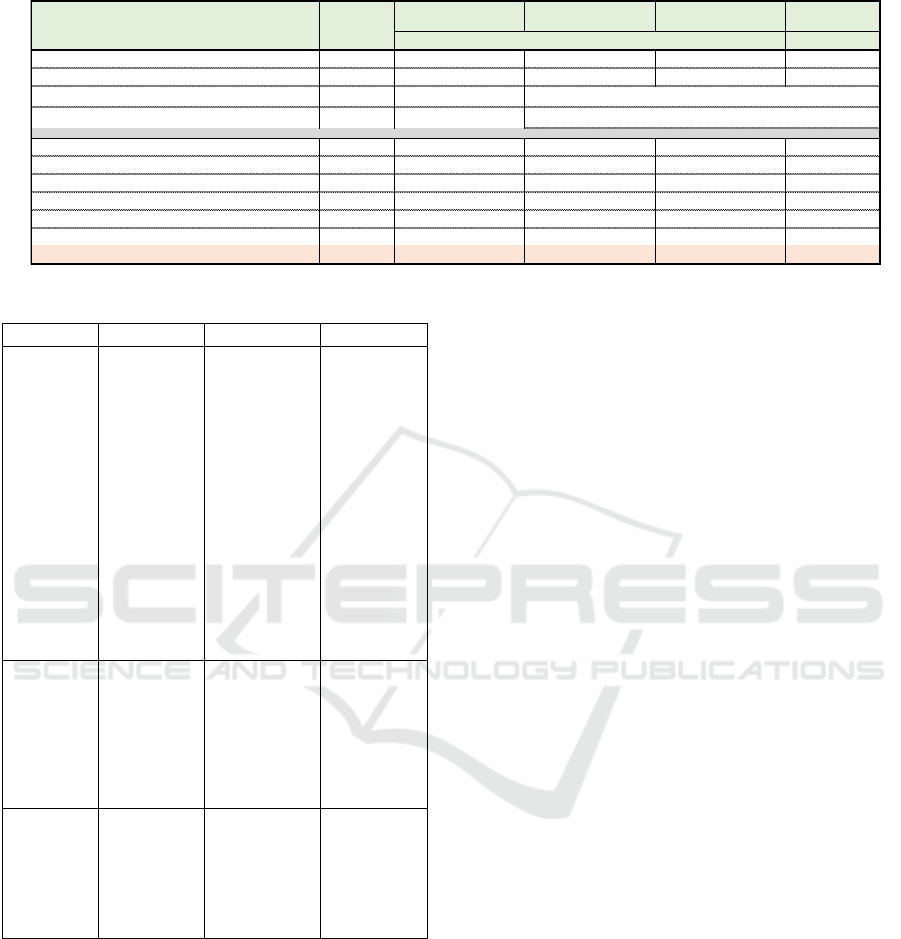
Table 12: End to End Total Cost Summary Result.
Table 13: Qualitative assessment.
Option 1
Option 2
Option 3
Technical
analysis
Option 1 is
less risk
compared to
the other
option since
it is only
improved
from the
existing
method with
increase the
capacity of
tug & barge.
Technically
direct barging
method is
feasible to be
done for 799
km distance,
from Muara
Tuhup to IBT.
The small tug
& barge will
be used along
the way for
18.5 days
cycle time.
Option 3 is
more
complicated
compared
the other
since it needs
to develop a
new system,
b2B transfer
in the river.
New
expertise,
System, and
operation
schedule
must be
prepared.
Operational
analysis
Option 1
operationally
feasible to be
carried out.
Direct barging
will cause a
heavy
operation
since there is a
lot of tug *
barge
employed.
Option 3
operationally
feasible to be
carried out
with a new
system and
procedure.
Safety &
other
No issue in
the safety
Big issue in
the safety that
needs to
mitigate
The new
system and
procedure
must in-line
with new risk
mitigation on
the safety.
6 CONCLUSION
Coal logistics is the second biggest cost in coal
mining activity after fuel cost. Hence to survive and
efficient in the operation, AMC needs to move and
manage the cost of their logistics. Until now, the coal
logistic activity causes huge inefficiency even less
that cost goes to the third party. Those three options
that have been analyzed can be used to optimize the
production of about 3 MTPA. Operationally and
technically doable to be conducted in Barito River
with the certain risk that to be mitigated, however,
according to table 13 options 1 and 3 are less risk
compared the option2. Hence, the main parameter to
be compared to justify decision making is the
financial result of the new additional investment.
Based on table 12, End to End Total Cost
Summary Result, the most efficient option to be
proposed to AMC is option 3. The efficiency from the
total throughput is about USD 66 cent per ton or
equivalent with USD 1.98 million per year with
production volume 3 MTPA.
REFERENCES
Adaro Energi. (2018, June 1). Adaro Energy Annual Report
of 2017. Retrieved from http://www.adaro.com
Alan Smyth. (2014). Barito River Logistics Coal
Transportation. BHP Billiton Report.
Allen, Glenn, et al. 1993. Improving throughput of a coal
transport system with the aid of three simple models.
The Institute of Management sciences
Jian, Hui, et al., 2006, The Study on Structure and
Characteristics of Coal Supply Chain, School of
Management, Xuzhou China
Fine, Lawrence G. (2009). The SWOT Analysis. North
Charleston, SC: Createspace
Franco Modigliani and Merton H. Miller, “The Cost of
Capital, Corporate Finance and Theory of Investment”,
The American Economic Review, Vol. 48, No. 3(Jun,
1958), pp.261-297
Rothaermel, Frank T. (2015). Strategic Management 2nd
Edition, New York: McGraw-Hill.
Existing cost (TF) OPTION I OPTION II OPTION III
based on Formula
Fuel Price USD/Ltr 1.06 1.06 1.06 1.06
FX IDR/USD 15,179 15,179 15,179 15,179
Projection year year
Annual Throughput volume MT/ yr 1 MTPA
Upper Cycle (4000 dwt) USD/ ton 10.18 10.09 10.09
Direct Barging USD/ ton - - 18.94 -
ISP / b2B USD/ ton 4.20 4.20 4.02
Lower Cycle USD/ ton 4.14 3.75 3.75
Transshipment at Taboneo (Gearless) USD/ ton 1.94 1.94 1.94
IBT Handling Fee USD/ ton - 2.50 -
TOTAL COST USD/ ton 20.46 19.98 21.44 19.80
15 years
3 MTPA
Description
UOM
ICIB 2019 - The 2nd International Conference on Inclusive Business in the Changing World
336
