
Factors Affecting Profitability of Retail Company in Indonesia with
DUPONT Model Approach
Bobby Chandra and Dadan Rahadian
Master of Management Students, Telkom University, Bandung, Indonesia
Keywords: DuPont, Return on Equity, Net Profit Margin, Total Asset Turn Over, Equity Multiplier.
Abstract: In the end of 2017 some retail’s outlet was closed to survive in the business competition. This research will
determine the factors that affect the profitability of the retail industry in Indonesia. DuPont model shows that
profitability (ROE) could be divided into three ratios, namely Net Profit Margin (NPM), Total Asset Turn
Over (TATO), and Equity Multiplier (EM). This study aimed to determine how significant the influence of
NPM, TATO and EM factors had on profitability (ROE). The method used in this study was quantitative. The
number of samples used was 21 companies with a population of all retail companies listed on the Stock
Exchange for the period of 2010-2017. The results of this study indicated that in part the independent variables
significantly influence the variable profitability (ROE).
1 INTRODUCTION
The development of retail business in Indonesia has
proceeded to impact on intense business competition.
Throughout 2017, there were quite surprising
phenomena in Indonesia’s retail industry, some
industries closed a number of outlets to survive the
business competition, and even some international
retail industries closed their businesses. Take Lotus
as an example. At the end of 2017, Lotus closed three
outlets in Thamrin, Cibubur, and Bekasi; besides that
Ramayana Supermarket closed eight outlets on
October 28, 2017. Not to mention that Matahari
Department store also closed its outlets in Pasaraya
Manggarai and Pasaraya Blok M in September 2017,
and in mid-November 2017, Matahari closed its
outlets in the Lombok city center and Taman Anggrek
mall. Even at the end of June 2017, PT. Modern
International, tbk closed all Seven Eleven outlets in
Indonesia. This, of course, will be one particular
concern to the stakeholders, especially investors,
because the steps taken by market participants are
expected to increase the company's profits once more.
With regard to generating profits, according to
Harahap (2006:300), the ability of a company to make
a profit through all capabilities and existing resources
is called profitability. Profitability can be a major
attraction for investors because profitability can be
considered as a result obtained through a management
effort on the invested funds.
Based on the mentioned phenomena, the authors
are interested in conducting research on the retail
sector, especially regarding the performance of retail
companies in Indonesia in relation to generating
profitability. ROE is a parameter which can be used
as a comparison between the net incomes of an issuer
with its own capital (Harahap 2007: 156). Regarding
profitability, the DuPont model can be utilized to
measure the variables affecting a company's
profitability through analyzing profitability ratios,
into more detailed elements, so factors which can
affect the profitability of the company can be
searched.
2 LITERATURE REVIEW
2.1 Profitability and DuPont Model
According to Burja & Mǎrginean (2014), the name of
the DuPont model came from the name of the
company which began to introduce the formula in
1920, and was also known as the "Strategic Profit
Model". In the DuPont model, profitability based on
the ROE variable can be illustrated in the following
diagram:
136
Chandra, B. and Rahadian, D.
Factors Affecting Profitability of Retail Company in Indonesia with DUPONT Model Approach.
DOI: 10.5220/0008428401360142
In Proceedings of the 2nd International Conference on Inclusive Business in the Changing World (ICIB 2019), pages 136-142
ISBN: 978-989-758-408-4
Copyright
c
2020 by SCITEPRESS – Science and Technology Publications, Lda. All rights reserved
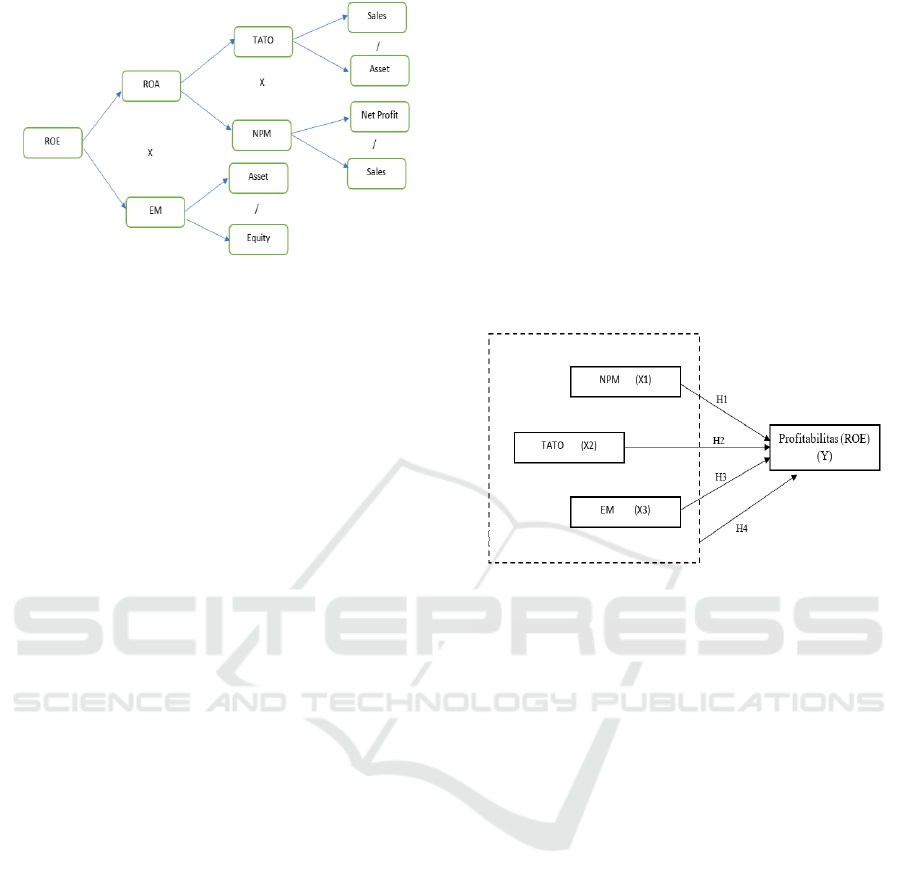
Figure 1: ROE Profitability of DuPont Model.
From the description of the DuPont model above, the
main ratio components can be described as follows:
2.1.1 Net Profit Margin (NPM)
Net Profit Margin is a profitability ratio which
describes the number of profits generated from sales
(Anarfi & Danquah, 2017). This means that the size
of the sales value will affect the ratio of the net profit
margin. Based on the DuPont model in figure 1, the
Net Profit Margin ratio can be formulated as follows:
NPM = Net Profit / Sales
2.1.2 Total Asset Turn Over (TATO)
Total Asset Turn Over is a ratio which describes the
company’s efficiency to generate sales (Anarfi &
Danquah, 2017). This is related to the efficiency in the
company, where the more efficient the company uses
its assets, the higher the sales. The Total Asset Turn
Over ratio can be formulated as follows:
TATO = Sales / Asset
2.1.3 Equity Multiplier (EM)
Equity Multiplier is a ratio which can depict the
percentage of financed/owned assets by shareholders
(Anarfi & Danquah, 2017). Equity Multiplier ratios
are often known as Financial Leverage. Financial
Leverage is determined by debt policy, dividend
policy and financial risk factors in the business. Based
on the DuPont model in figure 2-1, the ratio of Total
Asset Turn Over can be formulated as follows:
EM = Asset/ Equity
2.1.4 Return on Equity (ROE)
According to Harahap (2007: 156), ROE is a
comparison between the net incomes of an issuer with
its own capital. High ROE reflects that the company
managed to generate profits from its own capital. In
this study, the ROE variable will be used as a
measurement of profitability. The reason for choosing
this variable is because ROE can provide a level of
profit for capital invested by investors. The increase
in ROE will also boost the book value of the company
which impacts on the value of investment. The ROE
ratio can be calculated using the following formula:
ROE=Net Profit/Equity
ROE = NPM X TATO X EM
ROE = Net Profit/Sales X Sales/Asset X Asset/Equity
2.2 Research Model
Figure 2: Research Model.
Based on the research model in Figure 2, the
hypothesis which will be proposed in this study are:
H1: Net Profit Margin (NPM) variable has a
positive and significant effect on profitability
H2: Total Asset Turnover (TATO) variable has a
positive and significant effect on profitability
H3: Equity Multiplier (EM) variable has a positive
and significant effect on profitability
H4: Net Profit Margin (NPM), Total Asset Turn
Over (TATO) & Equity Multiplier (EM) have
a positive and significant effect on
profitability
3 RESEARCH METHOD
3.1 Research Types
The research type used in this study was associative
causal, based on the purpose of this study which is to
prove the causal relationship of several independent
variables on the dependent variable according to
established theories/models.
Factors Affecting Profitability of Retail Company in Indonesia with DUPONT Model Approach
137

3.2 Sample and Population
The population is 25 retail companies which have
been marketed on the IDX stock market for the period
2010-2017. The sampling technique in this study used
purposive sampling, namely:
• The retail companies are listed on the IDX and
have complete financial statements for the period of
2010-2017
• The retail companies which have complete
financial statements for the period of 2010-2017
• The Retail companies whose financial statements
do not have total equity, total assets and total sales
equal to 0 (zero), because it will result in failure at the
time of calculation
3.3 Data Collection
This study used secondary data collection methods,
namely data obtained from financial statements in the
period of 2010-2017. The data source used in this
study was the company's financial statements for the
period of 2010-2017 which can be obtained from the
company's official website.
3.4 Research Operational Variables
In detail, the variables used in this study are as
follows:
Table 1: Research Operational Variables.
Variable
Definition
Formula
Scale
ROE
Return on Equity is a
comparison on the net
profit of an issuer with
its own capital
(Harahap 2007:156).
Ratio
NPM
Net Profit Margin is a
profitability ratio
which deptict how
significant the profit
produced from sales is
(Anarfi & Danquah,
2017).
Ratio
TATO
Total Asset Turn Over
is a ratio which depicts
company’s efficiency
in producing sales
(Anarfi & Danquah,
2017)
Ratio
EM
Equity Multiplier is a
ratio which can show
the financed/owned
asset percentage of the
stakeholder (Anarfi &
Danquah, 2017).
Ratio
3.5 Descriptive Statistic Analysis
Descriptive analysis refers to the statistical values of
the data which have been collected, such as: mean
value, standard deviation, maximum value, minimum
value of all variables in the study, namely:
profitability (ROE), net profit margin (NPM), total
asset turn over (TATO), and equity multiplier (EM).
3.6 Estimation Selection of Common
Effect Model and Fixed Effect
Model
To determine the model used in the regression
between the Common Effect Model and the Fixed
Effect Model, the F Statistic Test (Chow) is
performed. The hypotheses used in the F Test (Chow)
are as follows:
H0: Model Common Effect
H1: Model Fixed Effect
H0 is accepted if the P-value is greater than the
value of α, whereas if the P-value is smaller than the
value of α, then H0 is rejected, and H1 will be
accepted.
3.7 Estimation Selection of Fixed Effect
Model and Random Effect Model
If the result of the F Test (Chow) shows that the P-
value is smaller than the value of α or the fixed effect
model is used more significantly than the common
effect model, further testing is needed to determine
whether to use the fixed effect model or random effect
model.
3.8 Estimation Selection of Common
Effect Model and Random Effect
Model
If the result of the F test (Chow) shows that the P-
value is greater than the value of α, or the common
effect model is used more significantly than the fixed
effect model, further testing is needed to determine
whether the common effect model will still be
selected or the random effect model. To determine
whether to choose the common effect model or
random effect model, the Lagrange Multiplier (LM)
test is used.
3.9 Classic Assumption Test
To find out whether the regression model that we used
in the study fulfilled the BLUE criteria, then a
ICIB 2019 - The 2nd International Conference on Inclusive Business in the Changing World
138

multiple linear regression prerequisite test was
conducted, namely the Classic Assumption test.
According to Gujarati (2015), only multicollinearity
and heteroscedasticity tests are needed in panel data
regression for classical assumption tests.
3.9.1 Multicollinearity Test
According to Ghozali (2005), Multicollinearity Test
aims to detect whether the independent variables in
the regression model are correlated. If there is a
correlation between the independent variables, then
the variable can be said to be not orthogonal. To
measure the occurrence of multicollinearity in the
regression model, it can be seen from the correlation
coefficient between each independent variable. If the
coefficient is> 0.80, multicollinearity occurs in the
regression model.
3.9.2 Heteroscedasticity Test
According to Ghozali (2013:139), Heteroscedasticity
test aims to detect whether inequality of variance
between a variable to another variable in the
regression model happened. If the residual variance
between one variable and another variable was
constant then it is called homoscedasticity, otherwise
it is called heteroscedasticity. A good regression
model is a model without heteroscedasticity.
Heteroscedasticity test can be done by the following
Glesjer test:
¦e
i
¦ = β
1
X
i
+ V
t
note:
β = absolute value, residual value of the
estimated equation
X
i
= explanatory variable
V
t
= interference element
3.10 Regression Equation Analysis
The data analysis technique used is multiple
regression analysis. Its function is to predict the value
of the dependent variable (Y) if the independent
variable (X) is two or more (Abdurahman & Muhidin,
2007: 198). In this study, the variables measured are
the effects of Net Profit Margin, Total Asset Turn
Over and Equity Multiplier as the variables on
profitability by using the following equation:
Y
i,t
= a + b
1
X
1
+ b
2
X
2
+ b
3
X
3
+ μ
i,t
Note:
Y : dependent variable, namely
retail company’s profitability
X
1
: Net Profit Margin
X
2
: Total Asset Turn Over
X
3
: Equity Multiplier
a : variable/constant number
b
1
, b
2
, b
3
: regression equation
μ
i,t
: residual variable, the i
entity, t
period
3.11 F Test
The purpose of this test is to find out whether the
independent variables simultaneously or as a whole
have a significant effect on the dependent variable.
The hypothesis used in this test is:
H0: The independent variables as a whole have a
significant effect on the dependent variable
H1: The independent variables as a whole have no
significant effect on the dependent variable. This test
is conducted by comparing F
count
with F
table
.
3.12 T-Test
The T-test is a test conducted to find out whether the
independent variable has a single influence on the
dependent variable by comparing the value of t
count
in
each independent variable with the value of t
table
. The
hypotheses that can be used in this test are:
H0: singly independent variable (X) has a
significant effect on the dependent variable (Y)
H1: singly independent variable (X) does not have
a significant effect on the dependent variable (Y)
4 ANALYSIS AND DISCUSSION
4.1 Descriptive Statistic Analysis
Table 2: Descriptive Statistic Analysis.
ROE
NPM
TATO
EM
Mean
15.90
5.52
190.13
245.11
Median
12.66
3.23
190.34
220.11
Maximum
160.99
68.10
717.94
873.47
Minimum
-39.91
-13.46
6.40
-151.68
Std. Dev.
19.48
7.72
104.87
138.38
Skewness
3.60
3.67
1.43
1.01
Kurtosis
24.38
27.67
7.88
5.64
Observations
168
168
168
168
Based on descriptive statistical analysis in table 2, the
maximum value of profitability is 160.99, and the
average value is 15.90.
Factors Affecting Profitability of Retail Company in Indonesia with DUPONT Model Approach
139
4.2 Estimation Selection of Common
Effect Model and Fixed Effect
Model
To determine the most suitable approach, Chow Test
is used. The hypothesis used is as follows:
H0: Value of F
count
> F
table
(0.05), then Common
Effect Model is chosen
H1: Value of F
count
< F
table
(0.05), then Fixed
Effect Model is chosen
Table 3. Chow Test Result.
Effect
Test
Statistic
d.f
Prob
Result
Cross-
section F
2.741470
(20.144)
0.0003
H0 is rejected,
H1 is accepted
Cross-
Section
Chi Square
54.202488
20
0.0001
4.3 Estimation Selection of Fixed Effect
Model and Random Effect Model
To determine the approach chosen between Fixed
Effect and Random Effect, the Hausman method is
used.
H0: Value of F
count
> F
table
(0.05),
then Random Effect Model is chosen
H1: Value of F
count
< F
table
(0.05),
then Fixed Effect Model is chosen
Table 4: Haussman Test Result.
Effect
Test
Ch-Sq.
Statistic
Chi-Sq. df
Prob.
Result
Cross-
section
random
8.392824
3
0.0386
H1 is
accepted
4.4 Estimation Selection of Common
Effect Model and Random Effect
Model
Lagrange Multiplier (LM) tests to choose between the
Common Effect Model and Random Effect Model do
not need to be conducted. This is because from the
results of the F (Chow Test) and Haussman tests, the
most effective model is the Fixed Effect Model.
4.5 Multicollinearity Test
Table 5 illustrates the results of the Multicollinearity
test. From the results of these tests, it can be seen that
Table 5: Multicollinearity Test Results.
NPM
TATO
EM
NPM
1.000000
-0.008336
0.096208
TATO
-0.008336
1.000000
0.434725
EM
0.096208
0.434725
1.000000
there is no correlation coefficient value above 0.8,
this proves that the data do not occur
multicollinearity.
4.6 Heteroscedasticity Test
Table 6. Heteroscedasticity Test Results.
Variable
Coefficient
Std.
Error
t-
statistic
Prob.
NPM
0,0187
0,0137
1,3592
0,1762
TATO
0,0017
0,0013
1,2945
0,1975
EM
0,0012
0,0008
1,3421
0,1817
From the results of the Heteroscedasticity test in
Table 6, it is seen that the probability value of each
variable is above 0.05 so that the data does not have
heteroscedasticity towards the variables.
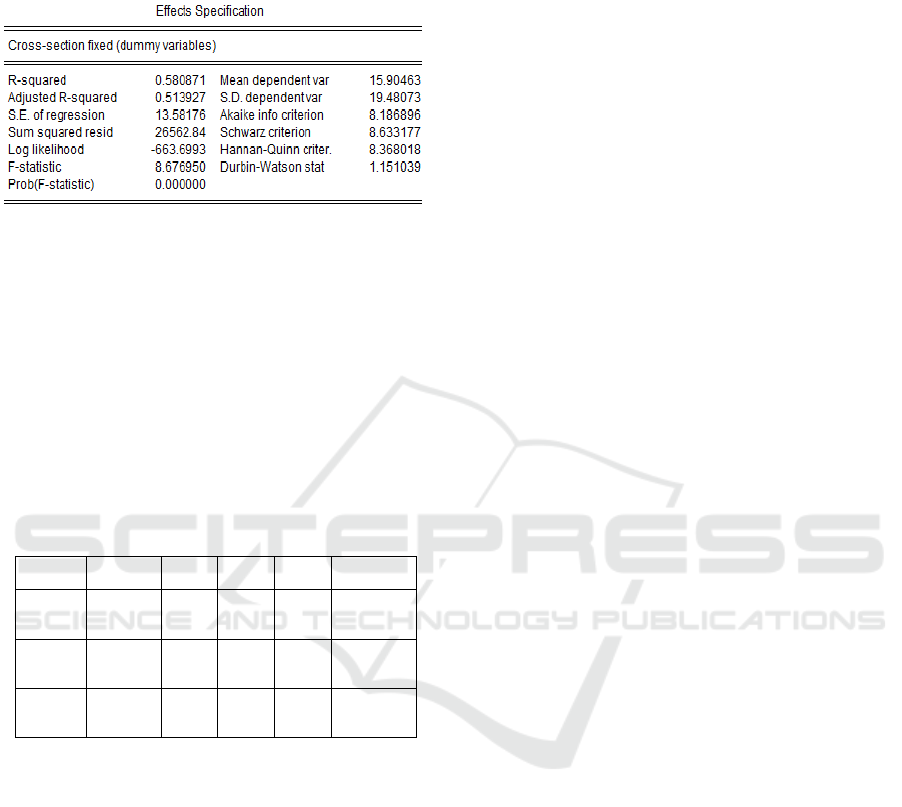
4.7 Panel Data Regression
Table 7 illustrates Panel Data Regression result, it is
seen the correlation between the independent variable
and dependent variable.
Table 7. Panel Data Regression Result.
ICIB 2019 - The 2nd International Conference on Inclusive Business in the Changing World
140
4.8 F Test
Table 8: F Test Result.
From the results of the data processing above, the F
value is 8.68, while the F table value is 2.66, so the
calculated F value is greater than F table. Besides that
the value is seen from P-value, the value is 0.0000,
which is smaller than 0.05. From these results, it can
be concluded that simultaneously and as a whole, net
profit margin, the total asset turn over and equity
multiplier as the independent variables significantly
influence the variable profitability (ROE).
4.9 t-Test
Table 9. t Test Result.
Variable
Coefficient
Std.
Error
t.
statistic
Prob
Result
NPM
1.577377
0.178288
8.847371
0.0000
Influenced
positively and
significantly
TATO
0.063305
0.017858
3.544884
0.0005
Influenced
positively and
significantly
EM
0.081733
0.011594
7.049572
0.0000
Influenced
positively and
significantly
Based on the table 9, all variables partially influence
profitability, where t statistic> t table (1.654).
5 CONCLUSION & SUGGESTION
5.1 Conclusion
5.1.1 Net Profit Margin’s (NPM) Influence
toward Profitability
The hypothesis one proposed in this study is the
variable of Net Profit Margin (NPM), which has a
positive and significant effect on profitability. Based
on the results of data processing, it can be seen that
the variable of Net Profit Margin (NPM) affects
profitability by having the highest coefficient of 1.58
on profitability. In addition, the value of t
count
is 8.85>
t
table
(1.654), and the significance value is 0.00 <0.05.
Thus, it can be concluded that H1 in this study was
accepted.
5.1.2 Total Asset Turn Over’s (TATO)
Influence toward Profitability
The second hypothesis proposed in this study is that
the Total Asset Turn Over (TATO) variable has a
positive and significant effect on profitability. Based
on the results of data processing, it can be seen that
the Total Asset Turn Over (TATO) variable has an
effect on profitability by having a coefficient that is
0.06 on company profitability. In addition, the value
of t
count
is 3.54> t
table
(1.654), and the significance
value is 0.00 <0.05. Thus, it can be concluded that H2
in this study was accepted.
5.1.3 Equity Multiplier (EM) Influence
toward Profitability
The third hypothesis proposed in this study is that the
Equity Multiplier (EM) variable has a positive and
significant effect on profitability. Based on the results
of data processing, it can be seen that the Equity
Multiplier (EM) variable affects profitability by
having a coefficient that is 0.08 on the retail
company’s profitability. In addition, the value of t
count
is 7.05> t
table
(1.654), and the significance value is
0.00 <0.05. Thus, it can be concluded that H3 in this
study was accepted.
5.2 Suggestion
- Based on the conducted calculations, the results
show that all variables have a positive and
significant influence on the retail company’s
profitability. However, the Net Profit Margin
variable has the highest coefficient, which needs
to be considered for retail market players. The one
way that can be done to increase the ratio of Net
Profit Margin is to reduce the operating costs, so
it can increase its net profit.
- It is recommended to add variables that affect the
retail company’s profitability in Indonesia in
order to find other factors as the profitability
determinants of retail companies.
- In this study, the obtained results showed the
highest coefficient in generating the profitability
of a retail company is from Net Profit Margin.
Therefore, further research can continue to
analyze the factors which affect the Net Profit
Margin variable.
Factors Affecting Profitability of Retail Company in Indonesia with DUPONT Model Approach
141

- It is recommended that further research can add a
wider scope such as ASEAN or other countries, so
it can be a study for retail companies in various
countries.
REFERENCES
Abdurahman, M. & Muhidin, S. A. (2007). Correlation,
Regression, and Path Analysis in Research. Bandung:
Badan Penerbit Pustaka Setia
Anarfi, D. & Danquah, K. A. B. (2017). Determinants of
Return on Equity in the Czech Agric and Forest
Industry. Journal of Innovative Research in Business &
Economics - ISSN - 2456-7868 Vol. 1, Issue 1, Page
01-49, April 2017
Burja, V. & Mărginean, R. (2014). The study of factors that
may influence the performance by the Dupont analysis
in the furniture industry, 21st International Economic
Conference 2014, IECS 2014, 16-17 May 2014, Sibiu,
Romania
Ghozali, I. (2005). Multivariate Analysis Aplication using
SPSS. Semarang. Indonesia: UNDIP.
Ghozali, I. (2013). Multivariate Analysis Aplication using
SPSS, 7
th
Edition (pp.139). Semarang. Indonesia:
UNDIP.
Gujarati N. Damodaran, Dawn C. P. (2015). Basic
Econometrics. Fourteenth Edition.
Halomoney. (2017). Retrieve from: https://
www.halomoney.co.id/
Harahap, S. S. (2006). Critical Analysis of the Financial
Report (pp.300). Jakarta. Indonesia: Raja Grafindo
Perkasa Ltd.
Harahap, S. S. (2007). Critical Analysis of the Financial
Report, 1
st
Edition (pp.156). Jakarta. Indonesia: Raja
Grafindo Persada Ltd.
IDNFinancial. (2018). Retrieve from: https://
www.idnfinancials.com/
ICIB 2019 - The 2nd International Conference on Inclusive Business in the Changing World
142
