
Share Valuation of Indonesian Regional Development Bank using
Free Cash Flow to Equity and Relative Valuation Methods
Riko Hendrawan, Niken Susilowati and Farida T. Kristanti
Magister Management, Telkom University, Jalan Gegerkalong Hilir, Bandung, Indonesia
Keywords: Valuation, Bank, DCF-FCFE, Relative Valuation, Indonesia Stock Exchange.
Abstract: The Indonesian Regional Development Banks established to help economic equality for all regions in
Indonesia, and most of them face limited capital. The purpose of this research is to determine the fair value
of Listed Regional Development Banks in IDX in 2018, using Discounted Cash Flow with FCFE approach
and validate the result using relative valuation methods with PER and PBV approach. The sample of this
research are BJBR, BJTM, and BEKS. Financial historical data from the last five years, since 2013 to 2017
as a basic reference for the projection from 2018 to 2022, involving pessimistic, moderate and optimistic
scenario and the value is compared with market price on January 2, 2018. Results of this research indicate
that using FCFE valuation, BJBR and BJTM has overvalued in all scenarios, while for BEKS has
undervalued in all scenarios. In relative valuation method within PER and PBV approach showed PER and
PBV of all sample this research is within the industry range means the result of the calculation is proper,
except PBV for BEKS in the moderate and optimistic scenario but not significant. The conclusion of this
research is to recommend selling shares BJBR and BJTM, and buying BEKS shares.
1 INTRODUCTION
The Regional Development Banks or Bank
Pembangunan Daerah (BPD) were established with
the aim of helping equitable development in all
regions in Indonesia. BPDs have a significant
function and role in the context of regional
economic development because BPDs are expected
to be able to provide services in areas where it is
economically impossible for private banks to
provide funds for the implementation of regional
development.
Based on the Regulation of Financial Services
Authority (OJK) No. 6/POJK.03/2016, banks can be
grouped into 4 (four) BOOK categories, namely:
BOOK 1 (main capital up to less than IDR 1
trillion), BOOK 2 (main capital IDR 1 trillion to less
than IDR 5 trillion), BOOK 3 (main capital of IDR 5
trillion to less than IDR 30 trillion), and BOOK 4
(main capital of at least IDR 30 trillion).
Most BPDs in Indonesia face limited capital.
Only 3 out of 27 BPDs are categorized as BOOK 3,
the rest are only in BUKU 1 or BUKU 2 categories.
Capital is an unavoidable need because banking
expansion is highly influenced by its main capital.
The capital market is an absolutely strategic place
for industries, including banks, to obtain
funding/long-term capital. This funding also
welcomes the BPDs. However, it was found in
September 2018 that only 3 of the 27 BPDs in
Indonesia had listed their shares on the IDX,
namely: PT Bank Pembangunan Daerah Jawa Barat
dan Banten Tbk (BJBR), PT Bank Pembangunan
Daerah Jawa Timur Tbk (BJTM) and PT Bank
Pembangunan Daerah Banten Tbk (BEKS).
A company will be able to attract and/or retain
investors by continuously creating and realizing the
value of the company. Investors expect the
investment value to increase or at least it will have
the same value as the risk compensation by
considering the time value of the invested money.
According to Damodaran (2012), valuation is a
relatively simple process to discount the company's
free cash flow projections with the rate of return
expected by the investors. Valuation of public
companies whose shares are listed on the stock
exchange is much easier than closed companies. The
value of a company listed on the stock exchange can
be reflected in its stock price movements. Therefore,
the object of this research is three BPDs listed on the
Indonesia Stock Exchange (IDX), namely: BJBR,
BJTM, and BEKS.
94
Hendrawan, R., Susilowati, N. and Kristanti, F.
Share Valuation of Indonesian Regional Development Bank using Free Cash Flow to Equity and Relative Valuation Methods.
DOI: 10.5220/0008427900940105
In Proceedings of the 2nd International Conference on Inclusive Business in the Changing World (ICIB 2019), pages 94-105
ISBN: 978-989-758-408-4
Copyright
c
2020 by SCITEPRESS – Science and Technology Publications, Lda. All rights reserved
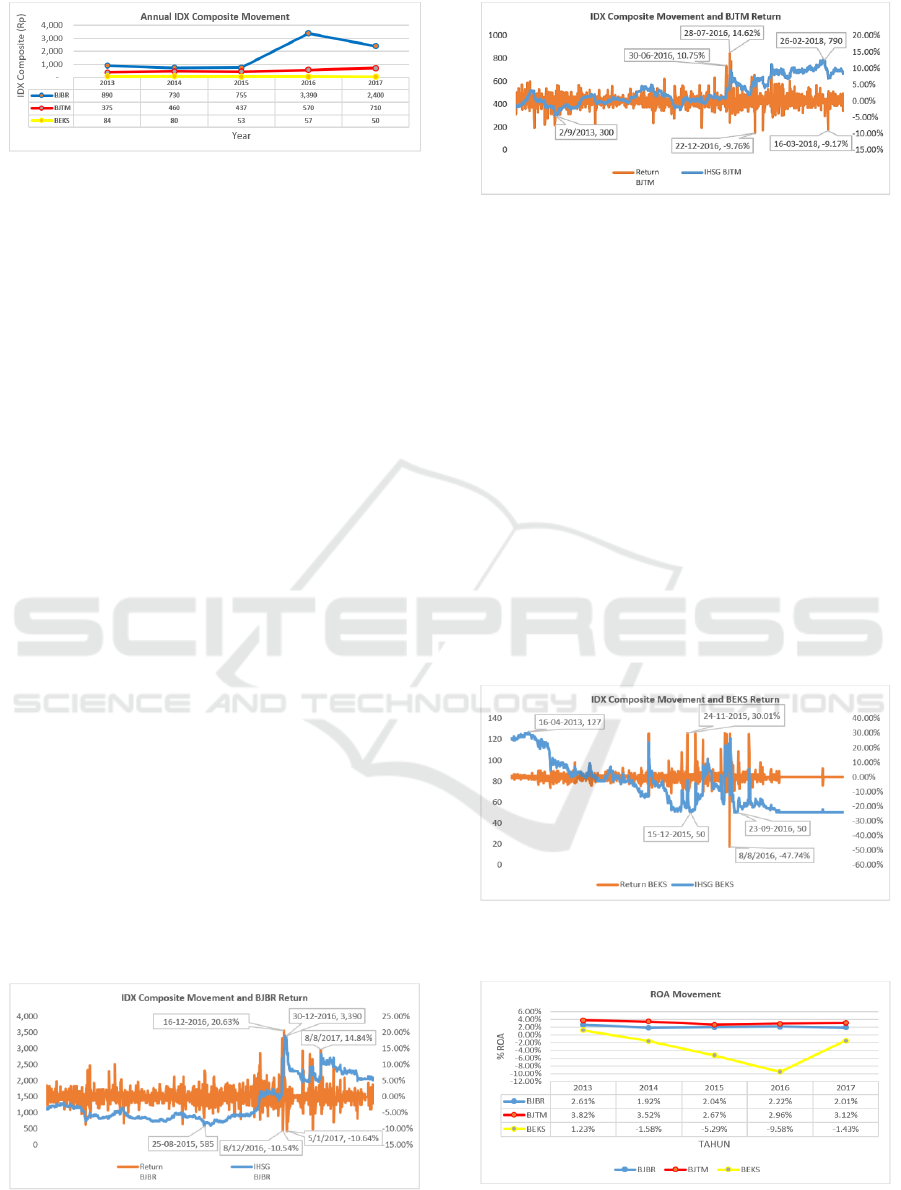
Figure 1: Annual IDX Composite Movement, period 2013
– 2017.
According to Damodaran (2012), the value of a
company or an investment instrument depends on
future cash flows that will be received or obtained
from the investment instrument. Based on data from
the IDX Composite Stock Price Index (IHSG) on
December 31, the data of three BPDs for the last five
years (2013 - 2017) are presented in Figure 1.
Based on Figure 1, throughout 2013 - 2017, the
IDX Composite for BJBR shares showed an
increasing trend with the highest point value of
3,390.00 IDR on December 31, 2016. However, on
December 31, 2017, it had a significant decline from
the previous year of 990.00 IDR (2,400 IDR-
3,390.00 IDR). Meanwhile, IDX Composite from
BJTM had an insignificant increasing trend until
December 31, 2017, which only amounted to
335.00 IDR (710.00 IDR-375.00 IDR) since the end
of 2013. On the other hand, BEKS IDX Composite
tended to have a downward trend from year to year,
with the lowest point taking place on December 31,
2017, with a value of 50.00 IDR.
Figure 2 shows the movement of BJBR shares
throughout January 2013 to June 2018, in which the
highest price of 3,390.00 IDR occurred on
December 30, 2016, and the lowest price of 585.00
IDR occurred on August 25, 2015. The highest
return 20.63% occurred on December 16, 2016, and
the lowest return of -10.64% occurred on January 5,
2017.
Figure 3 shows the movement of BJTM shares
from January 2013 to June 2018, in which the
highest price is 790.00 IDR which occurred on
Figure 2: IDX Composite Movement and BJBR Return of
BJBR, the period of January 2013 to June 2018.
Figure 3: Composite Index Movement and BJTM Return,
the period of January 2013 to June 2018.
February 26, 2018, and the lowest price is 300.00
IDR which occurred on September 2, 2013.
Meanwhile, the highest return of 14.62% occurred
on July 28, 2016, and the lowest return of -9.76%
occurred on December 22, 2016.
Figure 4 shows the movement of BEKS shares
from January 2013 to June 2018, in which the
highest price was 127.00 IDR on April 16, 2013, and
the lowest price was 50.00 IDR on December 15,
2015, and September 23, 2016. Meanwhile, the
highest return of 30.01% occurred on November 24,
2015, and the lowest return of -47.74% occurred on
August 8, 2016.
Financial ratio data in the form of Return on
Assets (ROA) and Return on Equity (ROE) listed in
the audited financial statements of the PT West Java
and Banten Regional Development Bank Tbk
Figure 4: Composite Index Movement and BEKS Return,
the period of January 2013 to June 2018.
Figure 5: Return on Assets (ROA) Movement from 2013
to 2017.
Share Valuation of Indonesian Regional Development Bank using Free Cash Flow to Equity and Relative Valuation Methods
95

(BJBR), PT East Java Regional Development Bank
Tbk (BJTM), and PT Banten Regional Development
Bank Tbk (BEKS) for the last 5 years (2013 to
2017) is presented in Figure 5 and Figure 6.
Based on Figure 5 and Figure 6, it can be seen
that from 2013 to 2017, BJBR’s ROA and ROE
tended to decrease, namely: 2.61% (ROA) in 2013
to 2.01% in 2017 and 26.76 % (ROE) in 2013 to
20.05% in 2017. A similar trend also occurred with
BJTM's ROA and ROE, namely: 3.82% (ROA) in
2013 to 3.12% in 2017, and 19.04% (ROE) in 2013
to 17.43% in 2017. Meanwhile, BEKS's ROA and
ROE showed a dramatic decline from 1.23% (ROA)
in 2013 to -9.58% in 2016, and -14.44% (ROE) in
2013 to -83, 76% in 2016. In 2017, the BEKS’s
ROA and ROE had a significant increase to -1.43%
(ROA) and -15.43% (ROE). However, the value of
BEKS’s ROA and ROE is still negative. A negative
value on ROA indicates that BEKS is in a loss
condition. While the negative value on ROE
describes that BEKS is not able to manage capital
efficiently to generate and increase revenue.
Another financial ratio used as the research
background is the variable Earning Per Share (EPS).
EPS is part of the company's profits allocated to
each outstanding share. Earnings per share or EPS
are the most widely used indicators to assess the
profitability of a company. Based on EPS data listed
in the audited financial statements of the BJBR,
BJTM and BEKS for the last 5 (five) years (2013 to
2017) are presented in Figure 7.
Based on Figure 7, it can be seen that throughout
the period 2013 to 2017, the movement of EPS
values for BJBR fluctuated and decreased in 2017 to
125.00 IDR/share when compared to 2013, which
was 141.59 IDR/share. Likewise, the value of
BEKS’s EPS decreased in 2017 to -1.19 IDR/share,
from 8.95 IDR/share in 2013. Meanwhile, in 2017,
the value of BJTM’s EPS tended to increase by
22.25 IDR/share (77.51 IDR - 55.26 IDR) when
compared to 2013 which was only 55.26 IDR/share.
Figure 6: Return on Equity (ROE) Movement in the period
from 2013 to 2017.
Figure 7: Earning Per Share (EPS) Movement from 2013
to 2017.
Research on the valuation of intrinsic stock value
was carried out by several previous researchers. The
results of previous studies indicated that intrinsic
shares in the market using several valuation methods
could provide different conditions that are
overvalued or undervalued. The research also
showed that stock prices in the market do not
necessarily reflect their fair value (intrinsic), as
stated by:
Gupta (2019) researched assessment companies
in three sectors: car, banking, and steel, use simple
linear regression, taking into account economic,
fiscal and financial policies. This research was
carried out by applying regularization machine
learning techniques. Ridge regression, ASSO, and
clean elastic techniques are used to underline these
similarities multiples of assessment. This regulator
was tested on Indian data listed companies that
cover twelve years from TA 07 to TA 2018 and four
multiples identified for research are 1) prices for
income (P/E), 2) prices for sales (P/S), 3 before the
interest tax depreciation before the firm's value of
profit and amortization price (EV/EBIDTA) and 4)
to book value (P/BV). The findings are based on
square root errors and learning curves, which
strengthens the least predictive error at P/S for the
automotive sector, EV/EBIDTA for the steel sector
and P/BV for the banking sector. The conclusion is
that specific sets of variables can be used to assess
effectively company valuation (multiple
assessments). This research contributes to market
literature that emerges by evaluating key multiples
that drive the sector to apply non-traditional
regression techniques.
Zemba and Hendrawan (2018) discuss valuations
in the healthcare sector where opportunities for
investment in the health sub-sector business in
Indonesia are still wide open, especially in the
hospital business. There are not many choices for
hospital business investment in Indonesia, and there
are only four issuers, MIKA, SAME, SILO, SRAJ.
The four will be evaluated using DCF and Relative
ICIB 2019 - The 2nd International Conference on Inclusive Business in the Changing World
96

Evaluation, to find out the fair value. This fair value
becomes essential when investors want to execute
investment decisions, which indeed they do not want
to buy shares if the price is too high, also worrying if
buying shares whose prices have dropped. Too low
(undervalued) or too expensive (overvalued) the
price of a stock, of course, there must be a
comparison price called fair value, and this study
aims to find the fair price in question. Financial
report data is collected from the four issuers during
the five years of the 2013-2017 period as building
materials for assumptions, calculated by the ratio of
income and costs - the cost is prioritized using
geometric means, if not possible then use arithmetic.
The result is to make the next five years projection
for the period 2018-2022. The projection aims to
explore the potential of free cash flows that can be
generated by the company, that is the basis of the
valuation of the DCF method. Unfortunately, three
out of four issuers always suffer losses, let alone
having the remaining free cash flow, to finance
operations in the years that are running even though
they rely on debt. If this is the case, the DCF method
is no longer relevant because the equity value is
negative, the impact of the PER is also negative.
This makes it difficult to analyze because the stock
price is the slightest if the PER and FCFF are
negative, the valuation is overvalued. Only MIKA
whose financial performance can be processed
according to the rules of valuation theory. In the
optimistic scenario, moderate, pessimistic has been
designed, MIKA does not have a significant
difference in analysis results, all scenarios led to
overvaluation from the perspective of DCF and
undervalued when using Relative Valuation.
Aydin (2017), researched with the aim of
examining various valuation methods that can be
used as considerations in conducting mergers and
acquisitions, focusing on weaknesses and strengths.
The main focus of this study is that the DCF method
uses several scenarios, namely: pessimistic,
moderate and optimistic, to reduce estimation errors.
The researcher suggested that in carrying out
mergers and acquisitions must use many valuation
methods and give weight to each method taking into
account the conditions of the company, state, and
market.
Neaxie and Hendrawan (2017), research with the
aim of estimating the fair price valuation of
telecommunications companies listed on the Stock
Exchange using the Discounted Cash Flow (DCF)
method with the approach of Free Cash Flow to
Firm (FCFF) and Relative Value. The results of the
study indicated that by using the DCF method of the
FCFF approach on an optimistic scenario, the fair
value of TLKM was undervalued, the fair value of
ISAT was in overvalued conditions, and the EXCL
fair value was in an undervalued condition. In the
moderate scenario, TLKM's fair value was
undervalued, ISAT's fair value was overvalued, and
EXCL's fair value was overvalued. In the pessimistic
scenario, TLKM's fair value was overvalued, ISAT's
fair value was overvalued, and EXCL's fair value
was overvalued. Meanwhile, using relative valuation
with the PER approach, TLKM's fair value was
undervalued, ISAT's fair value was overvalued, and
EXCL's fair value was undervalued. Then, with the
PBV approach, TLKM's fair value was in an
overvalued condition, ISAT's fair value was in an
overvalued condition, and EXCL's fair value was in
an undervalued condition. Furthermore, with
multiple EBITDA approaches, TLKM's fair value
was in an overvalued condition, ISAT's fair value
was in an undervalued condition, and EXCL's fair
value was undervalued.
Vuuren (2016) conducted a study to assess
property companies using the DCF profit method.
This study highlights the advantages and
disadvantages of the DCF profit method as a review
of the 1-year capitalization technique and the cost
approach. In both cases, the DCF profit method is
considered superior. Three particular improvements
for DCF's profit method is: The first is that business
revenue must be estimated based on a weighted
probability approach which will reduce Alpha
requirements in the WACC calculation. The second
is to potentially adopt a combined aggregate and
valuation approach in Indonesia determining
hypothetical rent solutions which are always
debatable points in practice. By converting leasing
the market from similar properties, increasing
subject, factories, and machinery business income to
a measurement unit per square meter, it is possible
to anchor and combine hypothetical rent separation
percentage. The third is an increase in the
determination in the capitalization formula
approach. When determined, it must be done by
multiplying hypothetical rent separation from
income the level of business growth or other income
growth rates depends on the financial model
business.
Kramna (2014), conducted a study to determine
the main factors in discounted cash flow assessment,
using sensitivity analysis. This is important in
business valuation, not only because of mergers and
trends acquisition but also related to the
identification of sources of economic value creation.
The results show that growth rates remain and the
Share Valuation of Indonesian Regional Development Bank using Free Cash Flow to Equity and Relative Valuation Methods
97

weighted average cost of capital is a very important
input in company rating. While the aspect of the
exchange rate only has a small impact on the value
of the company. Noteworthy is the estimation of
lasting growth the level must be in a reasonable
range, taking into account the nominal GDP growth
rate
country.
Gottwald (2012), researched with the aim of
evaluating stocks in investment decisions using the
P/E ratio method. This ratio is used in the
framework of the fundamental analysis profit model.
In realization empirical analysis, tests selected and
index determinations used for statistical assessment
of the relationship between the P/E ratio and stock
price. Based on the results indicate that the P/E ratio
method is suitable for many investors in conducting
financial analysis, assessing the fair / intrinsic price
of shares, and investing.
Kahneman (1990), conducted a study with a
Contingency Assessment Method (CVM) to
examine the proposition that CVM results are
susceptible to embedding effects that can make most
of them arbitrary and consequently useless for
practical purposes and to advance interpretations of
what insiders do answer CVM questions. The main
result of the first study is that willingness to pay is
almost the same for narrowly defined goods
(equipment and rescue personnel) and for categories
that are far more inclusive (all disaster preparedness,
or even all environmental services).
Correspondingly, the values specified for more
specific items vary in the order of magnitude
depending on the depth of insertion in the category
that the PAPs were initially assessed. This result
seems to cancel the basic assumption of CVM: that
standard value theory applies to the steps obtained
by this method. Because the choice of inclusion
structure is arbitrary, the estimated value obtained
from the CVM survey will change.
The equation of several previous studies and this
research is that they both conduct a calculation
analysis on the intrinsic value of stock prices.
Whereas, the difference is in the object of research
and the method/approach used.
According to Damodaran (2012), in general,
there are three approaches to valuing an asset,
namely: Discounted Cash Flow (DCF) Valuation,
Relative Valuation, and Contingent Claim
Valuation. Each of the three approaches has a
variety of different valuation approaches.
Based on the phenomenon where there is a
fluctuating stock price of banking sector companies
in Indonesia from year to year, and there is a
significant return value at a certain period and from
the results of previous studies which show that stock
prices do not reflect the actual value (intrinsic
value), the researcher intends to conduct research on
the valuation of fair prices (intrinsic value) from the
shares of BJBR, BJTM and BEKS using the
Discounted Cash Flow (DCF) method with the Flow
to Equity (FCFE) approach and methods Relative
Valuation with Price to Earning Ratio (PER)
approach and Price Book Value (PBV) in an
optimistic, moderate and pessimistic scenario.
2 LITERATURE REVIEW
2.1 Valuation
According to Damodaran (2012), valuations play a
crucial role in many financial fields, both in
corporate finance, in mergers and acquisitions, and
portfolio management. The value of a company is
influenced by business conditions, both macro
conditions and micro conditions of the company.
Macro conditions, among others: the political,
economic, and social conditions of the country
where the company conducts business activities.
While micro conditions are the industrial conditions
of the company. In general, there are 3 (three)
approaches to valuing an asset, namely: Discounted
Cash Flow (DCF) Valuation, Relative Valuation,
and Contingent Claim Valuation.
2.2 Value of The Firm
Company value is an investor's perception of the
level of success of a company in managing its
current resources, linked to the company's stock
price. Demand and offers from investors influence
the formation of stock prices. High stock prices
make the value of the company high, and it can
increase market confidence not only in the
company's current performance but also in the
company's prospects in the future. Nevertheless, the
stock price in the market does not necessarily reflect
the real price of the company.
2.3 Method of Discounted Cash Flow
Evaluation
Discounted Cash Flow (DCF) method is a stock
valuation method using the time value of money
concept (Damodaran, 2012). The theory used as the
basis of this method is the fair value of shares
ICIB 2019 - The 2nd International Conference on Inclusive Business in the Changing World
98

(present value) which is all money flowing in the
company in the future (future value) when
discounted
The DCF valuation method has 3 (three)
variations in the calculation approach that can be
used to analyze stock prices according to the needs
of each analysis. The three variations are (1)
Dividend Discounted Model; (2) Free Cash Flow to
Equity; and (3) Free Cash Flow to Firm (Neaxie and
Hendrawan, 2011).
Free Cash Flow to Equity (FCFE) is an
operational net cash flow available after the
company fulfills all debt obligations, capital
expenditures, and working capital, which is
distributed to equity holders. According to
Damodaran (2012), estimating a company's cash to
be returned to shareholders can be done through
several stages. The first stage, each investment
expenditure issued must be reduced first with the
company's net income so that it can represent cash
outflows, and then depreciation is added again
because accounting both of these are not spending
cash but non-cash cash. The second stage, the
increase in working capital will reduce the cash flow
available to shareholders so that only non-cash
working capital is considered. The last stage is
where the company has new debtor has been paid in
the company's cash flow. So the payment of the
principal debt represents cash out while the issuance
of new debt will represent the incoming money.
FCFE can be calculated by using the following
formula:
FCFE = Net Profit - (Capital-Depreciation Expenditures)
-(Change in Non-Cash Working Cap.) (1)
Determining the discount rate requires an in-
depth analysis of the company's financing structure
and current market conditions. Neaxie and
Hendrawan (2017) suggest that the discount rate is
the expected return by investors and creditors on
funds invested in the company. The discount rate
used in FCFE is called the Weighted Average Cost
of Capital (WACC). Company value (value of the
firm) can be calculated using the WACC formula to
discount FCFF values, with the following formula
(Damodaran, 1996: 242):
t
t
t
After determining the present value of cash flows
obtained from the period and specific scenarios
(FCFE) and also from the terminal value discounted
for the present value, then the two present values are
added together to give the firm value or equity value
(Steiger, 2008). The formula for calculating
company value is to use FCFE whose growth has
been stable at certain years, and after that, it grows
constant at the perpetual growth rate of g, which is
as follows (Damodaran, 1996: 242):
t
t
t
+
n
TV = FCFE
n+1
/ (WACC - g
n
)
Weighted Average Cost of Capital (WACC) is
the overall capital cost of a company that reflects a
combination of costs or weighting costs of all
funding sources used by the company. Minor
changes to the WACC will result in major changes
in company value. The WACC is calculated by
weighting the source of capital according to the
company's financial structure and then multiplying it
by cost. The WACC formula is as follows:
WACC = (Comp. of Equity*rate of equity) +
((Comp. of Debt*rate of debt)*(1-tax))
The factors contained in the WACC are
explained as follows:
2.3.1 Cost of Equity
Cost of Equity is the rate of return expected by the
shareholders (equity) of their investment in the
company. Equity costs are calculated by using the
approach from the Capital Asset Pricing Model
(CAPM). According to this method, the return
expected by investors is determined by an analysis
of the risk-free rate, risk premium, and beta for
assets. Beta measures changes in stock prices
concerning the overall stock market. This reflects
market risk.
2.3.2 Cost of Debt
Cost of Debt is the interest rate that must be paid by
the company for its debt or external capital. The
most influencing factor for Cod is the company's
credit rating. The difference between the risk-free
interest rate and the interest rate that companies pay
to borrow money is called credit spread. Credit
spread does not only depend on the creditworthiness
of the company (rating) but also depends on market
conditions.
2.4 Relative Valuation Method
Relative valuation, or often called the market
(2)
(5)
(4)
(3)
Share Valuation of Indonesian Regional Development Bank using Free Cash Flow to Equity and Relative Valuation Methods
99

valuation method, is often used as a reference to
assess capital market players because the calculation
method is quite simple with not many input
variables. The Relative Valuation method also in
real terms reflects the view of the market.
According to Damodaran (2012), the advantages
of the Relative Valuation model are also its
weaknesses. First, ease in Relative Valuation can be
put together, attracting several similar groups of
companies, can also produce estimates of
inconsistent values where key variables such as risk,
growth, or potential cash flows are ignored. Second,
the fact that multiples reflect the market atmosphere,
which also illustrates that using the Relative
Valuation method to assess an asset can produce a
too high value when the market overestimates
similar companies, or vice versa when the market
underestimates similar companies. Third, there is
room for bias in all valuation methods, the lack of
transparency regarding the underlying assumptions
in the Relative Valuation method makes it
vulnerable to manipulation. The Relative Valuation
method used in this study is the Price Earning Ratio
(PER) approach, and Price Book Value (PBV).
2.4.1 Price Earning Ratio (PER) Approach
Another alternative in conducting valuations to
calculate the intrinsic value of a stock or
fundamental value is to use the profit value of the
company (earnings) (Jogiyanto, 2010). Estimates of
the intrinsic value of shares in a company's analysis
can be determined using 2 (two) components of
relevant information from the company, namely:
Earning Per Share (EPS) and earnings multiplier.
Thus, the expected function of EPS and the amount
of PER of the company's shares are the intrinsic
value of a stock. The formula for determining the
intrinsic value of shares through PER is as follows:
Po = EPS estimation x PER
If the intrinsic value of the stock has been
obtained by the formula above, the next step is to
compare the intrinsic value of the stock with the
market price.
2.4.2 Price to Book Value (PBV) Approach
One alternative approach to determine the value of a
stock with the Relative Valuation method is to use
the relationship between stock market prices and
book value per share (Damodaran, 2012).
Theoretically, the market value of stock must
describe the value of the book. The formula for Price
Book Value (PBV) is as follows:
PBV =
3 METHODOLOGY
The research conducted is verification research
because it aims to test a theory or the results of
previous research. Based on the purpose, this is
descriptive research. Descriptive research is used to
ascertain and explain the characteristics of variables
in a situation. Descriptive methods offer researchers
a profile that aims to describe aspects related to
interesting phenomena, such as individuals,
organizations, industry-oriented, or other
perspectives (Sekaran and Bougie, 2013). Based on
the involvement of researchers, this is a study in
which the researcher does not manipulate or
intervene. This is because researchers only take
secondary data that already exists without making
changes to it. Based on the unit of analysis, this
research is included in group research because it
only examines 1 (one) group, namely shares in the
category of Regional Development Bank (BPD)
companies listed on the Indonesia Stock Exchange
in 2018. Whereas, based on the time of
implementation, this is a cross-sectional study, in
which the data is collected only once, perhaps over a
period of months or years, to answer research
questions (Sekaran and Bougie, 2013).
This research uses samples with the purposive
sampling method. Purposive Sampling is a method
of selecting samples with specific focus, criteria, and
objectives so that samples can be used to solve
problems well (Sekaran and Bougie, 2013). The
sampling criteria in this study are Regional
Development Banks (BPD) listed on the Indonesia
Stock Exchange and BPD with audited financial
statements for at least the last 5 (five) years.
The type of data used by the data provider is
obtained from the official sample company website
or the Indonesian Stock Exchange website, data
regarding the company's stock price that published.
The data analysis method that the author uses in
this study is quantitative analysis, with raw data in
the form of audited financial statements for the past
5 (five) years, the 2013 period. 2017. The financial
statements used include Financial Position Report/
Balance Sheet, Profit, and Loss Statement, and Cash
Flow Statement.
(6)
(7)
ICIB 2019 - The 2nd International Conference on Inclusive Business in the Changing World
100

The initial steps taken on financial report data,
with the help of Microsoft Excel software, are to
conduct a historical analysis of company
performance which includes: revenue growth,
Earning After Tax (EAT) margin, working capital
margin, and depreciation and amortization margin,
then revenue projection and The EAT projection is
calculated. The next step is to calculate the cash
flow using the DCF method (FCFE), calculate the
capital/WACC cost, calculate the Terminal Value
and discount the FCFE value and Terminal Value as
the basis for calculating Enterprise Value, Equity
Value and intrinsic value / fair price of the
company's shares.
The fair price or intrinsic value obtained from the
calculation using the FCFE method is then compared
with the results of calculations using the Relative
Valuation (PER and PBV) method in the
scenario/condition: optimistic, moderate and
pessimistic. The fair value of shares is used as a
basis for decision making by investors.
4 ANALYSIS AND DISCUSSION
Based on calculations and analyzes that have been
done using the Discounted Cash Flow method Free
Cash Flow to Equity (FCFE) and Relative Valuation
methods with the Price to Earning Ratio (PER) and
Price Book Value (PBV) approach with 3 (three)
scenarios, namely: Pessimistic scenarios, moderate
scenarios, and optimistic scenarios, the intrinsic
value of each company is obtained. The calculation
results from Relative Valuation with the PER and
PBV approaches will validate the results of the
calculation of intrinsic values with the FCFE
approach. It is valid if the results of the Relative
Valuation calculation are in the range of PER and
industrial PBV.
Based on Table 1, it can be seen that in the
pessimistic scenario, the intrinsic value of BJBR and
BJTM shares using the DCF method using the FCFE
approach is overvalued because the stock price on
January 2, 2018, is higher than the calculation of its
intrinsic value. Meanwhile, the intrinsic value of
BEKS shares has been undervalued because the
stock price on January 2, 2018, is lower.
The result of the calculation of the intrinsic value
of BJBR in the pessimistic scenario is 1,215.52 IDR
while the price on January 2, 2018, is 2,360.00 IDR,
a difference that is quite far between the intrinsic
value of BJBR and the stock price in the market is
probably due to the estimated lower BJBR revenue
growth in the next 5 (five) years projection of
7.14%. Whereas, BJTM has an intrinsic value of
126.80 IDR, which on January 2, 2018, BJTM share
price is 720.00 IDR, the difference between the
intrinsic value in the pessimistic scenario and the
stock price in the market is probably caused by the
estimated revenue growth average BJTM is low in
the next 5 (five) years projection, which is 9.96%.
Also, BEKS has an intrinsic value of 55.67 IDR,
which on January 2, 2018, the share price of BEKS
is 50.00 IDR. BEKS's intrinsic value is slightly
above the share price.
Table 1: Results of the Calculation of Intrinsic Values.
Company
Scenario
Intrinsic
Value
Stock
Price
2
nd
Jan
2018
Result
BJBR
Pessimistic
1,215.52
2,360
Overvalued
Moderate
1,387.73
Overvalued
Optimistic
1,967.67
Overvalued
BJTM
Pessimistic
126.08
720
Overvalued
Moderate
126.32
Overvalued
Optimistic
126.44
Overvalued
BEKS
Pessimistic
55.67
50
Undervalued
Moderate
68.03
Undervalued
Optimistic
73.25
Undervalued
Table 2: Results of Calculation of Relative Valuation.
Company
Scenario
PER
PER
IDX
PBV
PBV
IDX
BJBR
Pessimistic
7.40
-322.14
1.17
0.32
Moderate
8.37
24.59
1.33
1.71
Optimistic
11.67
141.62
1.89
4.8
BJTM
Pessimistic
1.58
-322.14
0.24
0.32
Moderate
1.58
24.59
0.24
1.71
Optimistic
1.57
141.62
0.24
4.8
BEKS
Pessimistic
22.11
-322.14
4.64
0.32
Moderate
26.35
24.59
5.67
1.71
Optimistic
27.80
141.62
6.10
4.8
Based on the results of the calculation of the
intrinsic value in the pessimistic scenario, the BJBR
and BJTM stock prices are overvalued. Thus,
investors are recommended to make a sale or not
make a purchase of these shares. In contrast to
BEKS shares which are in undervalued conditions,
investors are recommended to buy BEKS shares.
The results of the PER calculation in the BJBR
pessimistic scenario are 7.40 times, BJTM is 1.58
times, and BEKS is 22.11 times. While quarterly
IDX data (Q1 2018) shows that the average PER
value of banking companies is 24.59 times, with the
lowest PER value for BJTM of 1.58 times and the
highest PER value for BEKS of 22.11 times. This
shows that the results of the research calculations are
in the range of the existing PER in the market.
Furthermore, the PBV calculation results with a
pessimistic scenario show that the PBV value for
Share Valuation of Indonesian Regional Development Bank using Free Cash Flow to Equity and Relative Valuation Methods
101

BJBR is 1.17 times, the PBV value for BJTM is 0.24
times, and the PBV value for BEKS is 4.64 times.
Meanwhile, quarterly IDX data (Q1 2018) shows
that the average PBV value of banking companies is
1.71 times, with the lowest PBV value for BJBR of
1.17 times and the highest PBV value for BEKS of
4.64 times. This shows that the results of research
calculations are in the PBV range in the market.
Based on the results of valuation calculations in
the pessimistic scenario using the Relative Valuation
PER approach, the BJTM PER value is the lowest
when compared to BJBR and BEKS, with a PER
value of 1.58 times, which means that if we invest
BJTM shares then the return time on capital or the
Break Event Point (BEP) is around 1 year 6 months,
faster than BJBR and BEKS. So, investors are
advised to choose BJTM shares rather than BJBR
and BEKS shares. Meanwhile, companies
recommended increasing their earnings per share if
they want a low PER value.
Meanwhile, through the PBV approach, it was
found that the BJTM stock price was lower than
BJBR and BEKS, which was equal to 0.24 times.
This means that the BJTM stock price is valued at
0.24 times compared to its intrinsic value.
Meanwhile, BJBR share price is valued at 1.17 times
compared to its intrinsic value, and BEKS share
price is valued at 4.64 times compared to its intrinsic
value.
In the moderate scenario, the intrinsic value of
BJBR shares is IDR 1,387.73, while on January 2,
2018, the price of BJBR shares is IDR 2,360, so that
it can be said that BJBR stock price is overvalued
compared to its intrinsic value. The considerable
difference between the intrinsic value and the stock
price in the market in the moderate scenario is
probably due to the low average estimate of BJBR
revenue development in the next 5 (five) years
projection of 8.08%. The intrinsic value of BJTM is
126.32 IDR, whereas on January 2, 2018, the share
price of BJTM is 720.00 IDR, so the BJTM stock
price is overvalued when compared to its intrinsic
value. The intrinsic value of BEKS is 68.03 IDR,
while on January 2, 2018, the price of BEKS shares
is 50.00 IDR, so it can be said that BEKS stock price
is undervalued when compared to its intrinsic value.
Based on the results of the intrinsic value
calculation in the moderate scenario, the result is
that the BJBR and BJTM stock prices are
overvalued, so investors can sell or not buy BJBR
and BJTM shares. Meanwhile, BEKS is
undervalued, which means investors are
recommended to buy BEKS shares.
In the moderate scenario, the results of the PER
PER BJBR are 8.37 times, the PER value of BJTM
is 1.58 times, and the BEKS is 26.35 times.
Meanwhile, quarterly IDX data (Q1 2018) shows
that the average PER value of banking companies is
24.59 times, with the lowest PER value for BJTM of
1.58 times and the highest PER value of BEKS is
26.35 times. This shows that the results of the
calculation of the study are in accordance with the
range PER in the market.
Furthermore, the results of the study with a
moderate scenario show that the BJBR PBV value is
1.33 times, the BJBR PBV value is 0.24 times and
the BEKS PBV value is 5.67 times. Meanwhile,
quarterly IDX data (Q1 2018) shows that the
average PBV value of banking companies is 1.71
times, with the lowest PBV value for BJTM of 0.24
times and the highest PBV value of BEKS of 5.67
times. This shows that the results of research
calculations are partly in PBV market range and
some are outside the market range, in this case, the
value of the BEKS PBV is a little (not significant)
above the maximum range.
Based on the results of the valuation calculation
in the moderate scenario using the Relative
Valuation PER approach, it was found that the
BJTM stock price was lower than BJBR and BEKS,
with a PER value of 1.58 times. This means that if
we invest BJTM shares, the return time on capital
(BEP) required is 1 year and 6 months, faster than
BJBR and BEKS. So, investors should choose
BJTM shares rather than BJBR and BEKS shares.
While the advice for companies if they want a low
PER value is to increase their earnings per share
from their shares.
With the PBV approach, the BJTM stock price is
also lower compared to BJBR and BEKS, namely
BJTM PBV of 0.24 times, this means that the BJTM
stock price is valued at 0.24 times compared to its
intrinsic value. Meanwhile, BJBR stock price is
valued at 1.33 times compared to its intrinsic value,
and BEKS share price is valued at 5.67 times
compared to its intrinsic value, so investors should
choose BJTM shares instead of BJBR and BEKS
shares. As for companies, it is recommended that
they should increase the book value of the company
by increasing the amount of equity so that the value
of the PBV drops.
In the optimistic scenario, the intrinsic value of
BJBR shares is 1,215.52 IDR, while on January 2,
2018, the BJBR stock price is 2,360.00 IDR, so it
can be said that BJBR stock price is overvalued
compared to its intrinsic value. The significant
difference between intrinsic value and stock price in
ICIB 2019 - The 2nd International Conference on Inclusive Business in the Changing World
102

the optimistic scenario in the market is due to the
low estimate of the average BJBR revenue growth in
the next 5 (five) year projections of only 9.96%. The
intrinsic value of BJTM is 126.44 IDR, while the
stock price on January 2, 2018, is 720.00 IDR, so it
can be said that BJTM stock price is undervalued
when compared to its intrinsic value. The difference
between the intrinsic value in the optimistic scenario
and the stock price in the market is because the
average estimate of revenue growth is positive at
5.15% in the next 5 (five) year projections. The
intrinsic value of BEKS is 73.25 IDR, whereas on
January 2, 2018, the price of BEKS shares was
50.00 IDR, so it can be said that BEKS 'share price
was undervalued when compared to its intrinsic
value. The difference between intrinsic value and
stock price in an optimistic scenario on the market is
due to the good performance of the company with
Revenue Projection of 9.96%.
In this optimistic scenario, it is recommended
that investors sell shares or not buy BJBR and BJTM
shares because the stock price in the market is
overvalued while BEKS shares are recommended
that investors buy shares or retain existing shares
because the stock price in the market is consistently
undervalued. Furthermore, companies are advised to
maintain stock prices in the market so that they are
not too far from their intrinsic value, so companies
need to improve their performance by increasing
revenue and growing revenue and by making
efficiency on all types of company expenses and
costs both OPEX and CAPEX.
In the optimistic scenario, the results of the study
show that BJBR PER value is 11.67 times, BJTM
PER value is 1.57 times, and BEKS is 27.80 times.
While quarterly IDX data (Q1 2018) shows that the
average PER value of banking companies is 24.59
times, with the lowest PER value for BJTM of 1.57
times and the highest PER value of belongs to BEKS
of 27.8 times. This shows that the results of the
research calculations are in the PER range of the
market.
Overall, BEKS has a PER value that is quite
large or above average for several scenarios, namely
in the pessimistic scenario of 22.11 times, in the
moderate scenario 26.35 times and in the optimistic
scenario 27.8. Meanwhile, the industry average PER
is 24.59 which is still within the industry range.
Furthermore, the results of an optimistic scenario
show that the BJBR PBV value is 1.89 times, the
BJTM PBV value is 0.24 times, and the BEKS PBV
value is 6.10 times. Meanwhile, quarterly IDX data
(Q1 2018) shows that the average PBV value of
banking companies is 1.71 times, with the lowest
PBV value for BJTM companies by 0.24 times and
the highest PBV value for BEKS companies at 6.10
times. This shows that the results of the calculation
in the scenario are optimistic, some PBV is in the
market range (BJBR and BJTM), and some are
outside the market range (BEKS).
Based on the results of the valuation calculation
in the optimistic scenario using the Relative
Valuation PER approach, it was found that the
BJTM stock price was lower than BJBR and BEKS,
where the PER value of BJTM which was smaller
than BJBR and BEKS had a PER value of 1.58
times. This means that if we invest in BJTM shares,
the return time needed (BEP) is one year six months,
faster than BJBR and BEKS. So, investors should
choose BJTM shares rather than BJBR and BEKS
shares. While the advice for companies if they want
a low PER value is to increase their earnings per
share from their shares.
Meanwhile, if using the PBV approach, the
BJTM stock price obtained is also lower compared
to BJBR and BEKS, where the value of BJTM PBV
which is smaller than BJBR and BEKS is 0.24 times.
This means that the BJTM stock price is valued at
0.24 times compared to its intrinsic value.
Meanwhile, BJBR share price is valued at 1.89 times
compared to its intrinsic value, and BEKS share
price is valued at 6.10 times compared to its intrinsic
value. So it is recommended for investors to choose
BJTM shares instead of BJBR and BEKS shares.
Meanwhile, companies are advised to increase their
book value by increasing the amount of equity, so
that the value of their PBV falls.
5 CONCLUSIONS
5.1 Optimistic Scenario
Using the FCFE method, the intrinsic value / fair
price of BJBR and BJTM shares is overvalued when
compared to the market price. While the intrinsic
value / fair price of BEKS shares is in an
undervalued position. The calculation results are
validated by the Relative Valuation method
approach with the PER (Price Earning Ratio) and
Price Book to Value (PBV) approaches. The results
are generally included in the industry range in
accordance with data in IDX Q1 2018. Although the
value of PBV of BEKS shares is slightly above the
industry range, it is not significant. Thus, investors
should sell or not buy BJBR and BJTM shares and
are advised to buy BEKS shares.
Share Valuation of Indonesian Regional Development Bank using Free Cash Flow to Equity and Relative Valuation Methods
103

5.2 Moderate Scenario
Using the FCFE method, the intrinsic values / fair
prices of BJBR and BJTM shares are overvalued
when compared to the market price. Meanwhile, the
intrinsic value / fair price of BEKS shares is in an
undervalued position. The results of the calculation
are validated by the Relative Valuation method
approach with the PER (Price Earning Ratio) and
Price Book to Value (PBV) approaches. The results
are still in the industry range according to the data in
IDX Q1 2018. Although the value of the BEKS
stock PBV is slightly above the industry range, it is
not significant. The result is a suggestion for
investors to sell or not buy BJBR and BJTM shares,
and better buy BEKS shares.
5.3 Pessimistic Scenario
Using the FCFE method, the intrinsic value / fair
price of BJBR and BJTM shares are overvalued
when compared to the market price. While the
intrinsic value / fair price of BEKS shares is in an
undervalued position. The calculation results are
validated by the Relative Valuation method
approach with the PER (Price Earning Ratio) and
Price Book to Value (PBV) approaches. The results
are still in the industry range according to the data in
IDX Q1 2018. With these results, investors should
sell or not buy BJBR and BJTM shares, and better
buy BEKS shares.
The result of this research shows that the relative
valuation method can be used as a way to validate
the intrinsic value of stock.
6 RECOMMENDATIONS
6.1 For Further Research
1. To carry out further research using historical data
for 10 (ten) years, so that the growth projections
used are more representative.
2. To carry out intrinsic analysis of the stock prices
of the three companies (BJBR, BJTM, and
BEKS) in 2019 and then to validate some of the
estimates/ assumptions that have been made in
this study.
3. To conduct research by adding primary data in
the form of direct information (interviews) with
company management, related to company plans
and strategies going forward in increasing
company growth, in order to maximize the
assumptions of researchers in conducting
forecasting.
4. To calculate the intrinsic value or fair price of
the company with different valuation methods,
such as the Dividend Discount Model, so that the
results can be used as a comparison and
additional information for investors.
6.2 For Investors
The results of this study can be a reference and
investment consideration for investors. Based on the
results of this study, the authors suggest that
investors BJBR, BJTM, and BEKS, at the time this
research was conducted, are the right conditions to
sell their shares because based on the comparison of
the intrinsic value of the stock with market prices is
in an overvalued position. Likewise, the results of
validation with the PER and PBV values, the
majority support the decision to sell shares.
6.3 For the Companies
This research is carried out by the author objectively
for academic and practical purposes. The results of
this study are expected to provide constructive input
for sample companies and especially Regional
Development Banks (BPD) in Indonesia to improve
company performance by building stronger
fundamentals, for example increasing revenue
through escalating the number of productive credit
distribution that has gone through sufficient risk
assessment to avoid increasing Non Performing
Loans (NPL). In addition, it is necessary to improve
corporate governance to provide a sense of security
for investors who entrust their investments, as well
as being a trigger for other BPDs to participate in
registering their shares on the Indonesia Stock
Exchange. The good corporate performance will
attract the (prospective) investors to invest their
capital in the BPD.
REFERENCES
Aydin, N., 2017. Mergers and Acquisition: A Review of
Valuation Methods. International Journal of Business
and Social Science.
Damodaran, A., 2012. Investment Valuation, John Wiley
& Sons Inc. United States of America, 3
rd
edition.
Gottwald, R., 2012. The Use of the P/E Ratio to Stock
Valuation. GRANT Journal.
Gupta, F.,2019. Evaluating the Accuracy of Valuation
Multiples on Indian Firms Using Regularization
Techniques of Penalized Regression. Theoretical
Economics Letters.
ICIB 2019 - The 2nd International Conference on Inclusive Business in the Changing World
104

Kahneman, D., Knetsch, J.L., 1990. Valuing Public
Goods: The Purchase of Moral Satisfaction. Journal of
Environmental Economics and Management 22.
Kramna, E., 2014. Key Input Factors for Discounted Cash
Flow Valuations. Wseas Transactions on Business and
Economics.
Neaxie, L.V., Hendrawan, R., 2017. Stock Valuations in
Telecommunication Firms: Evidence from Indonesia
Stock Exchange. Journal of Economic and
Management Perspectives.
Sekaran, U., Bougie, R., 2013. Research Methods for
Business: A Skill-Building Approach, Wiley. New
York, 6
th
edition.
Vuuren, D.J., 2016. Valuing Specialized Property Using
the DCF Profits Method. Journal of Property
Investment and Finance.
Zemba, S., Hendrawan, R., 2018. Does Rapidly Growing
Revenues Always Produce An Excellent Company’s
Values?. DCF & PE Valuation Assessment on
Hospital Industry. ISCLO.
Share Valuation of Indonesian Regional Development Bank using Free Cash Flow to Equity and Relative Valuation Methods
105
