
Stock Valuations in Cement Companies: Evidence from Indonesia
Stock Exchange
Riko Hendrawan, Rijikan
and Hiro Tugiman
Telkom University, Jalan Geger Kalong Hilir, Bandung, Indonesia
Keywords: Cement Companies, Discounted Cash Flow, Relative Valuation.
Abstract: This research aimed to assess the fair value of stock price at Cement Companies listed in Indonesia Stock
Exchange using Discounted Cash Flow (DCF) with Free Cash Flow to Firm (FCFF) approach to calculate the
value of a company and Relative Valuation methods with Price Earning to Ratio and Price Book to Value
approach to validate DCF result. The samples of this research are Indocement Tunggal Prakarsa (INTP),
Holcim Indonesia (SMCB) and Semen Baturaja (SMBR) which are the big three cement company. The
research data were derived from historical data 2013 – 2017 which considered as reference for projection
years 2018 – 2022 involving three scenarios namely pessimistic, moderate and optimistic scenario and the
value of the research compared within market price on January 2, 2018. Findings from this research showed
that using DCF FCFF fair value on INTP has overvalued in all scenarios, for SMCB and SMBR have
overvalued in the pessimistic scenario but undervalue in moderate and optimist scenarios. Furthermore, in
relative valuation method within PER and PBV, the research is within the industry range that means the result
of a calculation is proper. The conclusion of this research is to recommend selling INTP shares, buying SMCB
and SMBR shares.
1 INTRODUCTION
Along with the growth of the cement industry in
supporting development in the infrastructure sector in
Indonesia. A large number of investors and business
opportunities creates business competition in the
cement industry and the impact on fluctuations in
financial performance and share prices of each
company.
In the context of the phenomenon of stock price
fluctuations, many investors use it in the short term
by buying a lower stock price and selling it when the
stock price is high. The decision to buy shares based
on stock prices only can lead to a bad decision
because it does not value the company as a whole and
over a more extended period.
The fluctuations in stock price performance and
the return value of cement companies in Indonesia
stock exchange namely Indocement Tunggal
Prakarsa (INTP), Holcim Indonesia (SMCB) and
Semen Baturaja (SMBR) which are the determinants
in this study are as follows:
Based on Figure 1 the daily stock price of INTP
tends to fluctuate followed by fluctuations in the
return pattern. In a certain period, there is a significant
daily return rate, with the lowest occurring on January
16, 2015, amounting to -10.8% and the highest
occurring on October 25, 2017, at 11.9%. The
historical fluctuation value is an interesting thing to
see if the pattern can be used as a reference for
forecasting or making new assumptions and
normalizing existing patterns and then determining
the fair value of the company.
Figure 1: INTP Stock Price and rate return (Jan 2013-Dec
2018).
Based on Figure 2, it can be seen that the trend of
the decline in SMCB stock prices is not directly
proportional to the return pattern. The lowest growth
occurred on June 28, 2013, amounting to -11.6% and
the highest occurred on August 2, 2016, at 12.6%.
Hendrawan, R., Rijikan, . and Tugiman, H.
Stock Valuations in Cement Companies: Evidence from Indonesia Stock Exchange.
DOI: 10.5220/0008427400450054
In Proceedings of the 2nd International Conference on Inclusive Business in the Changing World (ICIB 2019), pages 45-54
ISBN: 978-989-758-408-4
Copyright
c
2020 by SCITEPRESS – Science and Technology Publications, Lda. All rights reserved
45
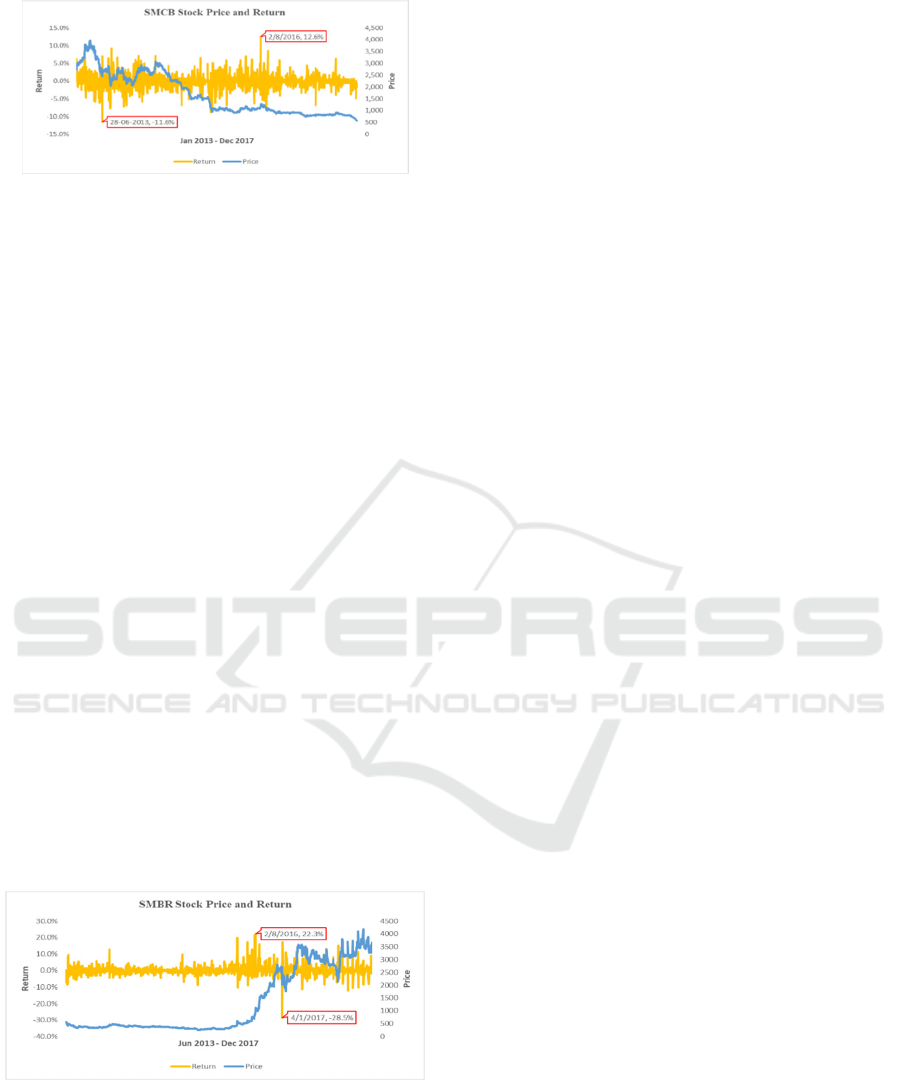
Figure 2: SMCB Stock Price and rate return (Jan 2013-Dec
2018).
Based on Figure 3, the daily price of SMBR for
the period June 2013 to June 2018 tends to be
stagnant from the beginning of the IPO until the end
of 2015 and from the beginning of 2016, the pattern
of SMBR stock prices is followed by a pattern of
daily returns which looks stable because the flat
pattern of the chart will remain in a certain period
there is a daily return rate that is above average, the
highest return on August 2, 2016 is 22.3% and the
lowest is -28.5%. Occurred on January 4, 2017.
To calculate the value of shares, investors and
shareholders can use stock valuation models and
make decisions on stock trading accordingly, but in
the market stock price fluctuations triggered by
supply and demand of stock. If more people want to
buy a particular stock, it is market price will increase.
Conversely, if more people want to sell a stock, its
price will fall.
Stock prices in the market not necessarily reflect
the right price of the company, fundamental analysis
is needed to find out the value of the company
(Damodaran, 2012).
Zemba & Hendrawan (2017), stated that every
investor has different terms in stock valuation which
cause the stock price fluctuation. The difference
refers to some conditions namely optimistic,
moderate and pessimistic. An optimistic condition is
Figure 3: SMBR Stock Price and rate return (Jun 2013-Dec
2018).
a condition in which investors can sell stocks at the
highest potential price because of the performance of
a company higher than industry. The moderate
condition is a condition in which the desire of
investors to sell stocks following the wishes of other
investors (buyers). While the pessimistic condition is
a condition in which investors can buy stocks at the
least price as possible because of the performance of
the company lower than industry.
Valuation of an asset can be determined in three
ways. First, as the intrinsic value of the asset, based
on its capacity to generate cash flows in the future.
Second, as a relative value, by examining how the
market is pricing similar or comparable assets.
Finally, we can value assets with cash flows that are
contingent on the occurrence of a specific event as
options (Damodaran, 2012).
Based on the phenomenon as explained there is a
fluctuating stock price of cement companies in
Indonesia from year to year, and there is a significant
return value at a certain period and from the results of
previous studies which show that stock prices do not
reflect the actual value (intrinsic value), the
researcher intends to conduct research on the
valuation of fair prices of Indocement Tunggal
Prakarsa (INTP), Holcim Indonesia (SMCB) and
Semen Baturaja (SMBR) using Discounted Cash
Flow (DCF) method with Free Cash Flow to Firm
(FCFF) approach and Relative Valuation Method
with Price Earning to Ratio (PER) approach and Price
Book to Value (PBV).
The study result provides guidance to help
investors on corporate valuation that explains the
intrinsic value to make investment decisions.
2 REVIEW OF RELATED
LITERATURE
This study uses several theories as a reference to
determine the method of calculating corporate value
valuations and makes consideration in conducting
evaluations.
2.1 Firm Values
Knowing what an asset is worth and what determines
that value is a prerequisite for intelligent decision
making in choosing investments for a portfolio, in
deciding on the appropriate price to pay or receive in
a takeover, and in making an investment, financing,
and dividend choices when running a business
(Damodaran, 2012).
Damodaran's statement illustrates that in the
business world it is essential to know assets that
provide value for a company. The value of the
company is indeed very beneficial for internal
ICIB 2019 - The 2nd International Conference on Inclusive Business in the Changing World
46

company, its shown the success in managing
company and also for external or investors, company
value can be useful as information in investment
decisions, good value will bring in more investors to
invest or buy the company's shares so that the
company's value is also related to the company's stock
price. Investors' requests and offers form the stock
price. High stock prices make the value of the
company high and can increase market confidence
not only in the company's current performance but
also infuture prospects.
2.2 Valuation Theory
According to Damodaran (2012), states that in
general there are three approaches to valuing an asset,
namely: (1) Discounted Cash Flow Valuation; (2)
Relative Valuation; and (3) Contingent Claim
Valuation.
2.3 Discounted Cash Flow Valuation
Discounted Cash Flow Valuation is the value of an
asset that is calculated based on the present value of
the cash flow generated in the future (expected future
cash flow) of an asset discounted using a specific
discount rate. The approach used in DCF consists of
Dividend Discounted Model (DDM), Free Cash Flow
to Equity (FCFE) and Free Cash Flow to Firm
(FCFF).
2.3.1 Dividend Discount Model
Damodaran (2012), Dividend Discounted Model
(DDM) is the most extended model used in the
Discounted Cash Flow (DCF) model, the principle
that underlies this DDM Model is when investors buy
shares in public companies (IPOs), they generally
expect two benefits: first profit from dividend during
the holding period and profit from the increase in the
share price itself at the end of the holding period.
Because the price of a stock that is expected to be
determined by a future dividend, the value of a share
can be reflected as the present value of dividends
forever.
The following formula can be used to calculate the
intrinsic value of shares (Damodaran, 2012):
P₀ =
+
+
+……..+
(1)
2.3.2 Free Cash Flow to Equity
Free Cash Flow to Equity (FCFE) is cash flow
available to shareholders after the company takes into
account capital expenditure, working capital and
corporate debt (Damodaran, 2012).
The equation is presented as follow:
FCFE = Net Income
- Capital Expenditures
- Depreciation
- Change non-cash working
capital
+ New debt issued
- Debt repayment (2)
2.3.3 Free Cash Flow to Firm
Free Cash Flow to Firm (FCFF) represents the
amount of cash flow from operations available for
distribution after depreciation expenses, taxes,
working capital, and investment are paid
(Damodaran, 2012).
The equation is presented as follow:
FCFF = (EBIT*(1-Tax)) + Depreciation
- Change noncash working capital (3)
FCFF calculates the intrinsic value of a company
by discounting cash flow to the firm with a weighted
average cost of capital (WACC). By using the WACC
formula to discount the FCFF value, the company
value will be obtained with the following formula
(Damodaran, 2012):
Value of Firm =
∑
.
(4)
2.4 Cost of Capital
Generally, sources of corporate funding can be
obtained through shareholder's equity and from
creditors in the form of debt. Cost of Capital is the
rate of return desired by providers of corporate funds,
namely a combination of equity, debt and hybrid
securities which is proxied as a weighted average cost
of capital (WACC).
WACC is one of the critical factors in the
calculation using the DCF model. Minor changes in
WACC will result in significant changes in company
value. The WACC is calculated by weighting the
source of capital according to the company's financial
structure and then multiplying them at their expense.
The equation is presented as follow:
WACC = (Composition of equity * rate of equity)
+ ((composition of debt * rate of debt)
Stock Valuations in Cement Companies: Evidence from Indonesia Stock Exchange
47

*(1-tax)) (5)
In the WACC calculation there are several factors
which will be explained as follows:
a.
Cost of equity
Definition of cost of equity (R
e
) is the rate
of return expected by the shareholder (equity)
on his investment in a company. The formula to
calculate the cost of equity (R
e
) is as follows
(Damodaran, 2012):
ERi R
f
β
ERm R
f
(6)
If the company distributes dividends
regularly, an alternative formula that can be
used to calculate R
e
is as follows (Kenton,
2018):
R
e
=
/
(7)
b. Cost of debt
Cost of debt (Cod) is the interest rate that
must be paid by the company for its debt or
external capital (Damodaran, 2012).
2.5 Terminal Value
Terminal value is the present value of all future cash
flows obtained after a period determined by scenario
analysis. The thinking behind terminal values is to
assume a constant growth rate for the time after the
period analyzed, where the constant growth rate is
symbolized by g then WACC is symbolized by r as
the discount rate used.
Terminal Value is calculated using the constant
growth model as follows (Damodaran 2012):
TV=
(8)
2.6 Enterprise Value
Enterprise Value is an economic measure that reflects
the market value of a business. Enterprise Value is
used as one of the benchmarks in business, financial,
accounting, portfolio analysis, and risk analysis. In
simple terms, the Enterprise Value formula (EV) is
the market cap value plus debt minus cash.
The equation is presented as follow:
EV = Market value of equity + debt – cash (9)
2.7 Relative Valuation
Relative Valuation is one of the most commonly used
valuation methods by comparing companies that are
similar or with the industries in which the company is
located. Market prices are obtained by relative
valuation, as a result of using real data during the
analysis. The tool used to do Relative Valuation is
multiples.
One form of multiples is price multiples, where
the main component of price multiple is the market
price. Some examples of price multiples include Price
Earning to Ratio (PER), Price Book to Value (PBV).
The advantages of the Relative Valuation model
are also weaknesses. First, ease in Relative Valuation
can be put together, pulling together with several
groups of similar companies, can also produce
estimates of values that are not consistent where key
variables such as risk, growth, or potential cash flows
are ignored. Second, the fact that multiples reflect the
market atmosphere also illustrates that using the
Relative Valuation method to value an asset can
produce a value that is too high when the market
overestimates similar companies or vice versa is too
low when the market underestimates similar
companies. Third, there is room for bias in all
valuation methods, the lack of transparency regarding
the underlying assumptions in the relative valuation
method makes it vulnerable.
2.7.1 Price Earning Ratio
Another alternative in conducting valuations to
calculate the intrinsic value of a stock or fundamental
value is to use the value of profit from the company.
Estimates of the intrinsic value of shares in a
company's analysis can be done using two important
information components of the company, namely
earnings per share and earnings multiplier,
(Damodaran, 2012).
The equation of PER is presented as follow
(Damodaran, 2012):
P₀= Estimasi EPS x PER (10)
2.7.2 Price Book to Value
One alternative approach to determining the value of
a stock with the Relative Valuation method is to use
the relationship between stock market prices and
book value per share (Damodaran, 2012).
Theoretically, the market value of stock must
describe the book value.
The equation is presented as follow:
ICIB 2019 - The 2nd International Conference on Inclusive Business in the Changing World
48
PBV =
₀
(11)
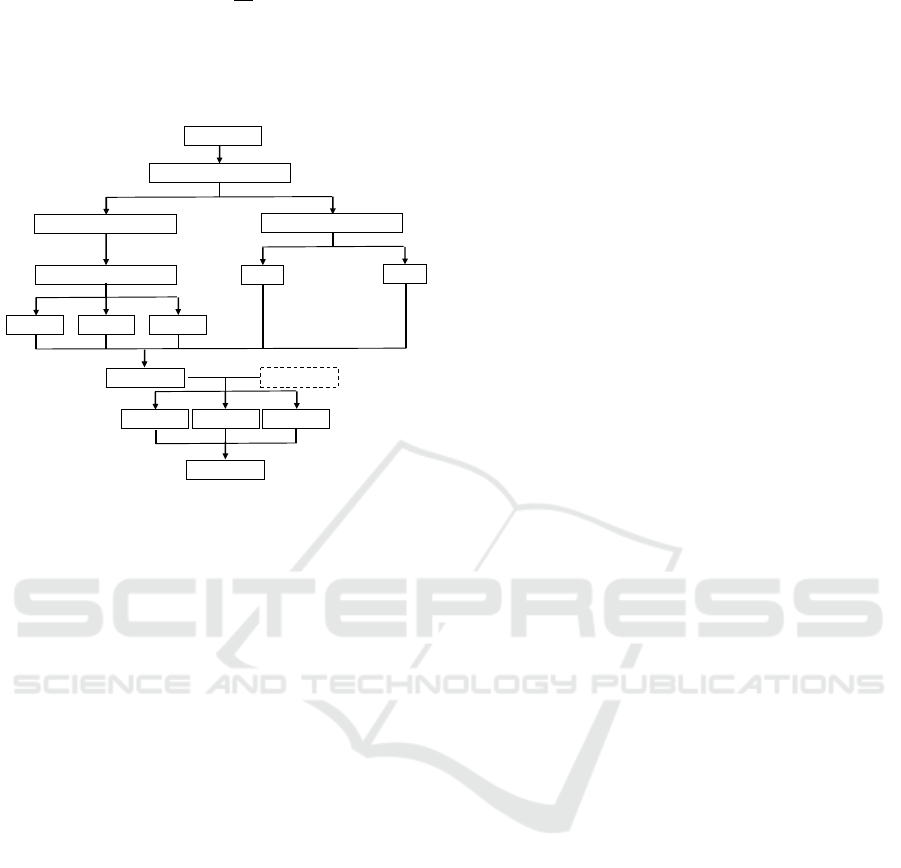
2.8 Research Framework
The research framework is presented as follow:
Figure 4: Research Frameworks.
With the stock price fluctuations that occur in
cement industry companies, to obtain fair company
fair value, fundamental analysis of the intrinsic value
stock prices is needed so that stock price valuation
needs to be done based on the chosen method namely
Discounted Cash Flow (DCF) method with Free Cash
Flow to Firm (FCFF) approach and Relative
Valuation (RV) with Price Earning to Ratio (PER)
approach and Price Book to Value (PBV) approach
using three scenarios, namely scenario optimistic,
moderate and pessimistic.
In order to conduct the fair value of stock prices,
projections of company performance are needed by
using historical data on company performance. To
map the performance of companies in an industry,
scenarios are made, namely optimistic scenarios
(company performance above industry), moderate
scenarios (company performance in the industry
range) and pessimistic scenarios (company
performance under industry). Scenarios can be
determined and viewed based on information on
environmental data and facts (Neaxie and
Hendrawan, 2017).
The results of valuation calculations based on the
DCF method and relative valuation will be compared
with market price, and the results can be known
whether the market price is overvalued, fair valued or
undervalued. If the result is overvalued, the investor
is recommended to sell the shares, if fair value is the
stock can still be maintained and if it is undervalued,
investors are recommended to buy the stock.
2.9 Previous Research
Khatik & Patil (2018), stated that to know the value
of a company, analysts, investors, researchers not
only understand the value of the company but must
know where the value of the company originates,
valuation of company value is done by estimating the
value of the company based on cash flow calculations
in the future or with comparing it with the value of its
assets.
Neaxie & Hendrawan (2017) using the DCF
method and Relative Valuation to evaluate the shares
of Telecommunications companies listed on the
Indonesia Stock Exchange, the use of both methods is
considered reliable because the results are still in the
industry range.
Trinh
& Thao (2017), the corporate valuation
model approaches discounted cash flow (DCF) and
capital asset pricing model (CAPM) for strategic
financial decisions of investment appraisal and
capital structure, the study provides an effective tool
in corporation valuation and value-based
management.
Jamshidi, Akbari, Asgari, & Renani (2015), the
necessity of considering the economic valuation of
the arts and culture comes from the competition
between different public and merit goods which seek
government.
D’Amato & Anghel (2013), in conducting
valuations using the DCF method, the critical thing
that needs to be taken into account is the discount rate,
where the discount rate range used between risk-free
and a risk premium.
Fairchild (2010), in his research, provides an
overview of the importance of corporate managerial
communication in corporate dividend distribution
decisions, small or down dividends are often
connoted as corporate values that are down again,
affecting investors' valuation of the company and vice
versa large dividends will have good corporate value
image, but information regarding this dividend
distribution if it is not managed correctly it will be
counterproductive because the company also needs to
reinvest in continuity and business development, the
indicator used to determine the dividend value is
knowing Net Present Value (NPV). Dividends can be
reduced for investments in NPV projects that are
negative until they get benefits.
Yoo (2006), this research using a combination of
simple valuation techniques where the data used to
make estimates also come from historical multiples
Value o
f
Firm
Valuation o
f
Intrinsic Values
D
iscounted Cash Flow Mode
l
R
elative Valuation Mode
l
PBV
PER
F
ree Cash Flow to Firm
Pesimi
s
tic
Moderate O
p
timistic
Tar
g
et Price
Price
p
er Share
Compare
Undervalued
F
airvalued Overvalued
B
u
y
/Hold/Sell
Stock Valuations in Cement Companies: Evidence from Indonesia Stock Exchange
49

combinations where the more relevant information is
to improve the valuation accuracy.
Another tool to validate the result of valuation is
relative valuation method, this method making the
comparison of the intrinsic value of the company, as
long as a result is within industrial range, the result of
DCF calculation is reliable and proper (Neaxie &
Hendrawan, 2017).
3 PROBLEM DEFINITION
Based on the introduction, the problems in this study
is stock prices fluctuations, and stock prices in the
market have not become certainty for investors to be
used as a basis for investment decisions, it is
necessary to do a valuation of the intrinsic value of
stock prices, for which research objectives are made
that will help these problems, as follows:
a. To analyze the intrinsic value of stock price in
cement companies in Indonesia Stock Exchange
using Discounted Cash Flow (DCF) method with
Free Cash Flow to Firm (FCFF) approach and
Relative Valuation method with Price Earning to
Ratio (PER) and Price Book to Value (PBV) on
an optimistic scenario in 2018.
b. To analyze the intrinsic value of stock price in
cement companies in Indonesia Stock Exchange
using Discounted Cash Flow (DCF) method with
Free Cash Flow to Firm (FCFF) approach and
Relative Valuation method with Price Earning to
Ratio (PER) and Price Book to Value (PBV) on a
moderate scenario in 2018.
c. To analyze the intrinsic value of stock price in
cement companies in Indonesia Stock Exchange
using Discounted Cash Flow (DCF) method with
Free Cash Flow to Firm (FCFF) approach and
Relative Valuation method with Price Earning to
Ratio (PER) and Price Book to Value (PBV) on a
pessimistic scenario in 2018.
4 METHODOLOGY / APPROACH
This research uses quantitative research method that
is a research method by calculating with a specific
method to get the desired result, in this case, is to get
fair value of stock prices used Discounted Cash Flow
(DCF) with Free Cash Flow to Firm (FCFF) approach
and Relative Valuation method with Price Earning to
Ratio (PER) and Price Book to Value (PBV)
approach as calculation tools referring to previous
research (Neaxie and Hendrawan, 2017).
In this study, researchers will use sampling
techniques with purposive sampling techniques. The
purposive sampling technique is getting samples by
setting specific characteristics that are suitable for the
objectives of the study.
The stages of selecting samples according to the
purposive sampling criteria that have been
determined are as follows:
a. Cement companies listed on the Indonesia
Stock Exchange in 2018 is presented as follows
follow:
1. Indocement Tunggal Prakarsa (INTP)
2. Semen Indonesia (SMGR)
3. Holcim Indonesia (SMCB)
4. Semen Baturaja (SMBR)
5. Wijaya Karya Beton (WTON)
6. Waskita Beton Precast (WSBP)
b. Cement companies that have the last five years
of financial statements (2013-2017) are
presented as follows:
1. Indocement Tunggal Prakarsa (INTP)
2. Holcim Indonesia (SMCB)
3. Semen Baturaja (SMBR)
Based on the criteria of the purposive sampling
determined, the sample of this study is Indocement
Tunggal Prakarsa (INTP), Holcim Indonesia
(SMCB) and Semen Baturaja (SMBR).
5 RESULT AND DISCUSSION
In this section of the discussion we will explain the
result of the calculation using the Discounted Cash
Flow method with Free Cash Flow to Firm (FCFF)
approach and by using Relative Valuation method
with the Price Earning to Ratio (PER) and Price Book
to Value (PBV) approach using three scenarios,
namely pessimistic, moderate, and optimistic.
5.1 The Intrinsic Value by Discounted
Cash Flow
Historical data from financial statements are needed
over the past five years (2013-2017) to conduct stock
price valuations using the Discounted Cash Flow
(DCF) method with Free Cash Flow to Firm (FCFF)
approach and Relative Valuation method with Price
Earning to Ratio (PER) and Price Book to Value
(PBV) approach.
Based on historical data the financial ratios are
calculated such as EBIT, EBITDA, Net Income,
Enterprise Value, Value Terminals. Where the ratio
will be used to calculate the fair value of the stock
price.
ICIB 2019 - The 2nd International Conference on Inclusive Business in the Changing World
50

Furthermore, based on historical data and its ratio,
the growth projection is made up to the next five years
with three scenarios namely pessimistic, moderate
and optimistic.
An essential thing in projecting is to make sales
growth projections because all ratios are very
dependent on the growth of sales.
To make the Revenue Projection, it must first be
known (Neaxie and Hendrawan, 2017):
a. Historical average industrial sales growth
b. Historical average sales growth of the company
c. Spread (delta between historical average
industrial sales growth with average sales
growth of company)
d. Industrial sales projection
The summary of sales projection using those
assumptions is presented as follows:
Table 1: Revenue projection growth.
INTP SMCB SMBR Industry
Historical -3.1% 0.9% 7.4% 4.7%
S
p
rea
d
-7.8% -3.8% 2.7%
Sales
Pro
j
ection
6.6%
O
p
timistic 6.6% 6.6% 10.6%
Moderate -1.2% 2.8% 9.3%
Pessimistic -5.1% 0.9% 6.6%
Source: Author's computations
By using calculated sales growth, the other
parameter or financial ratios needed such as Ebitda,
Depreciation and amortization, Capex, Ebit and so on
will follow the historical trend and some of them
managed to go down like capex which could be
reduced because investment in the previous period
was already substantial to go down for example capex
reduce like capex. Furthermore, the projection value
is used to calculate the intrinsic value of the company
following the formula previously explained, namely
the formula for calculating DCF-FCFF and Relative
Valuation.
After calculating the sales growth and financial
ratios associated with stock price valuations are
made, the fair value of each company can be seen and
can be compared with market prices on January, 2
nd
2018.
The summary of valuation result by DCF-FCFF is
presented as follow:
Table 2: The valuation result by DCF
Stock
Code
Scenario
Po
(IDR)
Target
Price
(IDR)
Result
INTP
Pessimistic
23,000
6,828 Overvalued
Moderate 8,181 Overvalued
Optimistic 15,119 Overvalued
SMCB
Pessimistic
825
637 Overvalued
Moderate 882 Undervalued
Optimistic 1,829 Undervalued
SMBR
Pessimistic
3,690
921 Overvalued
Moderate 1,888 Overvalued
Optimistic 3,837 Undervalued
Source: Author's computations
Based on Table 2, it can be seen that in the
pessimistic scenario the fair value of INTP, SMCB
and SMBR shares using Discounted Cash Flow
(DCF) method with Free Cash Flow to Firm (FCFF)
approach is overvalued. With this result, investors are
recommended to sell their shares and companies,
must increase sales productivity and optimize the
costs of both expense and Capital Expenditures.
Results of intrinsic value calculation on the
pessimistic scenario are still far below the market
price value. This occurs because the projection of
revenue of each company is still low such as INTP
which is predicted to be negative growth was 5.1%,
SMCB has growth projection 0.9%, and SMBR
growth was 6.6 %, which means lower than average
of the 2013-2017 period was 7.4%.
Based on the results of intrinsic value calculations
in a moderate scenario where the results of INTP and
SMBR share price was overvalued. This result in line
with revenue growth all of them is below in which
INTP has growth negative 1.23%, and the market
price of SMBR was influenced by previous period
performance expectations which had good historical
average growth around 7.4% and a large capex value
in the 2016 and 2017 periods. Whereas SMCB has
intrinsic value that is in an undervalued condition, it
means the investors recommended to buy SMCB
shares. SMCB's performance is in line with market
expectations with a positive growth was 2.8%, up
from the 2013-2017 historical average growth only
0.9%.
Stock Valuations in Cement Companies: Evidence from Indonesia Stock Exchange
51

Based on the calculation of the intrinsic value in
the optimistic scenario, it can be seen that INTP is still
overvalued, this happened because as overall
performance INTP has lower in sales growth while
expense ratio is managed equally according to
historical trends and capex is also lower than the
historical average, but the results are still below
market expectations. In while SMCB and SMBR was
undervalued, this is in line with the excellent
performance where SMCB's sales growth has been
above the historical average sales growth, while
SMBR besides its sales growth is above the historical
average sales growth and also above the industry
sales growth where both of them also manage opex
according to historical trends and CapEx is planned
to be lower than historical average.
5.2 The Intrinsic Value by Relative
Valuation
To validate the calculation of intrinsic value using
DCF-FCFF, other valuation tools are needed, namely
Relative Valuation, where from relative valuation
based on Price Earning to Ratio (PER) and Price
Book Value (PBV) approach, the results can be seen
whether the value is still within the industry range in
the Indonesia stock exchange (IDX) data or outside
the industry range, if in the range, it means that the
DCF-FCFF calculation results are considered reliable
or proper and vice versa if it is still outside the range,
it can be seen the assumptions used in calculating the
valuation. In this case, the comparative data is IDX
data as of the 1
st
quarter, 2018.
The summary calculation of intrinsic value that
uses relative valuation method with PER and PBV
approach is presented as follow:
Table 3: Industry Range of PER & PBV.
PER of Industry
(IDX 1
st
Quarter
2018)
PBV of Industry
(IDX 1
st
Quarter
2018)
Min. -7.10 1.02
Avera
g
e 15.86 1.23
Max. 277.89 2.27
Table 4: The Valuation result by relative valuation.
Stock
Code
Scenario
PER
(
Times
)
PBV
(
Times
)
Result
INTP
Pessimistic
9.58 1.02
In
industry
range
Moderate
11.03 1.23
In
industry
range
Optimistic 18.88 2.27
In
industry
range
SMCB
Pessimistic 7.60 0.63
In
industry
range
Moderate 10.33 0.88
Out of
Industry
ran
g
e
Optimistic 20.65 1.82
In
industry
ran
g
e
SMBR
Pessimistic 35.09 2.68
In
industry
range
Moderate 70.19 5.49
In
industry
range
Optimistic 140.89 11.16
In
industry
ran
g
e
Source: Author's computations
The results of PER calculation in the pessimistic
scenario, INTP is 9.58 times, SMCB is 7.60 times,
and SMBR is 35.09 times. While on IDX data as of
1
st
quarter, 2018 shows that average PER value of
cement companies is 15.86 times, with the lowest
PER value in Holcim Indonesia (SMCB) Is -7.10
times and the highest PER value for Semen Barturaja
(SMBR) is 277.49 times. This shows that the results
of research calculations are in the range of PER in the
market.
Furthermore, the PBV calculation results on the
pessimistic scenario show that INTP is 1.02 times,
SMCB is 0.63 times, and SMBR is 2.68 times. While
on IDX data as of 1
st
quarter, 2018 shows that the
average PBV value of cement companies is 3.38
times, with the lowest of PBV in Holcim Indonesia
(SMCB) Are 0.83 times and the highest PBV value in
Semen Baturaja (SMBR) is 11.92 times. This shows
that the results of research calculations are in the PBV
range in the market except for SMCB slightly below
industry range.
Based on the results of the valuation calculation in
the pessimistic scenario using Relative Valuation
method with PER approach, it is found that the
SMCB stock price is lower compared to INTP and
SMBR, where the PER value of SMCB is smaller
than INTP and SMBR, with PER value of 7.60 times.
Which means that if we invest in SMCB shares, the
return on investment is around seven years six
months, faster than INTP and SMBR. So suggestions
ICIB 2019 - The 2nd International Conference on Inclusive Business in the Changing World
52

for investors should prefer SMCB shares compared to
INTP and SMBR shares. While suggestions for
companies if they want a low PER value, the
company needs to increase earnings per share from its
shares. Whereas if using the PBV approach, then the
SMCB stock price is cheaper compared to INTP and
SMBR, where the value of SMCB PBV is smaller
than INTP and SMBR, which is equal to 0.63 times,
which means that the stock price of SMCB is valued
at 0, 63 times when compared to its intrinsic value.
While INTP's stock price is valued at 1.02 times when
compared to its intrinsic value, and the stock price of
SMBR is valued at 2.68 times compared to its
intrinsic value.
Based on PER calculation results on a moderate
scenario, INTP is 11.03 times, SMCB is 10.33 times,
and SMBR is 70.19 times. While on IDX data as of
1
st
quarter, 2018 shows that the average PER of
cement companies is 15.86 times, with the lowest
PER value in Holcim Indonesia (SMCB) Is -7.10
times and the highest PER value for Semen Barturaja
(SMBR) is 277.49 times. This shows that the results
of research calculations are in the range of PER in the
market.
Furthermore, the PBV calculation results on
moderate scenarios show that the INTP is 1.23 times,
SMCB is 0.88 times, and SMBR is 5.49 times. While
on IDX data as of 1
st
quarter 2018 shows that the
average PBV value of cement companies is 3.38
times, with the lowest PBV value on Holcim Tbk
(SMCB) is 0.83 times and the highest PBV value in
Semen Baturaja Tbk (SMBR) is 11.92 times. This
shows that the results of research calculations are in
the PBV range in the market.
Based on results of valuation calculation in
moderate scenario using the Relative Valuation
method with PER approach, it is found that the
SMCB share price is cheaper compared to INTP and
SMBR, where the PER value of SMCB is smaller
than INTP and SMBR, with a PER value of 10.33
times, which means that if we invest in SMCB shares,
the return on investment is 10 years and 3.3 months,
faster than INTP and SMBR. So investors should
prefer to choose SMCB shares when compared to
INTP and SMBR shares. While suggestions for
companies if they want a low PER value, the
company needs to increase earnings per share from its
shares.
Using PBV approach, SMCB stock price is lower
compared to INTP and SMBR, which is where the
PBV value of SMCB is 0.88 times, smaller than INTP
and SMBR, which means that the price of SMCB
shares is valued at 0.88 times when compared to its
intrinsic value. While INTP's stock price is valued at
1.23 times compared to its intrinsic value, and
SMBR's share price is valued at 5.49 times when
compared to its intrinsic value, as recommendation
investors to prefer SMCB shares compared to INTP
and SMBR shares. Whereas for companies it is
recommended to increase the book value of the
company by increasing the amount of equity in order
value of the PBV go down.
In the optimistic scenario, calculation results show
that INTP PER value is 18.88 times, SMCB PER
value is 20.65 times, and SMBR is 140.89 times.
While on IDX data as of 1
st
quarter, 2018 shows that
average PER value of cement companies is 15.86
times, with the lowest PER value in Holcim Indonesia
(SMCB) Is -7.10 times and the highest PER value for
Semen Baturaja (SMBR) is 277.49 times. This shows
that the results of research calculations are in the
range of PER in the market.
Overall, SMBR has a very high PER value or far
above the average where the pessimistic scenario is
35.09 times, moderate scenario is 70.19 times, and
optimistic scenario is 140.89 times while PER of
industry average is 15.86 times even though still
within the industry range, this is caused by market
expectations of historical performance of SMBR
which have high revenue growth while opex and
capex are also significant, so the result makes small
earnings.
Based on the results of PBV calculation on
optimistic scenarios, INTP is 2.27 times, PBV is 1.82
times, and SMBR is 11.16 times. While on IDX data
as of 1
st
quarter, 2018 shows that the average PBV
value of cement companies is 3.38 times, with the
lowest PBV value of Holcim (SMCB) is 0.83 times
and the highest PBV value in Semen Baturaja
(SMBR) is 11.92 times. This shows that the results of
research calculations are in the PBV range in the
market.
PER calculation results in optimistic scenario
using the Relative Valuation PER approach shows
INTP stock prices are cheaper compared to SMCB
and SMBR, where the INTP PER value is smaller
compared to SMCB and SMBR, with a PER value of
18.88 times, which means that if we invest in INTP,
the return on investment (BEP) for 18 years is 8.8
months, faster than SMCB and SMBR. So
suggestions for investors should prefer INTP shares
when compared to SMCB and SMBR shares. While
suggestions for companies if they want a low PER
value, the company needs to increase earnings per
share.
Whereas if using PBV approach, SMCB stock
price is lower compared to INTP and SMBR, which
is the PBV value of the SMCB is 1.82 times or smaller
Stock Valuations in Cement Companies: Evidence from Indonesia Stock Exchange
53

than INTP and SMBR, which means that the price of
SMCB shares is valued at 1.82 times intrinsic value.
Whereas INTP's share price is valued at 2.27 times
compared to its intrinsic value, and the stock price of
SMBR is valued at 11.16 times compared to its
intrinsic value, The recommendations are investors
prefer SMCB shares compared to INTP and SMBR
shares and companies recommended to increase the
book value of the company by increasing the amount
of equity, so that the value of the PBV will be down.
6 CONCLUSIONS
This research produces different valuation values
assuming different growth, in the pessimistic scenario
by DCF-FCFF calculation show that INTP, SMCB,
and SMBR are overvalued. Then in the moderate
scenario that INTP and SMBR in Overvalued and
SMCB conditions are undervalued, whereas in the
optimistic scenario the results of DCF-FCFF
calculations show that INTP is in overvalued
condition while SMCB and SMBR are undervalued.
From the Relative valuation calculation, all scenarios
show that the results of INTP, SMCB, and SMBR are
in the industry range, which means that DCF-FCFF
calculations are reliable and proper. The conclusions
of this research is to recommend selling INTP shares
and buying SMCB and SMBR shares.
This study illustrates that the method used to
evaluate the intrinsic value of stock prices is
Discounted Cash Flow (DCF) with the Free Cash
Flow to Firm (FCFF) approach and the Relative
Valuation method with the Price Earning to Ratio and
Price Book to Value (PBV) approach on Previous
research (Neaxie & Hendrawan, 2017) is still valid
and relevant where the results can be a reference for
investment decisions.
REFERENCES
Damodaran, A., 2012. Damodaran on Valuation second
edition. United States of America: John Wiley & Sons
Inc.
D’Amato, M., Anghel, I., 2013. Regressed DCF, Real
Estate Value, Discount Rate, and Risk Premium
Estimation. A case in Bucharest. ResearchGate
Fairchild, R., 2010. Dividend Policy, Signalling, and Free
Cash Flow: An Integrated Approach, Managerial
Finance, Vol. 36 Iss 5 pp. 394 – 413
Jamshidi, H. M., Akbari, N., Asgari, A. & Renani, M.,
2015. Economic Valuation of Cultural Goods (Case
Study: Isfahan City of Arts). International Journal of
Business and Development Studies Vol. 7, No. 1
Khatik,S.K., Patil, M., 2018. Company Valuation using
Free Cash Flow Technique: A case study of National
Thermal Power Corporation Limited. Journal of
Advanced Management Research. Vol.06 Issue-03
Neaxie, L.V., Hendrawan, R., 2017. Valuation
Telecommunications Firms: Evidence from Indonesia
Stock Exchange, Journal of Economic and
Management Perspectives, Volume 11, Issue 3.
Trinh, T.H., Thao, L.T.N., 2017. Corporate Valuation
Modeling for Strategic Financial Decisions. Asian
Economic and Financial Review. Vol. 7, No. 12, 1153-
1166
Yoo, Y.K. 2006. The valuation accuracy of equity valuation
using a combination of multiples, Review of
Accounting and Finance, Vol. 5 Iss 2 pp. 108 - 123
Zemba, S., Hendrawan, R., 2018. Does Rapidly Growing
Revenues Always Produce An Excellent Company’s
Value? DCF & P/E Valuation Assessment on Hospital
Industry. e-Proceeding of Management: Vol.5, No.2
ICIB 2019 - The 2nd International Conference on Inclusive Business in the Changing World
54
