
CATI: An Active Learning System for Event Detection on Mibroblogs’
Large Datasets
Gabriela Bosetti
a
, El
˝
od Egyed-Zsigmond
b
and Lucas Okumura Ono
c
Universit
´
e de Lyon, LIRIS UMR 5205 CNRS,
B
ˆ
atiment Blaise Pascal, 20 avenue Albert Einstein, 69621 Villeurbanne, France
Keywords:
Active Learning, Human-computer Interaction, User-centric Systems, Web Information Filtering and
Retrieval.
Abstract:
Today, there are plenty of tools and techniques to perform text- or image-based classification of large datasets,
targeting different levels of user expertise and abstraction. Specialists usually collaborate in projects by cre-
ating ground truth datasets and do not always have deep knowledge in Information Retrieval. This article
presents a full platform for assisted binary classification of very large textual and text and image composed
documents. Our goal is to enable human users to classify collections of several hundred thousand documents
in an assisted way, within a humanly acceptable number of clicks. We propose a graphical user interface,
based on several classification assistants: text- and image-based event detection, Active Learning (AL), search
engine and rich visual metaphors to visualize the results. We also propose a novel query strategy in the context
of Active Learning, considering the top unlabeled bi-grams and duplicated (e.g. re-tweeted) content in the
target corpus to classify. These contributions are supported not only by a tool whose code is freely accessible
but also by an evaluation of the impact of using the aforementioned methods on the number of clicks needed
to reach a stable level of accuracy.
1 INTRODUCTION
Classifying documents is the well-known process of
assigning one or multiple categories to documents ac-
cording to their content (which may be of diverse
nature, e.g. textual, visual, multimedia). There are
plenty of tools and techniques to perform such clas-
sification –especially when dealing with large data–
conceived within a wide range of levels of abstrac-
tion. There are very flexible and low-level frame-
works and libraries to create classification solutions,
like Mallet (McCallum, 2002), Apache openNLP
1
,
GENSIM (
ˇ
Reh
˚
u
ˇ
rek and Sojka, 2011), spaCy (Hon-
nibal and Montani, 2017) or NLTK (Hardeniya et al.,
2016), to be used with well-known languages like R,
Python or Java. These solutions are nevertheless only
for those who have some background in software de-
velopment or who are willing to go first through a
learning stage, which may turn out time-consuming.
Moreover, whereas users without knowledge in
a
https://orcid.org/0000-0002-3968-6738
b
https://orcid.org/0000-0002-1218-8026
c
https://orcid.org/0000-0003-0445-6905
1
https://opennlp.apache.org
Natural Language Processing (NLP) may not always
have a technological background but a deep under-
standing of the domain problem to solve, NLP experts
usually need help from such domain specialists when
building ground truth training corpora, for instance,
when annotating clinical documents (Gobbel Dr et al.,
2014). This need can be also be justified by projects
like IDENUM
2
, which integrates the interests of part-
ners from the industry and the academia, the Social
and the Computer Sciences, to generate tools for an-
alyzing the use of urban digital data to describe and
characterize documentation and archiving practices of
an urban territory. The challenge, then, is to provide
the means to overcome the gap between domain ex-
perts and data scientists.
Generically speaking, there are user-centered
tools that let end users –people who do not necessarily
know about software development– to build their own
solutions through mechanisms with a high level of ab-
straction and allowing them to be independent of a de-
veloper. This kind of tools allows users to handle their
data in different ways, providing them the freedom to
2
http://imu.universite-lyon.fr/projet/idenum-identites-
numeriques-urbaines
Bosetti, G., Egyed-Zsigmond, E. and Ono, L.
CATI: An Active Learning System for Event Detection on Mibroblogs’ Large Datasets.
DOI: 10.5220/0008355301510160
In Proceedings of the 15th International Conference on Web Information Systems and Technologies (WEBIST 2019), pages 151-160
ISBN: 978-989-758-386-5
Copyright
c
2019 by SCITEPRESS – Science and Technology Publications, Lda. All rights reserved
151

choose among different functionalities they can ap-
ply to the data or different values for their parameters.
This is what Lieberman (Lieberman et al., 2006) calls
Parameterization.
There are different Parametrization applications
facilitating data scientists the classification and anno-
tation of large document collections (see Section 3).
However, very few empower users to build their own
classified corpora in the domain of microblogs tar-
getting events, by categorizing the documents using
an event detection process based on textual and vi-
sual content, and their results may not always match a
big amount of documents in the dataset. For instance,
with MABED (Guille and Favre, 2014) the users can
detect events based on textual features, but they must
specify how many events the algorithm should be in-
tended to detect, which may not cover the full amount
of events and documents and it is hard to determine
when having little information about a large –and
probably unknown– dataset. In contexts like this, an-
notating the remaining documents can be expensive.
The general task of annotating big datasets might
be expensive and time-consuming to perform for a
human in a non-assisted way, and sometimes there
is no training set to train a model and automatically
classify the data, or there is one but the available
labels are scarce. Fortunately, there is a sub-field
of artificial intelligence and machine learning aimed
at building classifiers through incremental enhance-
ments and requiring only minimal supervision; it is
called Active Learning (AL) (Settles, 2009). It can
start from scratch by selecting the “N” most infor-
mative instances (usually called sample queries) from
a fully unclassified dataset and asking an oracle (an
entity, usually a human) to label them with a cate-
gory, moving these labeled instances into the training
set, after the first set of labeling, a first classification
model is trained. The full process is repeated until a
stopping criterion is met (e.g. max number of itera-
tions or labeled data, exhausted labeling budget, etc.).
This way, assisting users to carry out a classification
can be beneficial. And it is even if the initial classified
data is imbalanced. In this sense, Miller et al. (Miller
et al., 2018) demonstrated that Active Learning with
an Uncertainty Sampling strategy performs better in
such conditions.
In this work, we propose:
• A system assisting users (with no or little knowl-
edge in data science and classification) in the con-
struction of an annotated corpus, while trying to
minimize the user efforts
• An interactive visual interface to conduct the AL
based assisted classification.
• A preliminary study comparing two query selec-
tion strategies for AL, one of which is a slight
variation of the Uncertainty Sampling method
adapted to microblogging: it considers top con-
tent duplication (e.g. re-tweets) and the presence
of top bi-grams. The goal is to minimize the re-
quired number of clicks to classify the dataset.
This article is organized as follows: Section 2 in-
troduces our approach, the event detection methods
used, the AL model we adopted, and our supporting
tool; Section 3 presents the state-of-the-art; Section
4 reports a study on the use of our tool; and Sec-
tion 5 presents the conclusions and perspectives of our
work.
2 OUR APPROACH
This work aims to provide end users with the means
to produce a classified data set from a corpus of time-
stamped documents, eventually accompanied with
images. To do so, we propose a pipeline of methods
to classify the documents in 3 stages. Fig.1 shows
an overview of the proposed method. The first phase
comprises identifying an initial subset of documents
with which the user feels confident to annotate. This
can be carried out in different ways. For example, a
simple way would be to carry out two searches: one
with a word closely related and another very little re-
lated to the event the user is intended to identify in
the dataset. Another way could be using an event-
detection method and use textual, time and image fea-
tures if available (Firas Odeh, 2018), to get a list of
event-related clusters, or event-related image clusters.
The second phase consists in annotating the subsets of
the previous stage, generating an initial classification
of the documents (with very light user intervention)
based on the pre-processed features (detected events,
image clusters, query results). As the classified docu-
ments usually represent a small part of the dataset, the
third phase assists the user through AL in the classifi-
cation of the remaining documents.
Figure 1: Overall flow of the proposed pipeline.
We call our system “CATI” (Classification As-
sist
´
ee de Textes et Images) and it is available on-
line, as well as its documentation and demonstration
videos
3
. It uses methods described in (Guille and
3
CATI’s documentation, videos and source code:
https://bitbucket.org/idenum/cati/wiki/Home
WEBIST 2019 - 15th International Conference on Web Information Systems and Technologies
152

Favre, 2014) and (Firas Odeh, 2018). It is impor-
tant to note that we tested the system on tweets, but it
can be used on any time-stamped text documents that
eventually have associated images, like news articles.
Although the evaluation of this article describes the
methods and modules of the system that allow carry-
ing out an initial classification through event detec-
tion, the classification strategy can vary and it repre-
sents an extension point. For example, if you want
to classify documents based on certain keywords that
express certain emotions (happiness, hate, etc.), the
platform is currently endowed with a search module
supporting features such as search by n-grams, image
clusters and duplicated content (e.g. re-tweets). The
current experiments were carried out on classification
criteria that are well suited for event and image-based
initial classification. Using the search engine and n-
gram based extensions enable the creation of the ini-
tial classification sets for other types of binary clus-
tering criteria as well.
2.1 Phase 1: Preprocessing Methods
In this stage of the pipeline, we propose obtaining
quickly subsets of documents that will be later clas-
sified as positive or negative. Since the objective is to
have an initial classification, there must be both posi-
tive and negative documents.
One strategy is through event detection. In fact,
in this regard, we used two methods that were evalu-
ated with tweets (Guille and Favre, 2014; Firas Odeh,
2018); while the first focuses on a classification based
on textual features and uses anomaly detection on
word frequency to extract events, the latter also re-
lies on image similarity among the ones associated
with different tweets. MABED++(Firas Odeh, 2018)
improves MABED (Guille and Favre, 2014) in two
aspects: it considers the images associated to the
tweets during the event detection process using a very
fast almost identical image search method (Gaillard
and Egyed-Zsigmond, 2017) and it enables to retrieve
documents (tweets) related to a detected event. Such
events are a possible target for our initial classifica-
tion. An example of one of these events is presented
in Fig.2-a. MABED++ also clusters the tweets with
images based on the image content. This is to say that
for each event cluster, there are sub-clusters of im-
ages that the users may also use as the initial classi-
fication. Fig.2-b presents one of these image clusters
in our platform.
Other strategies could be achieved by using the
functionalities associated to our search form: each
time the user searches for some keywords, the plat-
form not only presents the individual documents that
match the search criteria but also some extra sections
that try to provide more insights on the data set and
enable the classification with one click of large docu-
ment subsets:
• N-grams. It is possible to visualize a pie-cloud
with the top n-grams ranking. Each cake presents
an n-gram and is divided according to the per-
centage of documents labeled as positive, nega-
tive or unclassified (as in Fig.2-d). By clicking on
each bi-gram, the user can access and classify all
its related documents. It is also possible to filter
the n-grams under a certain category, and the end
user could make use of such feature to request just
those that remain to classify.
• Image Clusters. A second section presents the
image clusters detected with MABED++. But in
this case, we are not presenting them in relation to
an event but to a specific search criteria.
• Duplicated Content. A third session presents a
ranking on top duplicated-content documents. In
the domain of this work, most of this content may
be re-tweets.
It is worth mentioning that the user can trigger a
full-match query, that is, a query with no keywords,
in order to get the top n-grams, image clusters and
re-tweets of the whole dataset.
2.2 Phase 2: Initial Classification
In this phase, the user should annotate the clusters ob-
tained in the previous phase to have an initial amount
of documents for both categories: positive and nega-
tive. These documents will be used later for the train-
ing of the AL process. The visual interface to carry
out the initial classification using the events is pre-
sented in Fig.2.
Regarding the event detection strategy, the events
are presented on a timeline with a list of associated
words (a) and image clusters (b). A full event or
an image cluster can be classified by clicking on the
“Confirmed” or the “Negative” button. This is to say,
not more than a single click for each cluster is re-
quired. However, in some cases the descriptive image
of a cluster may not be very descriptive and it may
be necessary to retrieve (with an extra click) the re-
lated tweets to make a decision based on their textual
content.
Each item on the top duplicated content (c) can be
classified with a single click, while each n-gram (d)
can be classified with two clicks.
We also reused the extra sections of our search
form (the n-grams visualization, the duplicated con-
tent presentation) on the tweets related to an event.
CATI: An Active Learning System for Event Detection on Mibroblogs’ Large Datasets
153
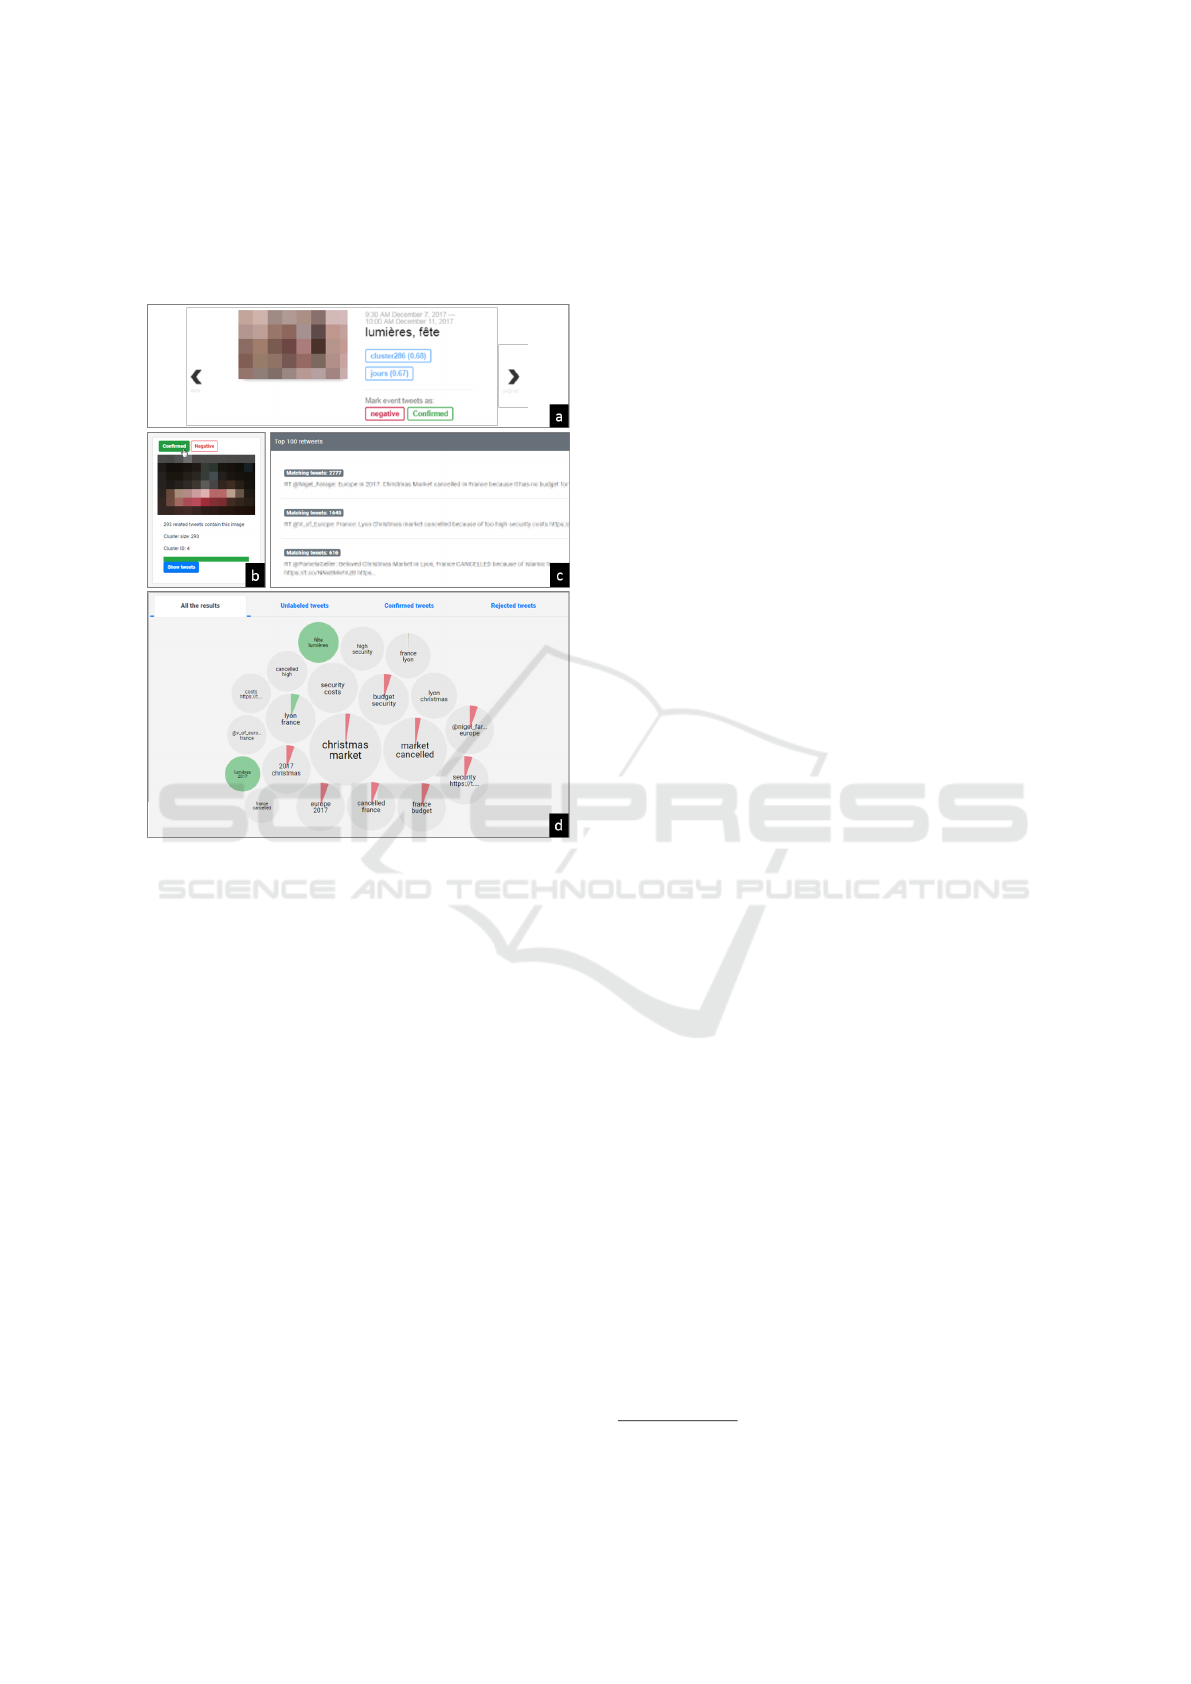
The main motivation of these frames is to be able to
understand in general terms the predominant content
of the event in order to make a decision regarding its
full classification.
Figure 2: Classification visual interface.
2.3 Phase 3: Active Learning (AL)
Process
One of the most important aspects of AL is the way to
select the most informative instances to be presented
to the oracle for manual classification. There are
many methods to do so, usually referred to as “Query
Learning Strategies” (Settles, 2009). For instance, the
Uncertainty Sampling learning strategy takes the in-
stances for which it is least certain how to label, ignor-
ing the instances it is already confident about. Then, it
makes the decision based on the confidence of a mea-
sure of uncertainty, like the lower predicted label’s
distance to the hyperplane, to sort all the documents
and to get the top queries.
In this work, we propose some modifications to
the Uncertainty method with the aim of taking ad-
vantage of the bi-grams we generated for each doc-
ument and of the duplicated content that, on Twitter,
is usually due to retweets. Our method is sorting the
query samples according to three weighted scores in-
stead of the single one (the distance to the hyperplane
in Uncertainty Sampling). We calculate three scores
for each of the query samples: 1) the distance to the
hyperplane, 2) the position of the document if it is
on the top-duplicated-documents ranking, 3) the first
position of any of the document’s bi-grams if present
on the top-bi-grams ranking. The rankings “2” and
“3” are retrieved based on the unlabeled documents
in the dataset. Our method allows assigning differ-
ent weights of the 3 different scores as input parame-
ter we call “configuration” to each combination. Our
goal is to verify if some of such configuration produce
better results in terms of interactions than the original
method.
In all the cases, we used a LinearSVC model and
vectorized the bi-grams field of the documents with a
TF-IDF vectorizer by SKLearn
4
. However, this ap-
proach could be used with other models, since al-
though some strategies have particular requirements
for the model, any classification model can be usually
used to perform AL (Miller et al., 2018).
Regarding the user interface, the process is pre-
sented to the users in a separate section where they
can choose the query strategy through tabs. The pro-
cess is supported with a carousel (Fig.3), and users
should loop through the steps (a) and (b) until they
achieve a classification they consider satisfactory. In
the first step, they are presented with the predictions
for the selected documents as queries (Fig.3(a)). If
any prediction is wrong, the user can toggle its value.
Then, the model is re-trained and the new classifica-
tion is presented in step (b), so the user can analyze
the results and make a decision.
3 RELATED WORK
Concerning document annotation and classification,
GATE (General Architecture for Text Engineering)
(Cunningham et al., 2011) is a big family of tools
for developing software components for Natural Lan-
guage Processing (NLP). The problem is that non-
technical users depend, at some point, on NLP ex-
perts to develop or combine some components (e.g.
data structures and algorithms). There are also some
approaches specialized in micro-blogs content, like
TwitIE (Bontcheva et al., 2013), a NLP pipeline
which extends the general-purpose information ex-
traction pipeline of GATE to deal with micro-blog
text. This work is similar to our work since it deals
with content from microblogs. However, carrying it
out requires a higher level of knowledge for users to
operate with GATE. In addition, event detection and
image-based clusters are not natively included.
4
https://scikit-learn.org
WEBIST 2019 - 15th International Conference on Web Information Systems and Technologies
154
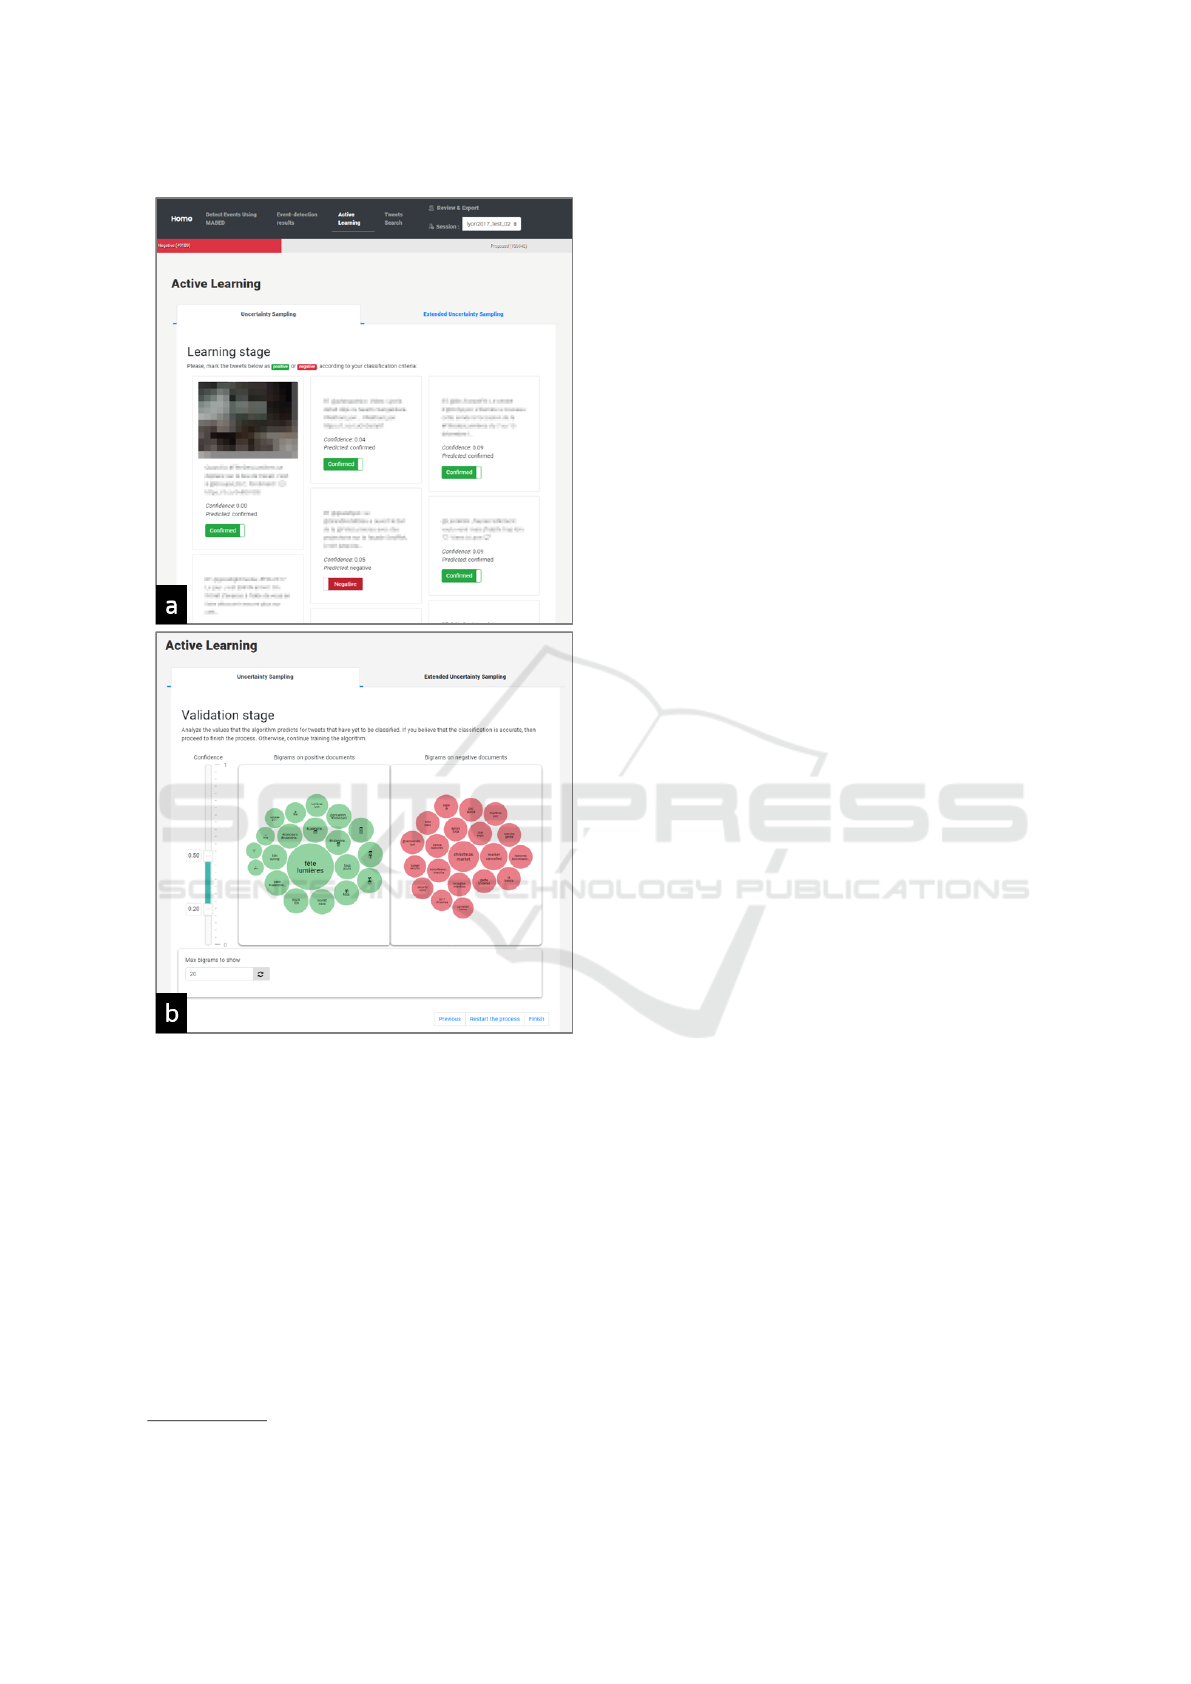
Figure 3: Active learning interface.
From a user-centered and general-purpose point of
view, MonkeyLearn
5
is an online Machine Learning
platform for Text Analysis allowing users to process
different kinds of documents (e.g. tweets, chats) and
create and test their models through a graphical inter-
face. We have not found documentation on the design
of the models to contrast our work, but at least we can
differentiate in that our work also uses the images as-
sociated with the documents to cluster them and into
related documents, and that the user can easily apply
different classification methods to the same dataset.
Our method implements in addition, a non supervised
event detection method in the preprocessing phase.
5
https://monkeylearn.com/
NLPReViz (Trivedi et al., 2018) is an annotation
tool in the medical field that reduces the time to create
an annotated corpus by interactively and continuously
improving the accuracy of its predictive model by in-
volving the user in the process. CATI is not tied to a
single domain; it enables the user to massively label
a whole class of documents associated with a certain
image, event, n-gram or simply with all the results re-
trieved from a search.
In the context of event detection, Katragadda et
al.(Katragadda et al., 2016) propose a topic evolution
model to quickly detect events from Twitter streaming
in real-time. They conducted an experiment where
tweets were collected in micro-batches of a minute
each. The detection of the start of an event is achieved
by comparing a term frequency over the most recent
time periods to the historical frequencies of the same
term. The result of this stage is the generation of a co-
occurrences graph, that later is pruned to reduce the
number of nodes, and clustered with a voltage based
clustering algorithm. Finally, some clusters are elim-
inated in this step and the resulting clusters represent
the collection of detected events.
Cai et al.(Cai et al., 2015) present a model
for event detection called STM-TwitterLDA (Spatio-
Temporal Multimodal TwitterLDA), which mainly
differentiates from TwitterLDA in the target distribu-
tion they use to model the topic (location-specific vs
user-specific), and the number of features they con-
sider. One of their main contributions is the con-
sideration of images as a feature; they take into ac-
count the visual properties of the images associated
to a tweet (they apply convolutional neural network to
represent images as text, but first they filter some im-
ages: the ones representing “stop words” (cartoons,
landscapes, diagrams or text-based screenshots) and
“general words” (noisy images). They just keep “spe-
cific images”, which are the ones meant to visually
describe the event.
Spina et al. (Spina et al., 2015) analyze the effec-
tiveness of active learning for entity filtering in the so-
cial media; which is, extracting topics, conversations,
and trends around a concrete entity. They used a lin-
ear Support Vector Machine and different sampling
methods (random, uncertainty and density sampling)
to compare their results. They retrain the model after
every single query labeled by the user. The authors
find out that using uncertainty sampling is effective
and the strategy that works best for this task (among
the ones they used).
Regarding AL and microblogging, Hu et al. (Hu
et al., 2013) model textual content to incorporate so-
cial network information to later analyze whether the
social relations can improve the active learning results
CATI: An Active Learning System for Event Detection on Mibroblogs’ Large Datasets
155

on such a networked data. They propose two query
sampling methods: a global one, aimed at labeling
highly representative documents in a network to prop-
agate the information through a big number of nodes
in a whole network; or a local one, aimed at finding
the most representative local documents from within-
group connections rather than between-group (global)
connections. In the evaluation, the authors use a Sup-
port Vector Machine classifier and compare different
query strategies, as Random Sampling, Uncertainty
Sampling or Query by Committee against two of their
methods with a global or local selection strategy. In
contrast, we do not directly consider the relationships
between users in the AL process.
A recent approach by Makki et al. (Makki et al.,
2018) proposes a user-driven approach for the re-
trieval of Twitter content through AL strategies. The
aim is to improve the searching in social media
by supporting the exploration of potentially relevant
tweets. They propose starting with an initial unsuper-
vised retrieval (extracting discriminative features us-
ing tf-idf) with no user intervention and then a second
component applies 4 AL query sampling strategies
comprising the highest similarity to a debate, similar
content (not exactly the same), frequent hashtags and
post replies. In contrast, our starting clusters represent
events or images, not used in this approach, and our
sampling strategies consider exactly duplicated docu-
ments and bigrams as well.
4 EVALUATION
In this section we present a preliminary experiment
on a dataset of tweets targeting the event “F
ˆ
ete des
Lumi
`
eres”
6
.
4.1 Dataset(s) Description
The dataset used in this study was created by collect-
ing the tweets associated with the “Lyon” keyword
from December 01, 2017 to December 13, 2017 using
the Twitter Streaming API
7
. The sample contains 169
774 tweets that were manually classified by 3 users,
who determined whether the tweets were related to
the “F
ˆ
ete des Lumi
`
eres” (FDL) event or not. They
determined that there were 23 999 positive tweets and
the remaining ones were negative. Concerning the im-
ages, there are 8818 tweets associated with –at least–
one image.
6
http://www.fetedeslumieres.lyon.fr
7
https://developer.twitter.com/
4.2 Scenarios and Initial Classification
We evaluated our method in 2 scenarios consisting of
two ways of classifying an initial amount of tweets to
later use their labels in the AL process. In both cases,
we used the pre-processing results concerning event
detection and image based clustering. We started by
performing the event detection process returning the
top 10 events. The method we used (Guille and Favre,
2014) is based on anomaly detection in word frequen-
cies over time. It detects events in an unsupervised
manner and describes them by a list of representative
keywords. These words may not have a clear sense
in some cases as you may notice it on Table 1, but
the detected events reflect the content of the data set.
We also fixed the parameters to default for the im-
age duplicated finder algorithm (Gaillard and Egyed-
Zsigmond, 2017). Therefore, all our scenarios start
from the same base of 10 events listed in Table 1 and
the same image clusters. We then proceeded to clas-
sify the associated tweets in a different way each: in
one case we fully annotate two events, one positive
and one negative, and in the second case we classify
all of them. In Table 1 you can observe the main
keyword(s) describing the event, the number of im-
age clusters and the number of related tweets.
The criteria for the classification of the event-
based scenarios:
• Scenario 1. The user classifies elements attached
to 2 events among the detected ones: one as pos-
itive and the other as negative. First, the user
was asked to classify the first listed event s/he
considers it fully contains positive or negative
tweets. The system enables the classification of
all the tweets attached to an event as positive or
negative with one click. In our data set, 16560
tweets were annotated In this case, the 8th event
in Table 1 was annotated as positive (with 16560
tweets), while the 3rd one was classified as nega-
tive (10006 tweets).
• Scenario 2. The user classifies all the events de-
tected. At least, one of the events must be marked
as positive. In this case, the 8th event was the only
positive, and the remaining events were annotated
as negative. A total of 16560 tweets were classi-
fied as positive, while 49195 as negative.
In all the cases, the user can consider the event’s
main words, the related words, the main image for
each cluster and also the main bi-grams in the top-
20 bi-grams to make a decision on the category to
choose.
The initial classification in both scenarios resulted
in partially classified datasets. Table 2 shows both
scenarios with their description, the number of clicks
WEBIST 2019 - 15th International Conference on Web Information Systems and Technologies
156

Table 1: Detected events (2017).
ID Main keyword
Image cluster
count
Tweet count
1
cancelled, france, market, security, christmas,
budget
344 24343
2 bir, yedi, milyon, dolar, gente, apoya, psc 5 6805
3
bruselas, ladrones, banda, boicoteando, gente,
apoya, psc, el, sepa, mientras, marcha
90 10006
4 toda 0 4040
5 ramoncotarelo 82 9821
6 basu... 82 9819
7 esta 90 9998
8 lumi
`
eres, f
ˆ
ete 412 16560
9 ya
˘
ghaz 46 7039
10 actufoot 27 5371
spent on the initial classification, the percentage of
classified documents (P) in the dataset after the initial
classification, the percentage of positives on P, and
the initial accuracy and precision at the beginning of
the process. This precision and accuracy are calcu-
lated on the results of a classifier trained with the ini-
tially classified elements over the remaining unclas-
sified ones. We can notice that for this dataset, the
precision is already very high.
4.3 Assisted Classification with Active
Learning
After conducting the initial classification for each sce-
nario, we run the AL algorithm with two sampling
methods. The former will be referred to as method
“A” and the latter as method “B”. The method “A” is
the control method (using Uncertainty Sampling) and
it was executed only once for each scenario, while the
method “B” is the experimental method and was exe-
cuted 21 times covering all possible combinations of
weights (for the position on the distance to the hy-
perplane, the top duplicated content, and the top bi-
grams), using all multiples of 0.2 between 0 and 1.
We pick the configuration with the lower average and
standard deviation of clicks that better fit both scenar-
ios: “80·0·20”. This is to say that the weight on the
score on the duplicated content was ignored, and just
a 20% on the score in regard to the top bigrams. In
both cases, the experimental and the control methods,
the number of query samples the user should validate
in each loop was 20, but as we provide them with their
predicted value already assigned in the interface, we
just counted the clicks required to correct them –if
required–. We also fixed the number of top-elements
in the rankings of bi-grams and duplicated content,
which was 500.
One of the goals of this experiment was to ana-
lyze if there is an impact on the number of clicks,
accuracy and precision of the AL process when re-
sorting a certain amount of samples got by the Uncer-
tainty Sampling method by considering the presence
of top bi-grams and duplicated content (in the sam-
pling strategy) on them. This, with the aim of choos-
ing those documents with the lower certitude of pre-
diction but, at the same time, with the higher impact
on the descriptions of the documents still remaining
to annotate. Table 3 presents the results on the control
method (Uncertainty Sampling using the distance to
the hyperplane) on both scenarios. For each scenario,
it presents the “Min. ∆ accuracy reached at loop”:
the number of the first loop after which the accuracy
varied less than Min. ∆, followed by the number of
required clicks in the AL process until such point.
Then, it shows the same information concerning the
“Min. ∆ precision reached at loop”. Finally, it reports
the achieved accuracy and precision, as well as the
number of required clicks for the whole AL process,
achieved at loop #100.
Results concerning the 100 loops on accuracy (b,
d) and precision (a, c) are presented in relation to the
number of clicks in Fig.4 and Fig.5 for Scenario 1,
and in Fig.6 and Fig.7 for Scenario 2. The graphs
allow observing if the results of the control method
overcome the results of our experimental method.
As you can observe in the Figure, the experimental
method improves –in a small percentage– the results
of the control method concerning accuracy in both
scenarios, and precision just in the second scenario.
The precision of the first scenario is not completely
overcome, but after 150 clicks it has similar results
as the control method, and it ends up with almost the
same precision on the loop 100 (0,997 on the exper-
imental method, vs 0,9968 on the control method),
achieved with 244 clicks less than the control method.
CATI: An Active Learning System for Event Detection on Mibroblogs’ Large Datasets
157
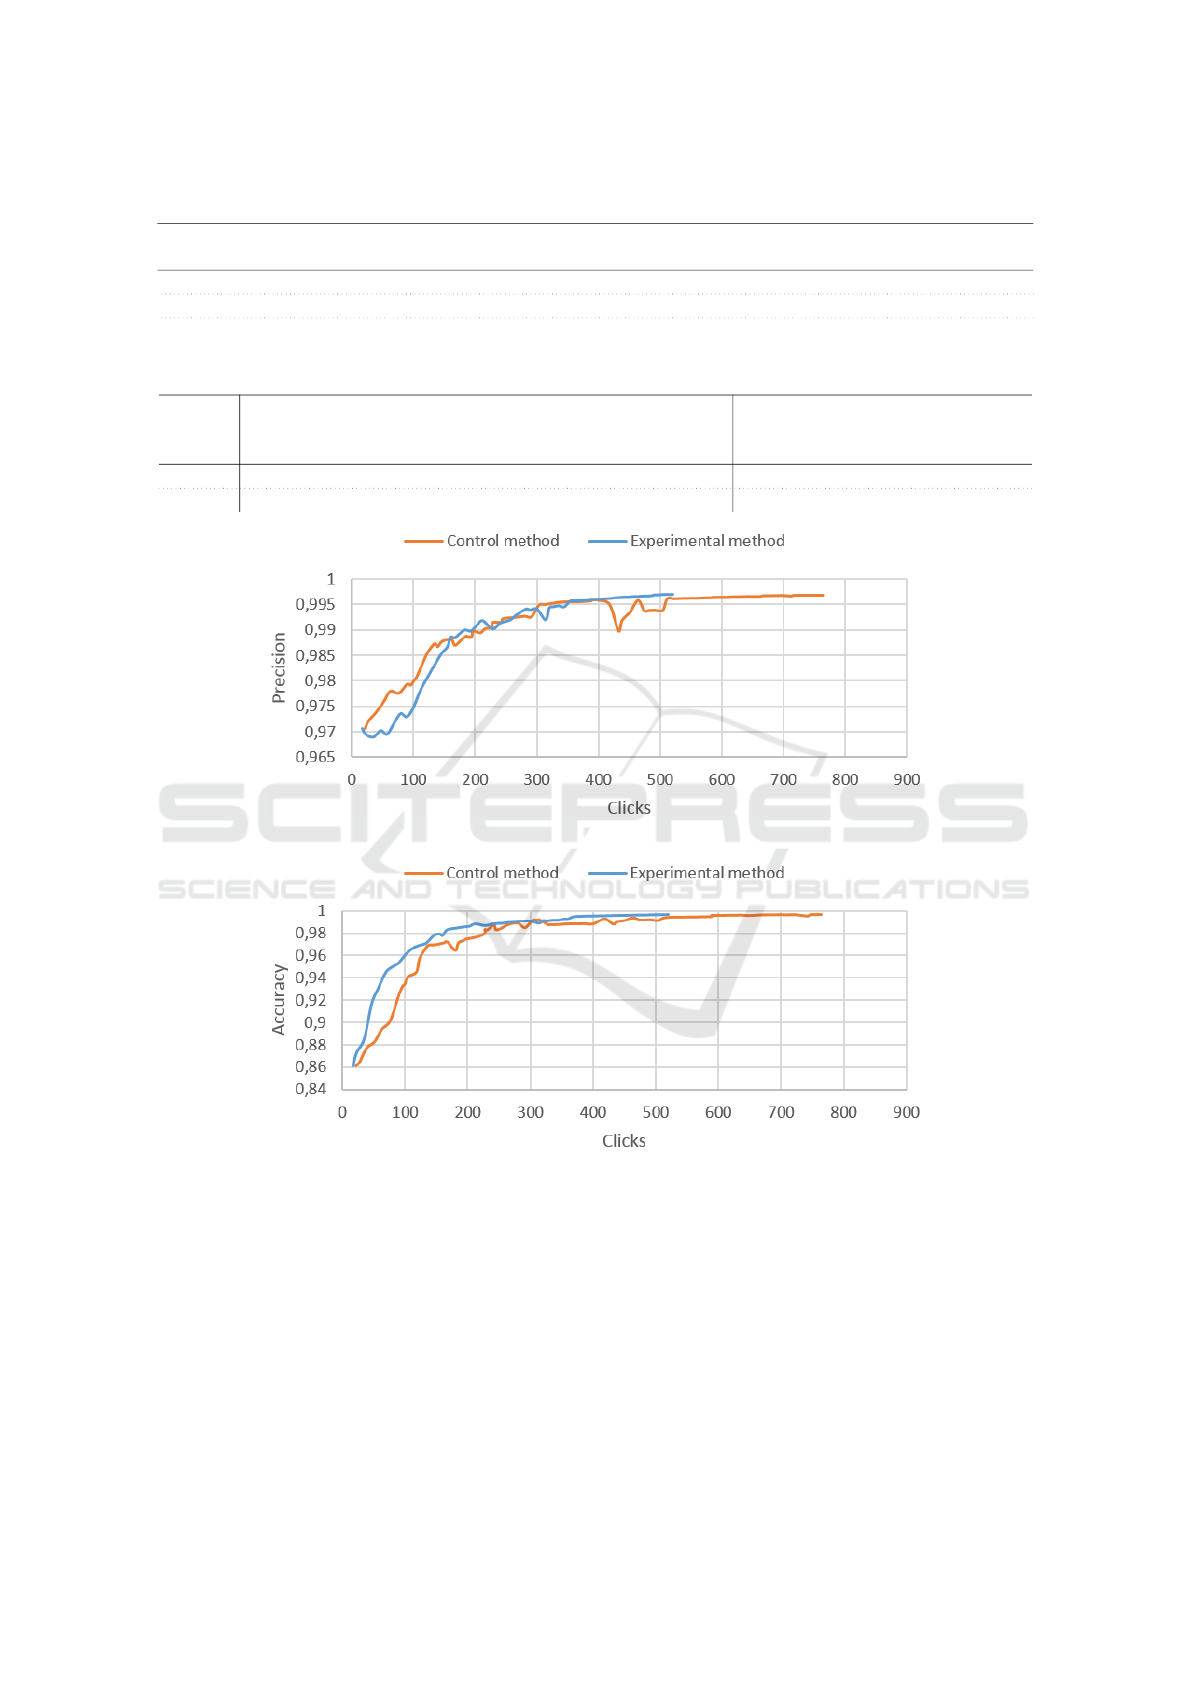
Table 2: Initial classification.
Sce-
nario
Description
Initial
clicks
% of dataset
classified (P)
% of positives
on P
Initial
accuracy
Initial
precision
1 2 events 9 20.95 45.73 0.861 0.971
2 All events 21 38.75 25.19 0.907 0.907
0.894 0.982
Table 3: Results on the scenarios with the Uncertainty Sampling.
Sce-
nario
Min. ∆ accuracy
reached at loop
Re-
quired
clicks
Min. ∆ precision
reached at loop
Re-
quired
clicks
Accuracy
at loop
#100
Precision
at loop
#100
Re-
quired
clicks
1 15 (0.969) 130 27 (0.992) 222 0.996 0.996 755
2 49 (0.988) 494 37 (0.985) 377 0.997 0.997 728
Figure 4: Precision by clicks for Scenario 1.
Figure 5: Accuracy by clicks for Scenario 1.
Regarding the number of clicks, the number is im-
proved for both scenarios. This is to say that the total
number of good predictions is better in the experimen-
tal method than in the control method, since the extra
clicks are from the interaction to correct the annota-
tion on the 20 samples on each loop. The total num-
ber of required clicks for Scenario 1 using the experi-
mental method (at loop 100) is 520 against 764 of the
control method; while in Scenario 1 there were 530
clicks required for the experimental method and 749
for the control method. And given the improved val-
ues on accuracy on both scenarios and on precision
in one scenario, as well as the avoided of significant
peaks in all the cases, it would be beneficial for the
end users to choose the experimental method to clas-
sify their datasets.
WEBIST 2019 - 15th International Conference on Web Information Systems and Technologies
158
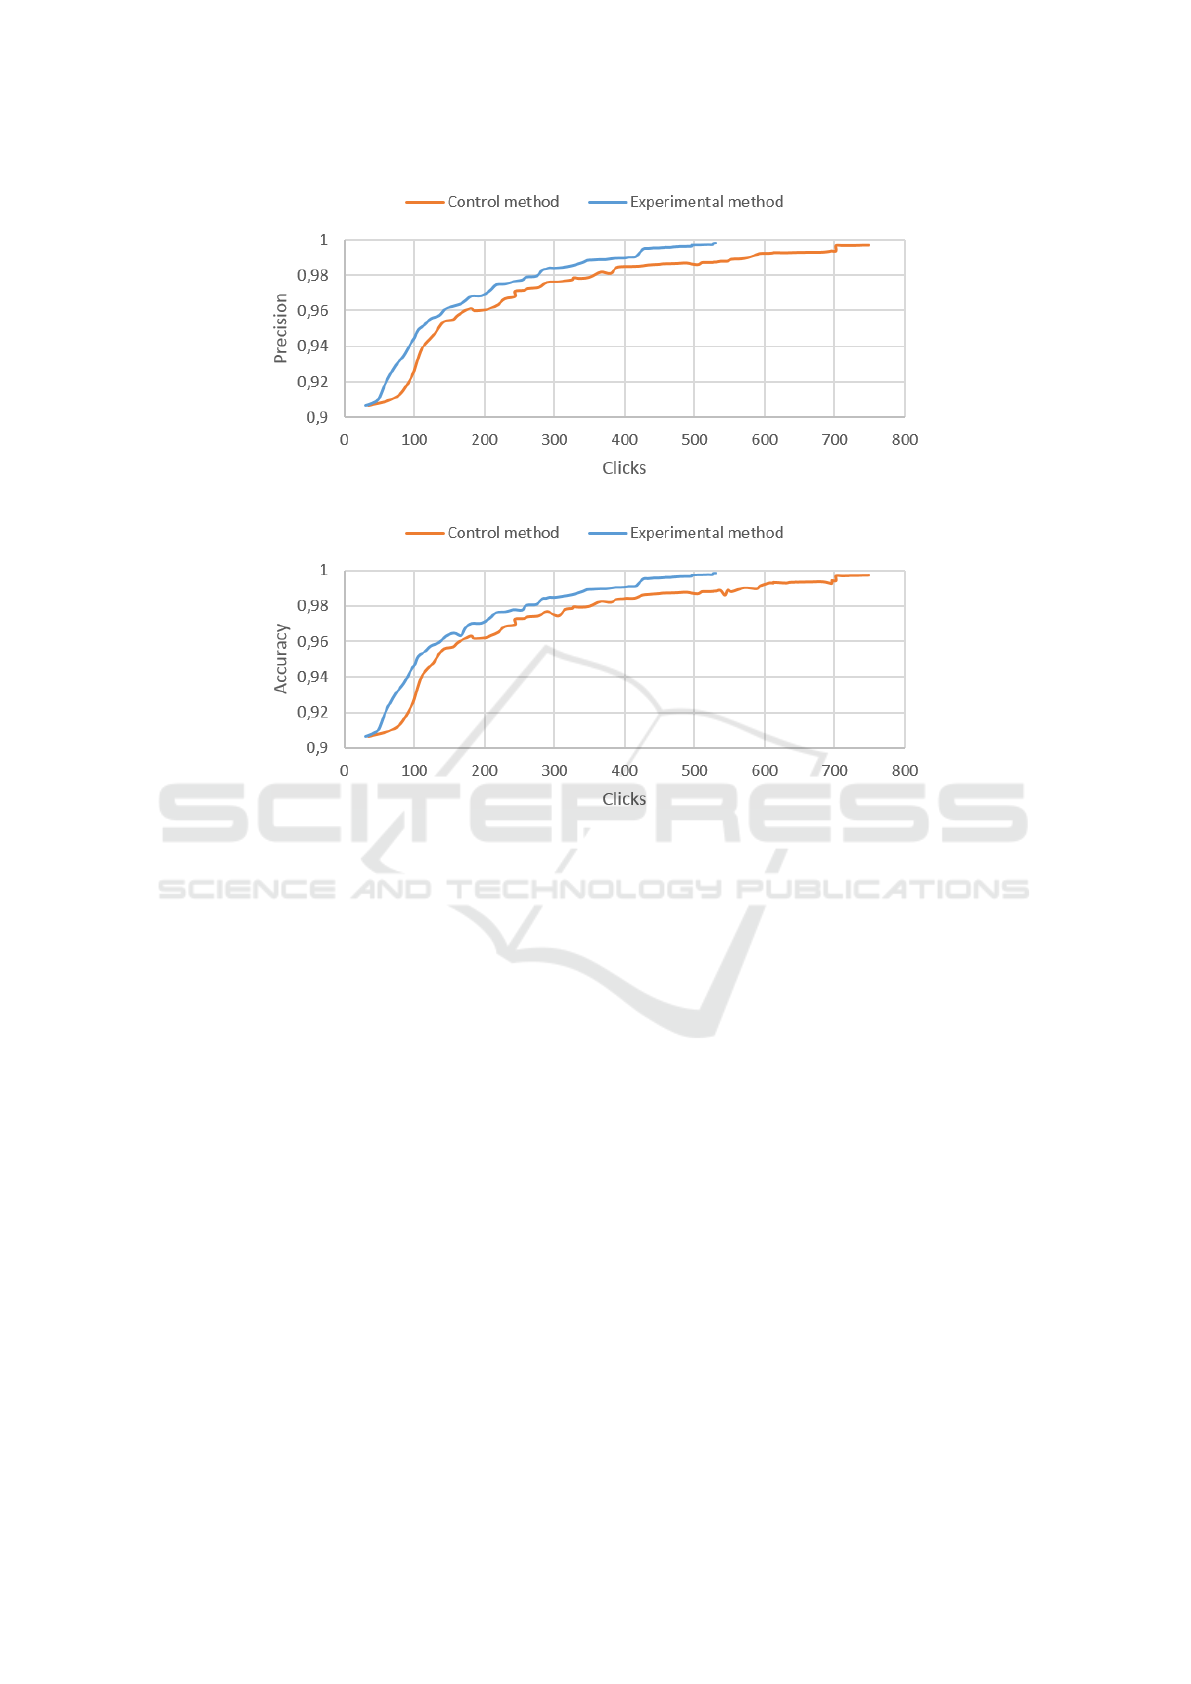
Figure 6: Precision by clicks for Scenario 2.
Figure 7: Accuracy by clicks for Scenario 2.
5 CONCLUSIONS AND FURTHER
WORK
This article presents a pipeline and a supporting plat-
form for assisting end users in the classification of
large datasets. The process is carried out in 3 phases,
in which different methods can be used. The first
phase concerns preprocessing methods to cluster an
initial amount of clicks and we carried it out by con-
sidering the documents’ textual content and the image
content; the second phase comprises an initially as-
sisted annotation and we did it following two differ-
ent scenarios; the last phase is the AL based classifi-
cation refinement. For evaluation purposes, we intro-
duced a new sampling strategy that includes the rank-
ing of duplicate content and frequent bi-grams in the
final query selection process. The evaluation shows
that CATI can help classify a (very) large dataset of
timestamped documents, eventually containing also
images, within a reasonable number of clicks.
Concerning the proposed sampling strategy, al-
though the use of bigrams and duplicate content has
little influence on the accuracy and precision when
selecting the best samples, but it could allow an im-
provement in the number of required clicks on the
process. It remains to check the effect of duplicate
content if after each user interaction we move not only
the classified document but all the documents with ex-
actly the same or similar content to the training set,
avoiding also the possibility of asking the user to clas-
sify the “same content” on different loops.
Evaluating CATI in more scenarios, with more
datasets, other models and features for AL is part of
our future work. Providing new visual metaphors to
validate the results and extending the initial classifi-
cation strategies is also a short term perspective. At
the time of writing this article, we are developing two
new classifiers: a first one based on the geo-location
of the documents (if any), and a second one based on
temporal features.
ACKNOWLEDGEMENTS
This project is supported by LABEX IMU un-
der the project IDENUM: Identit
´
es num
´
eriques ur-
baines. http://imu.universite-lyon.fr/projet/idenum-
identites-numeriques-urbaines
CATI: An Active Learning System for Event Detection on Mibroblogs’ Large Datasets
159

REFERENCES
Bontcheva, K., Derczynski, L., Funk, A., Greenwood,
M. A., Maynard, D., and Aswani, N. (2013). TwitIE:
An Open-Source Information Extraction Pipeline for
Microblog Text. In Proceedings of the International
Conference Recent Advances in Natural Language
Processing, pages 83–90.
Cai, H., Yang, Y., Li, X., and Huang, Z. (2015). What are
Popular : Exploring Twitter Features for Event Detec-
tion , Tracking and Visualization. In Proceedings of
the 23rd ACM international conference on Multime-
dia, pages 89–98.
Cunningham, H., Maynard, D., and Bontcheva, K. (2011).
Text processing with gate. Gateway Press CA,
Sheffield, UK.
Firas Odeh (2018). Event detection in heterogeneous data
streams. Technical report, Lyon.
Gaillard, M. and Egyed-Zsigmond, E. (2017). Large scale
reverse image search-A method comparison for al-
most identical image retrieval. In INFORSID, pages
127–142.
Gobbel Dr, G. T., Garvin, J., Reeves, R., Cronin, R. M.,
Heavirland, J., Williams, J., Weaver, A., Jayarama-
raja, S., Giuse, D., Speroff, T., Brown, S. H., Xu, H.,
and Matheny, M. E. (2014). Assisted annotation of
medical free text using RapTAT. Journal of the Ameri-
can Medical Informatics Association, 21(5):833–841.
Guille, A. and Favre, C. (2014). Mention-anomaly-based
Event Detection and tracking in Twitter. In ASONAM
2014 - Proceedings of the 2014 IEEE/ACM Interna-
tional Conference on Advances in Social Networks
Analysis and Mining, pages 375–382.
Hardeniya, N., Perkins, J., Chopra, D., Joshi, N., and
Mathur, I. (2016). Natural Language Processing:
Python and NLTK. Packt Publishing Ltd, Sebastopol,
CA.
Honnibal, M. and Montani, I. (2017). spacy 2: Natural lan-
guage understanding with bloom embeddings, convo-
lutional neural networks and incremental parsing.
Hu, X., Tang, J., Gao, H., and Liu, H. (2013). ActNeT: Ac-
tive Learning for Networked Texts in Microblogging.
Katragadda, S., Virani, S., Benton, R., and Raghavan, V.
(2016). Detection of event onset using Twitter. In
Proceedings of the International Joint Conference on
Neural Networks, pages 1539–1546.
Lieberman, H., Patern
`
o, F., Klann, M., and Wulf, V. (2006).
End-User Development: An Emerging Paradigm. In
Lieberman, H., Patern
`
o, F., and Wulf, V., editors, End
User Development, chapter 1, pages 1–8. Springer
Netherlands, Dordrecht.
Makki, R., Carvalho, E., Soto, A. J., Brooks, S., Oliveira,
M. C. F. D., Milios, E., and Minghim, R. (2018). ATR-
Vis: Visual and Interactive Information Retrieval for
Parliamentary Discussions in Twitter. ACM Transac-
tions on Knowledge Discovery from Data, 12(1):33.
McCallum, A. (2002). MALLET: A Machine Learning for
Language Toolkit. http://mallet.cs.umass.edu.
Miller, B., Linder, F., and Mebane Jr, W. R. (2018). Active
Learning Approaches for Labeling Text. Technical re-
port, University of Michigan, Ann Arbor, MI.
ˇ
Reh
˚
u
ˇ
rek, R. and Sojka, P. (2011). Gensim - Statistical Se-
mantics in Python. In EuroScipy.
Settles, B. (2009). Active learning literature survey. Techni-
cal report, University of Wisconsin-Madison Depart-
ment of Computer Sciences.
Spina, D., Peetz, M.-H., and de Rijke, M. (2015). Active
Learning for Entity Filtering in Microblog Streams.
pages 975–978. ACM New York.
Trivedi, G., Pham, P., Chapman, W. W., Hwa, R., Wiebe,
J., and Hochheiser, H. (2018). NLPReViz: An inter-
active tool for natural language processing on clinical
text. Journal of the American Medical Informatics As-
sociation, 25(1):81–87.
WEBIST 2019 - 15th International Conference on Web Information Systems and Technologies
160
