
Soccer Players’ Agility: Complex Laboratory Testing for Differential
Training
Anna Zakharova
a
, Kamiliia Mekhdieva
b
, Vasiliy Krasilnikov and Varvara Timokhina
c
Institute of Physical Education, Sports and Youth Policy, Ural Federal University Named after the First President of Russia
B.N. Yeltsin, 19 Mira Street, Yekaterinburg, Russia
Keywords: Soccer Players, Agility, Laboratory Testing, Agility Structure.
Abstract: The aim of the proposed study was to evaluate parameters of quickness, coordination and speed that influence
the specific agility in soccer. Twenty-four young healthy male soccer players born in 2004 (mean age 14.7 ±
0.7 years) underwent complex laboratory testing including anthropometric measurements, simple and
complex visual-motor reaction (VMR), Tapping test, cycling Wingate test and FitLight-trainer tests. Obtained
data allowed to estimate speed and power abilities of soccer players, as well as establish interrelations between
the measured parameters throughout the tests. Six soccer players demonstrated excellent ability to work in
conditions that require high concentration and speed of switching attention (complex VMR < 270 ms) and 4
athletes (complex VMR > 320 ms) – poor level. Results of Wingate test showed, that studied athletes had
sufficient power abilities of lower extremities for soccer players in respect to their age (PP/kg – 12.56 ± 3.38
W/kg). 16.7 % (n=4) of athletes showed high results in all FitLight tests. The suggested system of laboratory
tests for evaluation of agility structural components so important in soccer, allowed to emphasize athlete’s
weaknesses in order to improve it. Thus, testing of non-planned agility should include at least simple and
complex reaction rate, coordination tests and speed-and-strength abilities evaluation.
1 INTRODUCTION
Agility is recognised as one of the most important
ability in team sports. Athlete’s speed, coordination
and ability to act fast are interrelated and together
they provide such complex quality as agility.
Agility is an important quality in soccer which
significantly contributes to success in sports
achievements (Sekulic, 2015; Young, 2015). In
soccer, as in many other team sports, constant
changes in the environment (alterations in the ball
position, co-players and opponents) require particular
actions from the players, such as pre-planned motor
responses, coordination of body segments and
anticipating actions coming from rapidly changed
complex sensorial information (Lage, 2011).
Based on mention above it is critically important
for a soccer player to have a constants readiness to
motor response to unpredictably occuring signals.
A number of experimental studies have reported
sufficient cognitive and motor abilities in elite team
a
https://orcid.org/0000-0002-8170-2316
b
https://orcid.org/0000-0003-2967-2655
c
https://orcid.org/0000-0003-3239-5038
sports athletes, who are able to modulate their
cognitive and motor resources in response to task
demands (Zwierko, 2014). Meanwhile, there is lack
of data on evaluation of this quality in young soccer
players, as well as methods of complex testing for
further application in training process amendments.
According to N.A. Bernshtein, 1991 agility (or
coordination) is a complex, reliable and universal
quality which is in close connection with speed,
motor inventiveness and mental quickness.
Based on mentioned above, the aim of the
proposed study was to design a number of diagnostic
tests to determine agility structure components in
young soccer players in order to improve their soccer
performance.
An ability to act quickly in unpredictable
conditions depends upon reaction time in response to
visual or other stimuli, speed of mental analysis and
following decision making, locomotion start and
speed-and-strength ability to move as fast as
necessary. So in our research we were focused on
90
Zakharova, A., Mekhdieva, K., Krasilnikov, V. and Timokhina, V.
Soccer Players’ Agility: Complex Laboratory Testing for Differential Training.
DOI: 10.5220/0008166700900096
In Proceedings of the 7th International Conference on Sport Sciences Research and Technology Support (icSPORTS 2019), pages 90-96
ISBN: 978-989-758-383-4
Copyright
c
2019 by SCITEPRESS – Science and Technology Publications, Lda. All rights reserved

those parameters of quickness, coordination and
speed that influence the specific agility in soccer.
2 ORGANIZATION AND
METHODS
Subjects: Twenty-four young healthy male soccer
players born in 2004 (mean age 14.7 ± 0.7 years,
height 171.05 ± 6.08 cm, weight 60.65 ± 11.7 kg)
were recruited for the study. Participants were
members of junior soccer team “Sinara”
(Yekaterinburg, Russia) that was the winner of the
youth futsal championship of Russia in 2018.
2.1 Anthropometric Measurements
Estimation of anthropometric data, body
composition, height, lean muscle mass (absolute and
relative values), body fat component and BMI are
widely used in practical training practice and
research.
Weight and detailed segment body composition
data were measured with the use of MC-980MA Plus
Multi Frequency Segmental Body Composition
Monitor (TANITA, Japan) based on the advanced
Bioelectric Impedance Analysis (BIA) technology.
The following parameters were analyzed: body mass
(kg), body mass index (BMI, kg/m
2
), muscle mass –
absolute and relative values (kg; %), absolute and
relative fat mass (kg; %), fat free mass (kg), bone
mass (kg), separately lean mass of the trunk, upper
and lower extremities (kg).
2.2 Psycho-physiological Tests
The computer complex "NS-PsychoTest"
("NeuroSoft”, Russia) was used for evaluation of
psychophysiological features of the athletes’ nervous
system. The choice of diagnostic psycho-
physiological methods was determined by the nature
of sports agility. For latent simple reaction time
simple visual-motor reaction test was conducted. For
evaluation of an ability to act in situation of choice
test of complex visual-motor reaction was selected.
Tapping-test was conducted to assess the ability
of nervous system to perform frequent movements
and intensive quick work.
2.2.1 Simple Visual-motor Reaction
During testing of a simple visual-motor reaction 30
red light signals were activated consistently to
athletes. The signals appear at a different time
interval. When a signal appears, the examinee must
press the button with a finger as soon as possible,
trying to avoid mistakes such as a prematurely
pressing of the button or a skip of the signal.
The following indicators were determined:
1. Time of visual-motor reaction and subject’s quality
of the reaction to the stimulus (M, ms);
2. Equilibrium of nerve processes and stability of
sensorimotor reactions (SD, ms).
2.2.2 Complex Visual-motor Reaction
During testing of a complex visual-motor reaction 30
red and green light signals were activated randomly
to athletes. The athletes were instructed to react only
to red light with pressing the button and do nothing in
case of green signal occurrence. Average time of
complex visual-motor reaction (M, ms) and standard
deviation (SD, ms) were determined as well as a
number of mistakes (missed signals or prepressing of
button).
2.2.3 Tapping Test
Express-method Tapping test is reflecting overall
performance and strength of the nervous processes.
The test was carried out using two special
instruments: “pencil” and “a rubber platform”. The
athlete was instructed to tap the platform with the
maximum possible frequency for 30 seconds.
Processing of the results was made by counting
the number of movements performed in each of the
five-second intervals of the test.
Two indicators obtained in the test were taken for
analysis: the number of taps made during 30 seconds
and the maximal number made in any five second
interval.
2.3 Cycling Wingate Test
Cycling Wingate test was performed with the use of
the ergometer Monark Ergomedic 894E Peak Bike
(Monark, Sweden). Power and speed abilities were
evaluated during leg cycling Wingate anaerobic test
by means of the device producer protocol provided.
Before the test athletes were familiarized with the
technique of the test and given comprehensive
instructions on the procedure. The positions of
handlebar and cycle seat were adjusted in accordance
with athletes’ height and length of the extremities.
Foots were fixed in the pedals with straps. Based on
recorded data on the age, gender and weight of tested
player the required weight of the basket was
calculated automatically by the system (7.5 % of body
weight). The protocol of the test allowed to set the
Soccer Players’ Agility: Complex Laboratory Testing for Differential Training
91
moment of basket drop. Each test started from the
pre-test warming-up pedaling with recommended
cadence of 50 rpm. After the command “Go!” an
athlete had to speed-up and at reaching 80 rpm, the
basket dropped and test started. Before the test all
subjects had sufficient for power testing warming up.
From the beginning of the test power and speed
parameters were fixed automatically in the PC with
pre-installed Monark software, connected with the
ergometer through a serial cable. The following
parameters were selected for ongoing analysis: peak
power (PP, W), average power (AP, W) and their
relative values PP (PP/kg, W/kg) and AP
30
/kg, W/kg),
maximum attained cadence (rpm) and time of PP
attained.
2.4 Fitlight-trainer Test
For soccer players agility estimation a FitLight
TrainerTM (FitLight Sports Corp., Canada) was used.
Two different test protocols were designed for the
research.
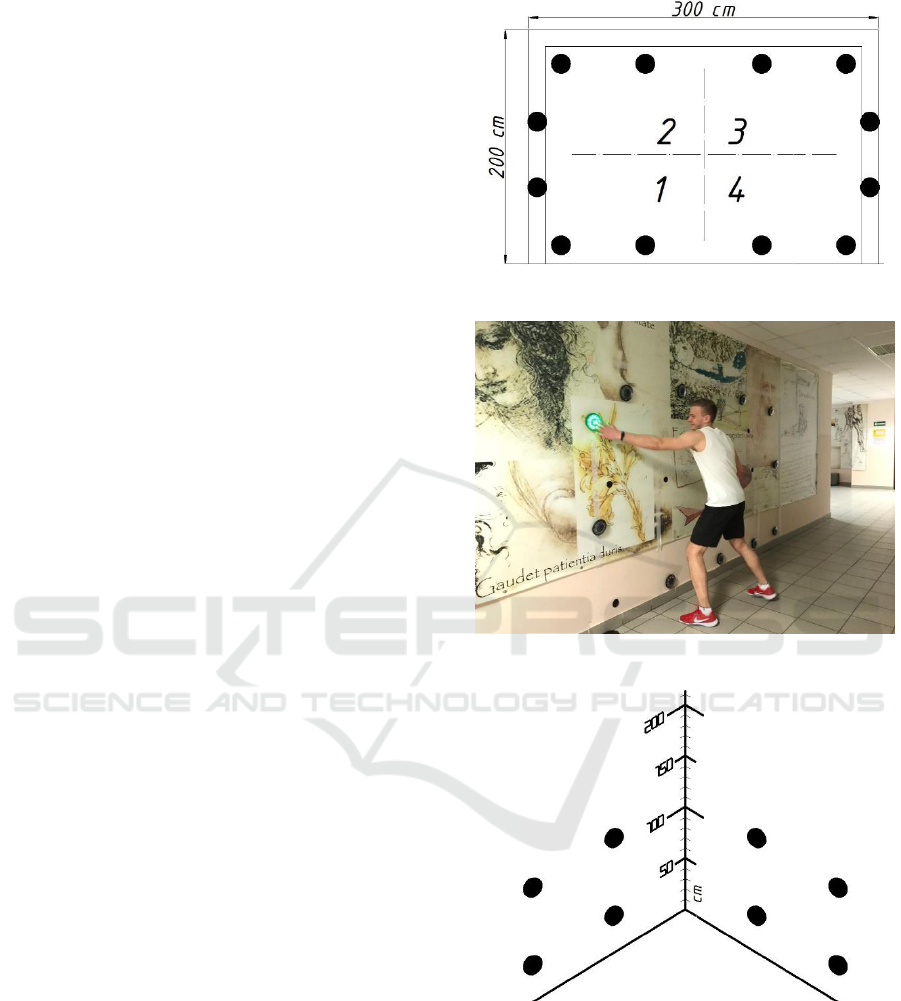
The first one was created for goalkeepers: 12
wireless light discs with a diameter of 10 cm were
placed on the wall in the square of 3000x2000 as the
area of the futsal or handball gate (Fig. 1). The light
disks were grouped into 4 sectors, 3 lamps in each
according to the scheme shown in the Figure 1.
Participants were instructed to deactivate the lights as
fast as possible by placing a hand or a leg in close
proximity (deactivation distance was set at 20 cm) to
the activated light (Fig.2). Maximum duration of the
light stimulus (time out of light if light was not de-
activated as required) was programmed for 2 seconds
for this test. Light disks activated randomly during 30
seconds during the trial. The analysis concerned the
amount of deactivated light disks and the average
response time to stimuli in the test as well as average
response time to each square sector.
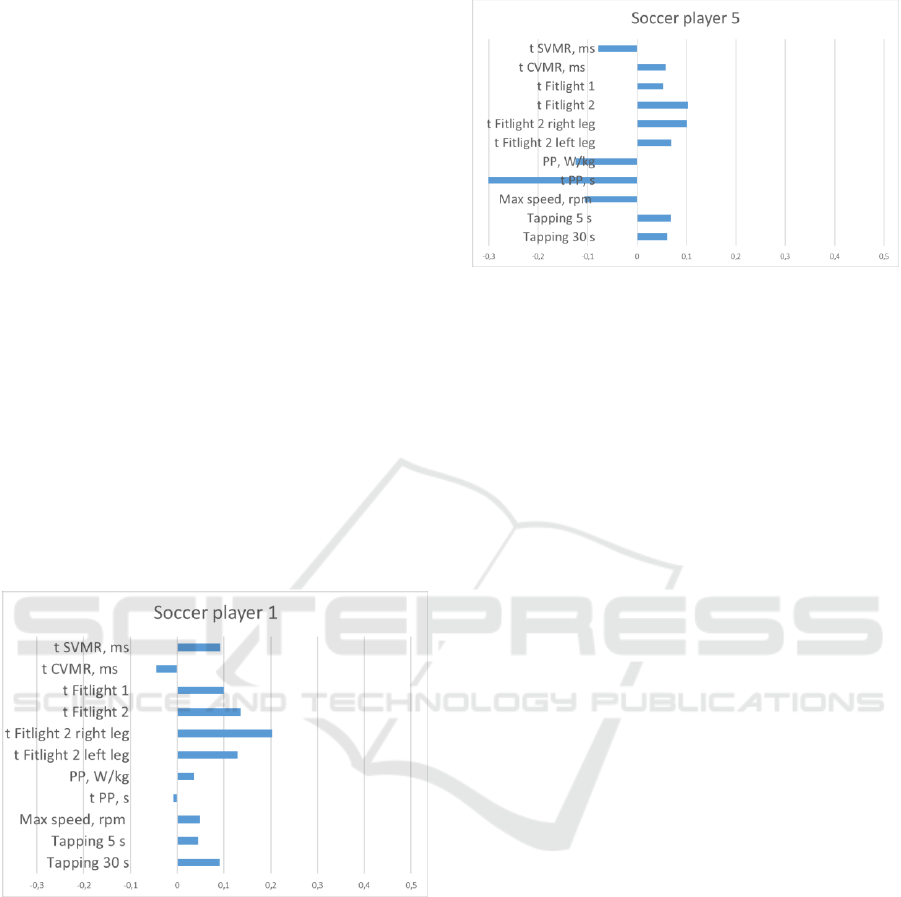
The second test was designed for soccer players
and included 8 light disks placed on two neighbor
walls (Fig. 3 and 4) deactivated with legs only.
Parameters of test protocol were as in the described
above test 1: duration 30 seconds, 20 cm and 2 sec
were deactivation distance and time out of light
respectively. Average response time to stimuli and
amount of deactivated light were under analysis.
The soccer players performed 3 trials. Results of
the best one were under consideration.
Figure 1: Light disk layout for FitLight trainer test 1.
Figure 2: Station for the FitLight trainer test 1.
Figure 3: Light disk layout for FitLight trainer test 2.
icSPORTS 2019 - 7th International Conference on Sport Sciences Research and Technology Support
92
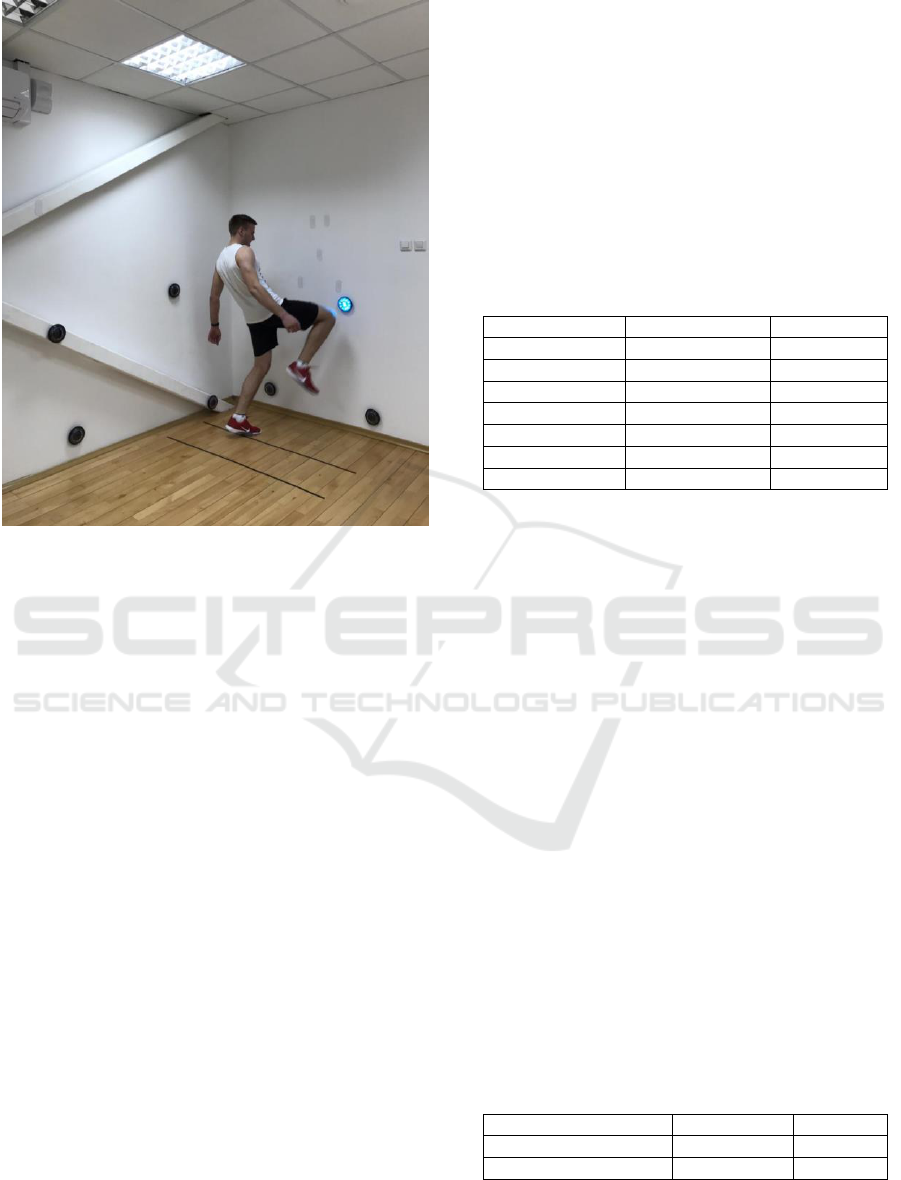
Figure 4: Station for the FitLight trainer test 2.
2.5 Statistical Analysis
Statistical analysis was performed with the use of
statistic software package “SPSS Statistics 23.0”
(IBM). We used descriptive analysis of the obtained
data in order to estimate basic functional status of
athletes. Normality of distribution was assessed by
the Shapiro-Wilk test. Mean value (M), standard
deviation (SD), minimum and maximal values of the
measured parameters were calculated. To estimate
possible interrelations between measured parameters
in different tests correlative analysis (Pearsons
correlations) was applied.
As the FitLight trainer test is a new technology
supporting “testing and training” in sport there were
lack of data of optimal results. To establish the levels
of FitLight test agility (Table 5), level criteria was
calculated using the value of the normal M and the
deviation equal to ± 2/3 SD:
• Average level – the indicators in the range M
± 2/3 SD;
• Level above the average (high) the indicators
are greater than M + 2/3 SD;
• Level below the average (poor) – the
indicators are less than M - 2/3 SD.
3 RESULTS AND DISCUSSIONS
The obtained results of anthropometric measurements
of young soccer players (Table 1) show that studied
subjects had appropriate physical status in reference
to sports age and gender norms. In particular, high
values of lean mass and low values of fat component
were found. Taking into consideration specific
character of soccer, this type of body composition is
undoubtedly beneficial for athletes.
Table 1: Anthropometric and body composition data of
young soccer players.
Parameters
M±SD
min-max
Height, cm
171.1±6.1
158-182
Weight, kg
60.7±11.2
42-92
Muscle mass, kg
47.93±7.3
35-66
Muscle mass, %
79.5±3.3
71-84
Fat, kg
10.3±4.3
5-23
Fat, %
16.5±3.9
12-26
BMI, kg/m
2
20.6±2.7
17-28
BMI – body mass index.
Assessment of the level of speed abilities of young
soccer players was initially started with studying of
an elementary form of speed and agility – the latent
time of simple visual-motor reaction (simple VMR)
characterizing efficiency of activity of the
neuromotor mechanism (Platonov, 2004). In group of
the studied soccer players (n=24) the average value of
simple VMR on a red colour signal was 197.18±15.64
ms (Table 2). 5 subjects (20.8 %) had excellent VMR
(quicker than 180 ms). Optimum results for sports
activity in soccer (181<simple VMR <210 ms)
showed 14 athletes that is 58.24 %.
The research of complex visual-motor reaction
(Table 2) associated with simple VSR and mental
abilities to effective actions in limited time revealed
that average value of complex VMR (295.75 ms) was
within age norm as well as the reaction stability
(24.57). Six soccer players demonstrated excellent
ability to work in conditions that require high
concentration and speed of switching attention
(complex VMR < 270 ms) and 4 athletes (had
complex VMR time more than 320 ms (poor level).
Table 2: Simple and complex visual-motor reaction in
young soccer players.
Parameters
M±SD
(min-max)
Simple VMR t, ms
197.18±15.64
175 -239
Complex VMR t, ms
295.75±24.57
236-342
The nervous system workability by Tapping test
revealed that 16.67 % of soccer players had an
Soccer Players’ Agility: Complex Laboratory Testing for Differential Training
93

excellent ability to maintain the movement pace,
which means the effectiveness of the speed activity
for a long time. 79.17 % of the subjects showed a
good level and only 1 athlete (4.16 %) was
distinguished by rapid fatigue of the nervous system.
Analysis of cycling Wingate-test data allowed to
estimate power abilities of soccer players (Table 3).
On average, demonstrated peak power was higher
than one in 15 years old soccer-players (11.2 ± 0.76
W/kg reported by Jastrzębski, 2011), and 17 years old
soccer players (11.1 ± 0.9 W/kg ̶ by Chtourou, 2012).
Although, relative values of PP varied within a wide
range. This proves essential difference in the level of
preparedness of players and/or inherent power
abilities. Really only 3 soccer players demonstrated
PP higher than 13.5 W/kg (high level) while 5 had
poor level (less than 11.6 W/kg). The obtained results
show, that generally, studied athletes had sufficient
power abilities of lower extremities for soccer players
in respect to their age.
Table 3: Wingate-test parameters of soccer players.
Parameters
M±SD
min-max
PP, W
748.33±153.33
513-1661
PP/kg, W/kg
12.56±3.38
9-15
AP, W
512.43±96.64
366-772
AP/kg, W/kg
8.59±0.67
7-10
t
pp
, s
2.48±1.06
1-5
PP – peak power; AP – average power; t
pp
– time of PP
attainment.
Average power (AP, W/kg) in studied soccer-
players was within athletic norm (Zakharova, 2016)
and as high as it was revealed in soccer players aged
17 by Chtourou, 2012. Thus, we may conclude that
soccer-players demonstrated satisfied strength
endurance which is typical in team sports.
FitLight trainer test 1 (deactivation of signals with
hands and feet) revealed that average time of reaction
was considerably higher (Table 4) than in complex
VMR testing (Table 2).
Table 4: FitLight trainer test results in young soccer players.
Parameters
M±SD
(min-
max)
Test 1 reaction time, ms
896±52.14
802-995
Number of deactivated lamps
27±2.71
23-30
Test 2 reaction time, ms
919±91.78
739-469
Number of deactivated lamps
27±2.11
22-32
As these FitLight trainer tests were designed
especially for the research no results were at our
disposal. To establish the levels of FitLight test agility
(Table 6), level criteria was calculated using the value
of the normal M and the deviation equal to ± 2/3 SD
as depicted in statistic methods description.
Table 5: Levels of FitLight agility tests results for soccer-
players 14-15 years old.
High
Middle
Poor
Test 1 reaction
time, ms
< 680
680-930
> 930
Test 2 reaction
time, ms
< 680
680-980
> 980
FitLight trainer test 1 results revealed a high
reaction rate in 29.2 % (n=7) athletes. The average
and low reaction rates were registered in 50.0 %
(n=12) and 20.8 % (n=5) of the subjects, respectively.
Most athletes (54.2 %, n=13) showed the best result
during the second attempt.
According to the results of test 2, the data were
distributed as follow: high reaction rate in 25.0 %
(n=6), average reaction time in 62.5 % (n=15), low
reaction rate in 12.5 % (n=3) athletes. During this test,
the majority of athletes (58.4 %, n=14) showed the
best result during the third attempt.
Also, 16.7 % (n=4) of athletes have high results in
both tests.
The FitLight trainer software allowed to calculate
a segmental reaction time, that is, the response time
of the right and left hands and feet.
Observation of athletes during the FitLight trainer
tests allow to suggest that the differences between the
reaction rate of the right and left feet and as well as
hands induced by (i) motor asymmetry, (ii) low
and/or dissimilar flexibility in the right and left hip
joints, (iii) a violation of natural technique of
performing light deactivation (segment 1 by left foot,
segment 2 by left hand, segment 3 and 4 –by right
hand and foot, respectively).
Often the subjects tried to perform all the touches
with one hand, generally right. In addition, during the
test they oriented the body mainly to the left, thereby
losing sight of the sensors on the right. Subjects were
not specified how to fulfill the FitLight trainer test as
agility is the ability to move in an efficient and
effective manner.
Results of correlative analysis revealed significant
interrelations between athletes’ height and time of
complex VMR in psycho-physiological test (r = -
.532, P < 0.01), response time in FitLight-trainer test
(r = -.431, P < 0.05), as well as number of deactivated
signals (r = .454, P < 0.05). Additionally, we found
significant correlations between measured parameters
within the obtained tests: time of complex VMR
icSPORTS 2019 - 7th International Conference on Sport Sciences Research and Technology Support
94
correlated well with time of reaction time in FitLight-
test 1 (r = .423, P < 0.01) and number of deactivated
signals in FitLight-test 2 (r = -.462, P < 0.01).
Thus, the studied structural components of agility
in general are independent as they are associated with
different body structures and their functions. So each
of the component may limit the agility and in turn
require specific types of exercise to provide agility
development.
To demonstrate the agility structure of soccer
players we determined the most substantial indicators
measured throughout all laboratory tests. The
individual soccer player’s agility profile includes
(Figure 5) innate parameters of nervous system (time
of simple and complex visual-motor reaction),
general and specific coordination (reaction time in
FitLight trainer test 1 and 2 respectively), low
extremities motor symmetry/asymmetry (t FitLight 2
right and left leg), anaerobic power characteristics
(PP and time to PP attained) and a number of
frequency indicators: maximum attained cadence
(rpm) in cycling Wingate test and Tapping test data
(the maximal number of taps made in any five second
interval associated with motion rate performance and
number of taps made during 30 seconds).
Figure 5: Individual soccer player 1 agility profile.
The linear graph with deviation depicts positive
deviation (better than average value) and the degree
of excellence in the right part or backwardness and its
degree in the left part. So, one can see the strengths
and weaknesses of the athlete’s agility.
For example, soccer player 1 (Figure 5) have low
reaction rate in complex VMR while soccer player 5
(Figure 6) demonstrated poor simple reaction and
insufficient level of power abilities in legs (Wingate
test).
If you know the athlete’s weaknesses you are able
to amend it.
Figure 6: Individual soccer player 5 agility profile.
To improve simple reaction rate table tennis, aero-
hockey, various ball catching, reaction game and
motor tasks should be used.
To accelerate the complex reaction rate it is
advisable to read as fast as possible, watch videos at
1.25/1.5/2x speed, comment everyday events, just
like a TV commentator. The main idea of these tasks
promoting the brain to work intensively in time
trouble. Computer games also may be used for the
development of speed of reaction and thinking rate.
To show better results in FitLight trainer tests it is
necessary to analyze the reasons of poor performance
(hand-eye coordination, foot-eye coordination,
coordination of the body segments’ movement in
cooperation with the body's sensory functions or
other issues) and use the problem orientated exercises
to improve it along with FitLight training.
Detailed control of soccer players during FitLight
test 2 allowed to conclude that agility ladder in its
traditional format (laying on the floor) does not
develop 3d (space) coordination. So it is necessary to
design 3d agility ladder – to locate ladders on the
walls or to use the idea of FitLight – fix the targets in
accordance with the sports specifics.
In case of motor asymmetry in legs in football
players as shown in Figure 7 (marked out in ellipse)
it is important to work with non preferred leg. For
example, start strength exercises with it, pay more
attention to non preferred leg in agility motor tasks,
use it for shots and ball transition, etc.
So the suggested system of laboratory tests for
evaluation of agility structural components so
important in soccer, allowed to emphasize athlete’s
weaknesses in order to improve it thus developing
agility.
Soccer Players’ Agility: Complex Laboratory Testing for Differential Training
95
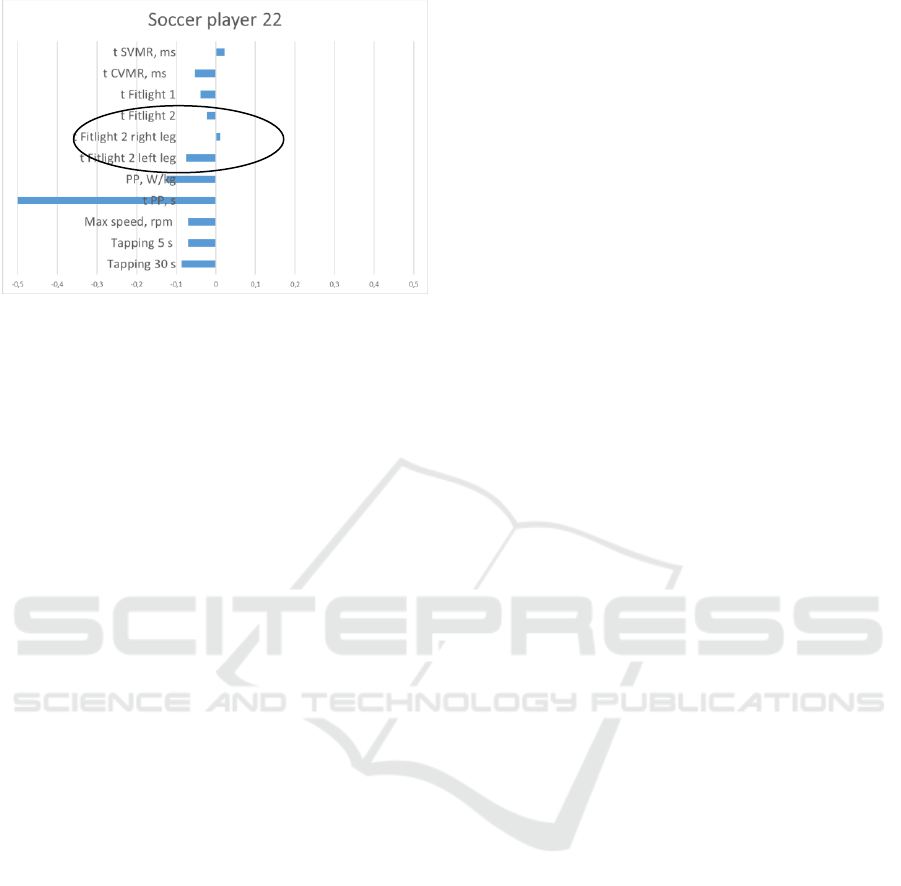
Figure 7: Individual soccer player 22 agility profile.
4 CONCLUSIONS
As agility performance is underpinned by physical
and cognitive attributes the following conclusions
may be done from the research:
1. Testing of non-planned agility should include at
least simple and complex reaction rate, coordination
tests and speed-and-strength abilities evaluation.
2. FitLight trainer is an effective training system at
the same time providing with accurate data on
reaction rate in close to competitive environment.
To compare FitLight trainer test results of athletes
all over the world it is necessary to standardize the
scheme of lamp locations according to sports
specifics.
3. Structuring of soccer players’ agility through
laboratory tests allowed to determine athlete’s
strengths and weaknesses to enhance agility
performance.
ACKNOWLEDGEMENTS
The work was supported by Act 211 Government of
the Russian Federation, contract # 02.A03.21.0006.
REFERENCES
Bernshtein, N.A., 1991. On co-ordination and its
development. Fizkultura i sport. Moscow.
Chtourou, H., Hammouda, O., Souissi, H., Chamari, K.,
Chaouachi, A., Souissi, N., 2012. Diurnal variations in
physical performances related to soccerin young soccer
players. Asian journal of sports medicine, 3(3), 139-
144.
Jastrzębski, Z., Barnat, W., Konieczna, A., Rompa, P.,
Radzimiński, Ł., 2011. Changes of physical capacity
and soccer-related skills in young soccer players within
a one-year training period. Baltic Journal of Health and
Physical Activity, 3(4), 248-261.
Lage, G.M., Gallo. L.G., Cassiano, G.S.M., Lobo, I.L.B.,
Viera, M.V., Salgado, J.V., Fuentes, D., Malloy-Diniz,
L.F., 2011. Correlations between impulsivity and
technical performance in handball female athletes.
Physiology, 2(7): 721-726.
Platonov, V.N., 2004. The system of athletes’ training in
the Olympic sport. General theory and its practical
applications. Olympic Literature. Kiev.
Sekulic, D., Pehar, M., Krolo, A., Spasic, M., Uljevic, O.,
Callega-Gonzalez, J., Sattler, T., 2015. Evaluation of
basketball-specific ability of preplanned and non
planned agility performances for differentiating playing
positions and playing levels. J Strength and Cond
Research, 31(8): 2278-2288.
Sheppard, J.M., Young W.B., Doyle T.L., Sheppard, T.A.,
and Newton, R.U., 2006. An evaluation of a new test
reactive agility and its relationship to sprint speed and
change of direction speed. J Sci Med Sport, 9: 342-349.
Young, W.B., Miller, I.R., and Tapley S.W. (2015).
Physical qualities predict change-of-direction speed but
not defensive agility in Australian rules football. J
Strength and Conditioning Research, 29(1): 206-212.
Zakharova, A.V., Berdnikova A.N., 2016. Monitoring of
Power Abilities in Young Soccer Players. Human.
Sport. Medicine, 16(4): 64-74.
Zwierko, T., Florkiewicz, B., Fogtman, S., Kszar-
Krzyzanowska, A., 2014. The ability to maintain
attention during visuomotor task performance in
handball players and non-athletes. Central European
Journal of Sport Science and Medicine, 7(3): 99-106.
icSPORTS 2019 - 7th International Conference on Sport Sciences Research and Technology Support
96
