
Low-cost Sonar based on the Echolocation
Thiago Moreira
1 a
, Jos
´
e Lima
2,3 b
, Paulo Costa
3 c
and M
´
arcio Cunha
1 d
1
Academic Department of Electronic, Federal University of Technology, Paran
´
a, Brazil
2
CeDRI - Research Centre in Digitalization and Intelligent Robotics, Polytechnic Institute of Braganc¸a, Braganc¸a, Portugal
3
INESC TEC - INESC Technology and Science and Faculty of Engineering of University of Porto, Porto, Portugal
Keywords: Object Detection, Echolocation, Sonar, Mobile Robot Navigation.
Abstract:
In the world of mobile robot navigation, the ultrasonic sensors stand out for presenting attractive features at
an affordable cost. The main problem in the use of these devices lies in the difficulty of correctly interpreting
the obtained data, which means that their efficiency is limited. This paper focuses on the improvement and
implementation of a low cost location system based on ultrasonic sensors. Through the combination of math-
ematical techniques and signal processing it is possible to make the system more accurate and reliable. The
developed system includes the data acquisition, the signal filtering, and the trigonometric methods to estimate
the coordinates of a target and can be assembled in a mobile robot.
1 INTRODUCTION
One of the great challenges of mobile robot naviga-
tion is the detection of targets and their location. Most
systems used to solve this task are vision based and
sensor (non-vision) based. In the first one, detec-
tion through cameras and image processing are sub-
ject to a lack of precision, which can arise as a result
of variation in environmental conditions like dark-
ness, foggy or low visibility (Patkar and Tasgaonkar,
2016). Moreover, the computational consumption and
the price of these systems are still high (Kreczmer,
2010).
The cost-effective of robots is an important fea-
ture to consider before the building process. To keep
their cost down, expensive sensors and devices should
be evaluated. In this way, ultrasonic sensor seems to
be suitable to deal with this problem (Wu and Tsai,
2001; Kim and Choi, 2008). It has proven to be very
efficient, economical and accurate (Lim et al., 2014).
Systems based on ultrasonic sensor have many
advantages over other methods. For example, in
applications that require reduced size the modules
can be very small without interfering in their perfor-
mance. In addition, it is capable of operating in sev-
a
https://orcid.org/0000-0002-6132-2914
b
https://orcid.org/0000-0001-7902-1207
c
https://orcid.org/0000-0002-4846-271X
d
https://orcid.org/0000-0001-7506-4488
eral environments in which other devices can not be
used (Kim and Choi, 2008).
In robotic applications, ultrasonic sensing is rarely
used beyond simple functions such as obstacles avoid-
ance. However, some works show just how useful
the sensor can be (Schillebeeckx et al., 2011; Popelka
et al., 2016). The best known example that use ul-
trasonic navigation are the bats. They’re able to
avoid obstacles even at high speeds when flying in the
dark (Cheeke, 2016). The main difference between
an ultrasonic range finder and the bat is that it has two
ears, which allows them to detect which direction the
echo comes from (Kreczmer, 2010).
The major drawback of this technique occurs due
to the wide beam of an emitted signal, causing a mis-
interpretation of the object’s real reflection. When
irregularities of the object surface are much smaller
than the wavelength of the signal, there is also the
called multiple reflection effect. The last event can
be noticed when successive measurements are per-
formed in a regular short time. In an attempt to avoid
this problem, a system containing two receivers and a
transmitter is required (Kreczmer, 2010).
Inspired by the echo location of the animals, this
paper proposes a low cost ultrasonic binaural system
based on accuracy techniques and discusses the diffi-
culties associated with the use of ultrasonic measure-
ments in indoor environments.
In section 2, the main distance estimation methods
are briefly described. In section 3, a review is made
818
Moreira, T., Lima, J., Costa, P. and Cunha, M.
Low-cost Sonar based on the Echolocation.
DOI: 10.5220/0008119108180825
In Proceedings of the 16th International Conference on Informatics in Control, Automation and Robotics (ICINCO 2019), pages 818-825
ISBN: 978-989-758-380-3
Copyright
c
2019 by SCITEPRESS – Science and Technology Publications, Lda. All rights reserved
about the conventional ultrasonic range system and
the binaural sensor system. In section 4, the architec-
ture of the proposed system is presented. In section 5,
the method of triangulation using ultrasonic sensors is
introduced. In section 6, the results of the experimen-
tal tests are reported. Finally, in section 7 the results
are discussed and conclusions drawn.
2 DISTANCE ESTIMATION
METHODS
The main approaches to determine the distance
through ultrasonic waves are given by the phase shift
and time-of-flight (TOF). The first strategy comprises
the continuous calculation of the phase shift between
the transmitted and received signal. However, this
strategy has a very narrow measurable range. The sec-
ond strategy, unlike the first one, allows to measure
greater distances and consists in determining the time
that a wave takes to reach the receiver. The transmit-
ter sends the sound waves to an object or obstacle and,
when it is detected, returns to the receiver (Huang and
Huang, 2009; Queir
´
os et al., 2006).
There are several methods for estimating the TOF,
in the following subsections the most common tech-
niques are presented.
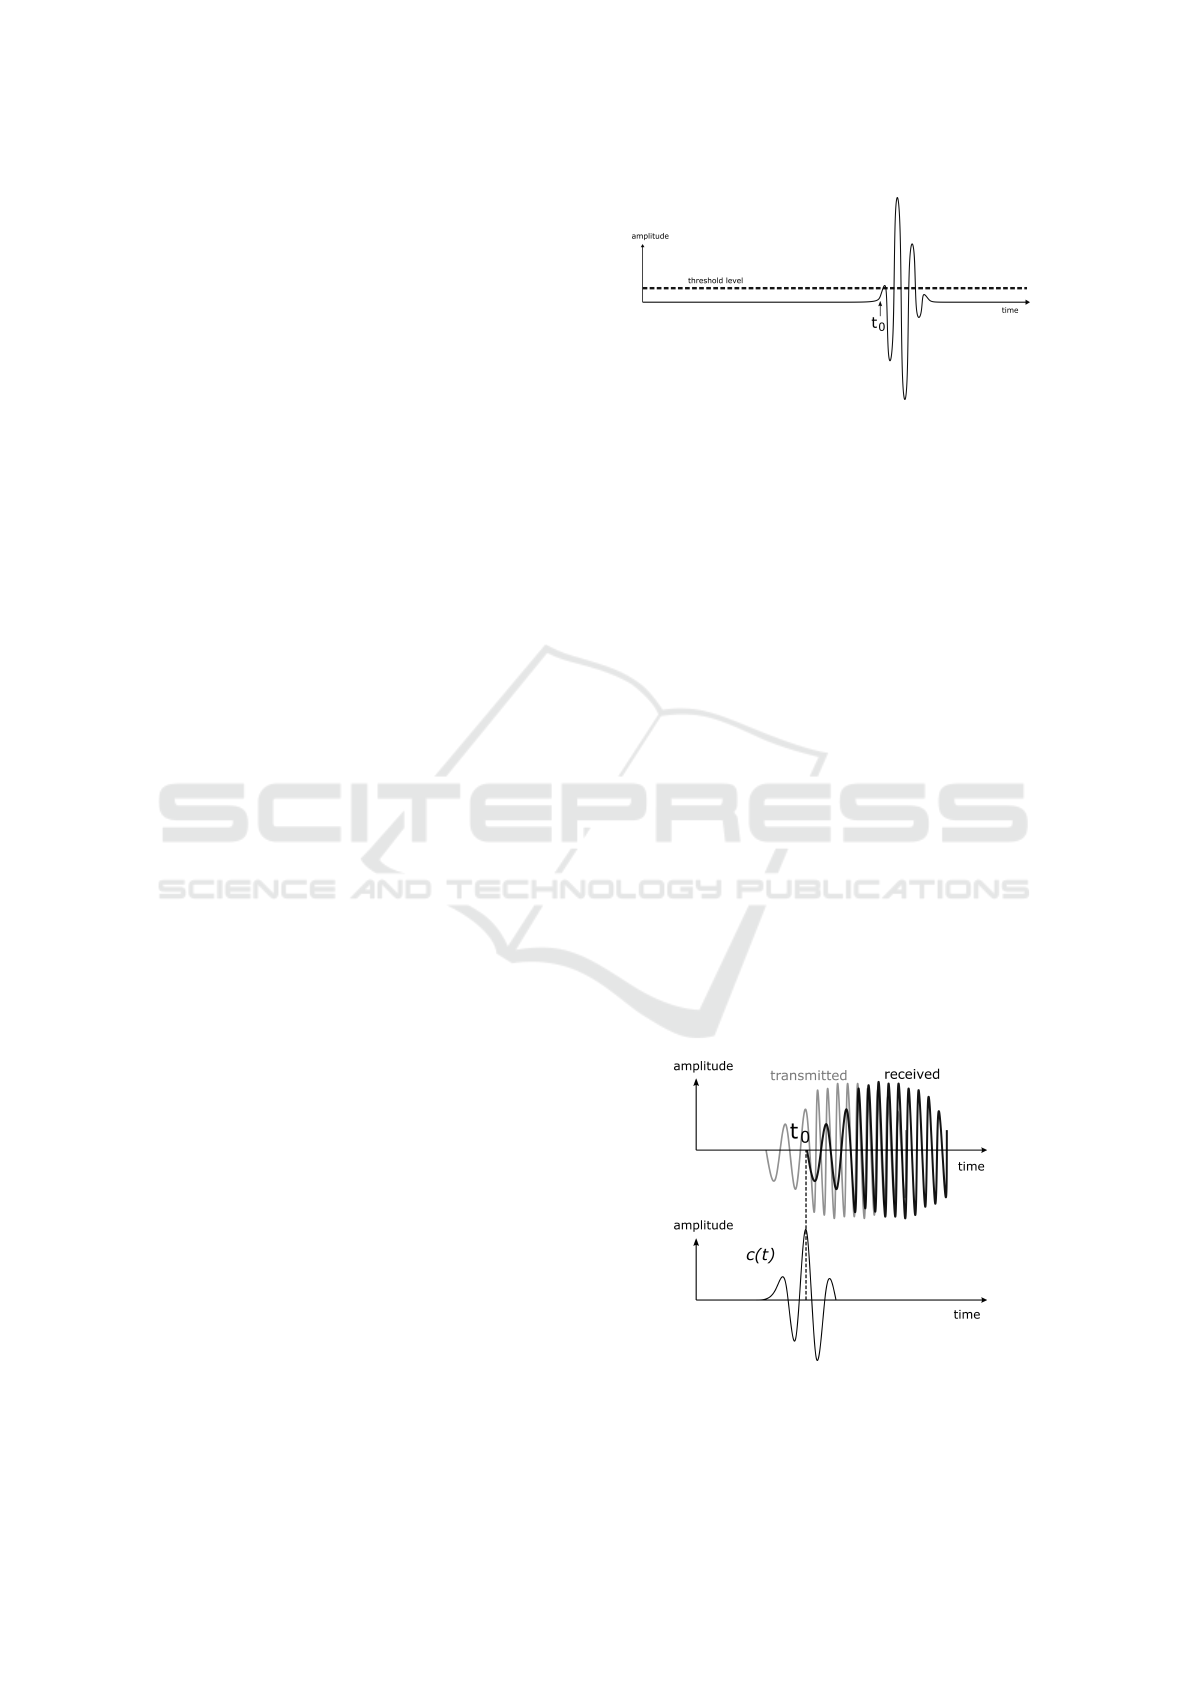
2.1 Threshold Detection
This form is the simplest and fastest way to calcu-
late the TOF. It involves transmitting and detecting
the arrival of an ultrasonic wave when the received
signal exceeds, for the first time, a predefined thresh-
old level, as seen in Figure 1. There are some bene-
fits to using this method, it requires no complex com-
putation and can be performed with simple circuitry.
The main problem of this method is that it typically
estimates a higher TOF compared to the actual one.
This happens due to the long rise time of the signal,
added to other factors, such as low signal-to-noise
ratio (SNR) and inherent bias (Jackson et al., 2013;
Queir
´
os et al., 2006).
As noise increases the likelihood of incorrect
readings also increases, and systems that use thresh-
old as a reference value are vulnerable to this type
of error. In low SNR conditions, it is recommended
to amplify the signal, or equivalently, adjust the de-
tection threshold in order to reduce the system uncer-
tainty. According to (Jackson et al., 2013), the inher-
ent bias occurs for two reasons: the first is that no
matter how good the transducer performance is, there
will always be a rise time when a signal is detected;
Figure 1: Threshold detection method (Kuc and Siegel,
1987).
the second and most crucial is the threshold level set-
ting, this is a critical factor for the bias, because if a
low threshold is set the occurrence of false positives
tends to increase.
2.2 Cross-correlation
The TOF estimation can be considered as a time de-
lay issue, for instance, suppose an ultrasonic signal
s
T
(t) is generated, so when it propagates in the air
and is reflected, the time between the transmission
and the reception of the signal is given by a delay τ.
Thus, techniques for calculate the time delay should
be used. Among them, cross-correlation has been
highlighted (Marioli et al., 1992). Cross-correlation
is a quantitative operation in the time domain to re-
late two signals, when applied between the transmit-
ted and received signal, the result is a peak at the time
delay t
0
, as shown in Figure 2. The cross-correlation
c(t) is calculated by:
c(t) =
Z
+∞
−∞
s
T
(t)s
R
(t + τ)d(τ) (1)
where s
T
(t) is the transmitted signal, s
R
(t + τ) is
the signal received and shifted in time.
Figure 2: Cross-correlation method. Adapted from (Jack-
son et al., 2013).
Low-cost Sonar based on the Echolocation
819
The main disadvantage is that it requires a high
computational consumption, and second (Xu et al.,
2009) this method is only suitable for slightly disper-
sive waves, otherwise the method is not so efficient.
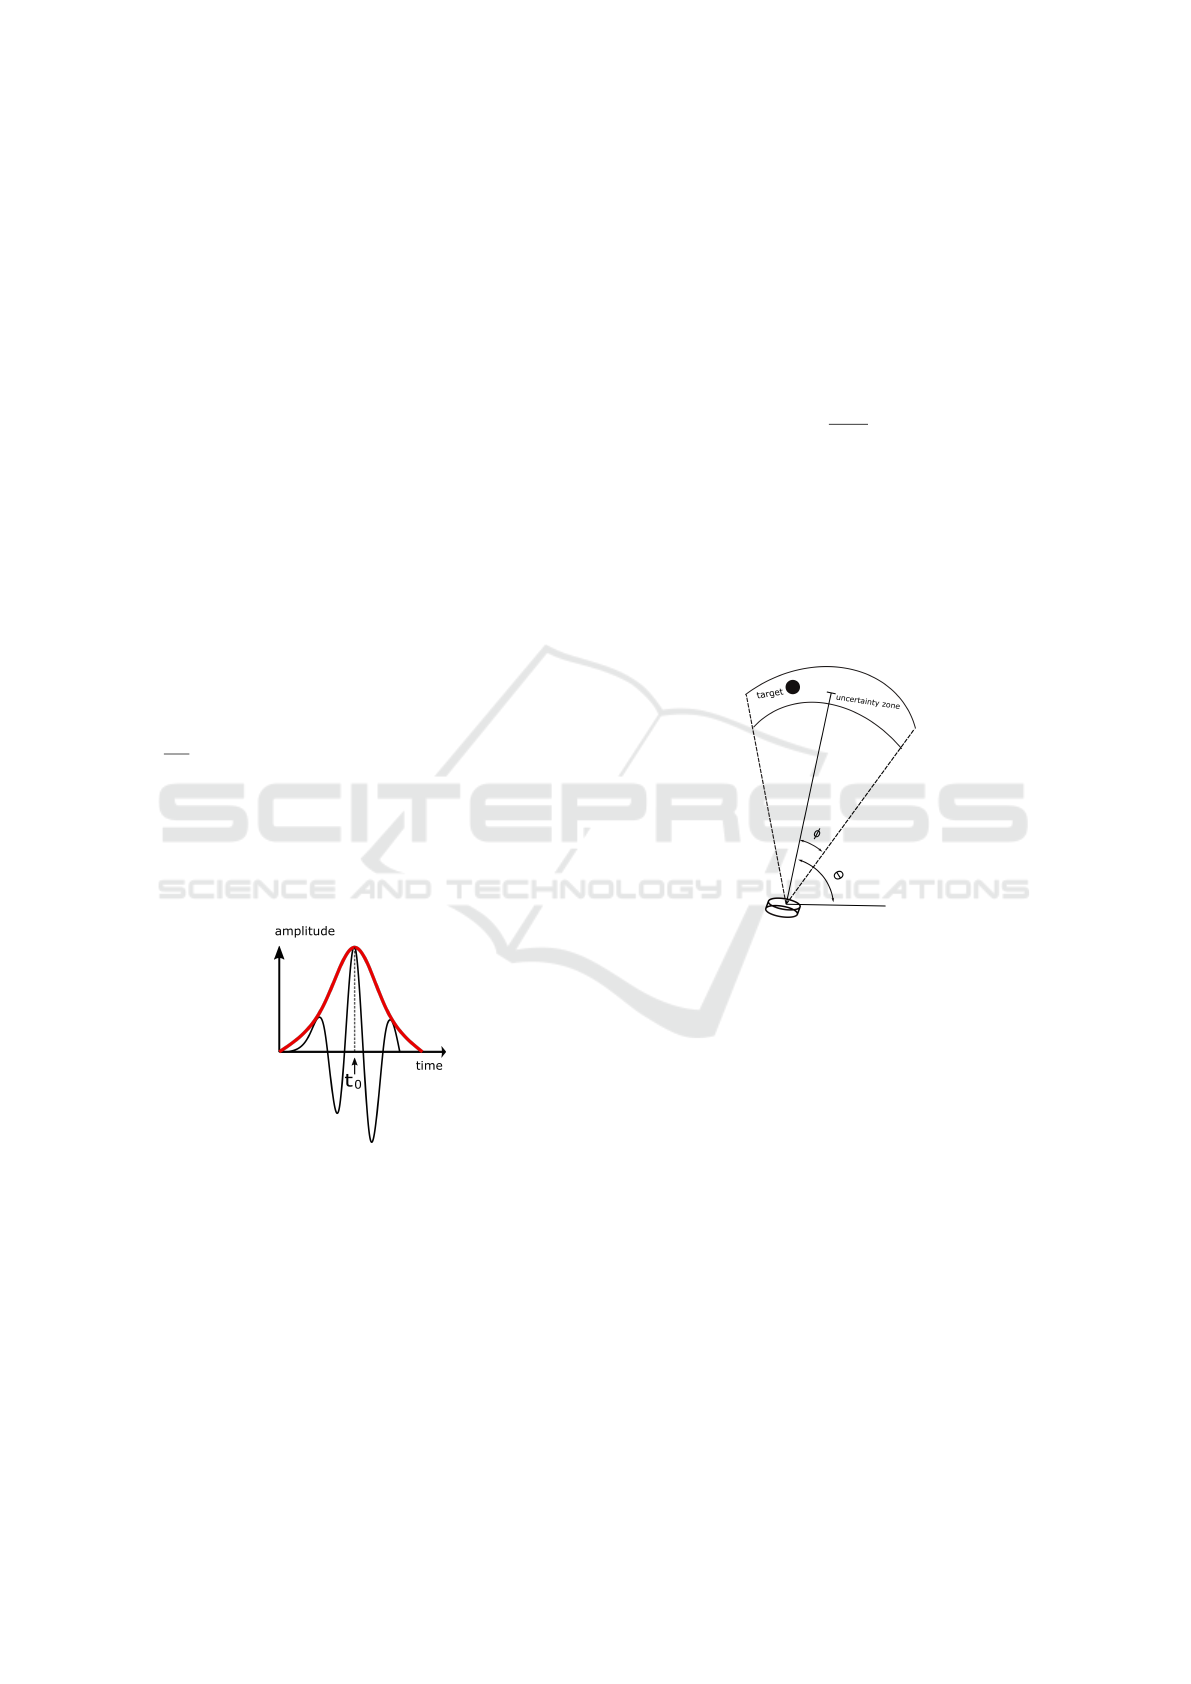
2.3 Envelope Detection
Envelope detection is an alternative to the other meth-
ods mentioned above, which can be assumed as an
intermediary version between threshold detection and
cross-correlation. In (Xu et al., 2009) a comparison
made from the most commom procedures of TOF
estimation demonstrated that envelope detection ob-
tained satisfactory results, only losing to the cross cor-
relation. However, in terms of computational process-
ing this technique is most convenient.
The envelope detector makes use of the Hilbert
Transform to generate an analytical signal, whose ab-
solute value represents the envelope of the measured
signal. The analytical signal y(t) of a real signal x(t)
is defined by:
y(t) = x(t) + j h(t) (2)
where h(t) is the Hilbert Transform of x(t) and j =
√
−1. The magnitude of the analytic signal, which
is identical to the real signal, is called envelope as
seen in Figure 3. Thus, from the envelope extraction
it is possible to locate the peaks and determine the
time between sending and receiving the echo signal.
Hence, the problem of setting the threshold level is
eliminated.
Figure 3: The envelope extraction of the echo signal.
3 SENSOR SYSTEM
In the present work the binaural sensor system was
adopted to improve the system perfomance, but be-
fore studying how it works in the following subsec-
tions a brief analysis of the traditional use of the ul-
trasonic sensor is presented in order to clarify the dif-
ference between these two types.
3.1 Conventional Ultrasonic Ranging
System
This scheme is basically a conventional TOF sys-
tem. The standard mode of operation is to transmit
an acoustic signal through the air and measure the du-
ration until it is reflected by some object. The distance
d can be obtained from
d =
c ·T
f
2
(3)
where c is the sound velocity and T
f
is the
TOF (Kuc and Siegel, 1987).
As previously mentioned, the beam width of these
sensors is large, which makes it unfeasible to lo-
cate the object using just one sensor. Furthermore,
only the first reflection is measured in this configura-
tion, making the amount of information obtained ex-
tremely limited (Peremans et al., 1993).
Figure 4: The beam width of a single sensor. Adapted
from (Peremans et al., 1993).
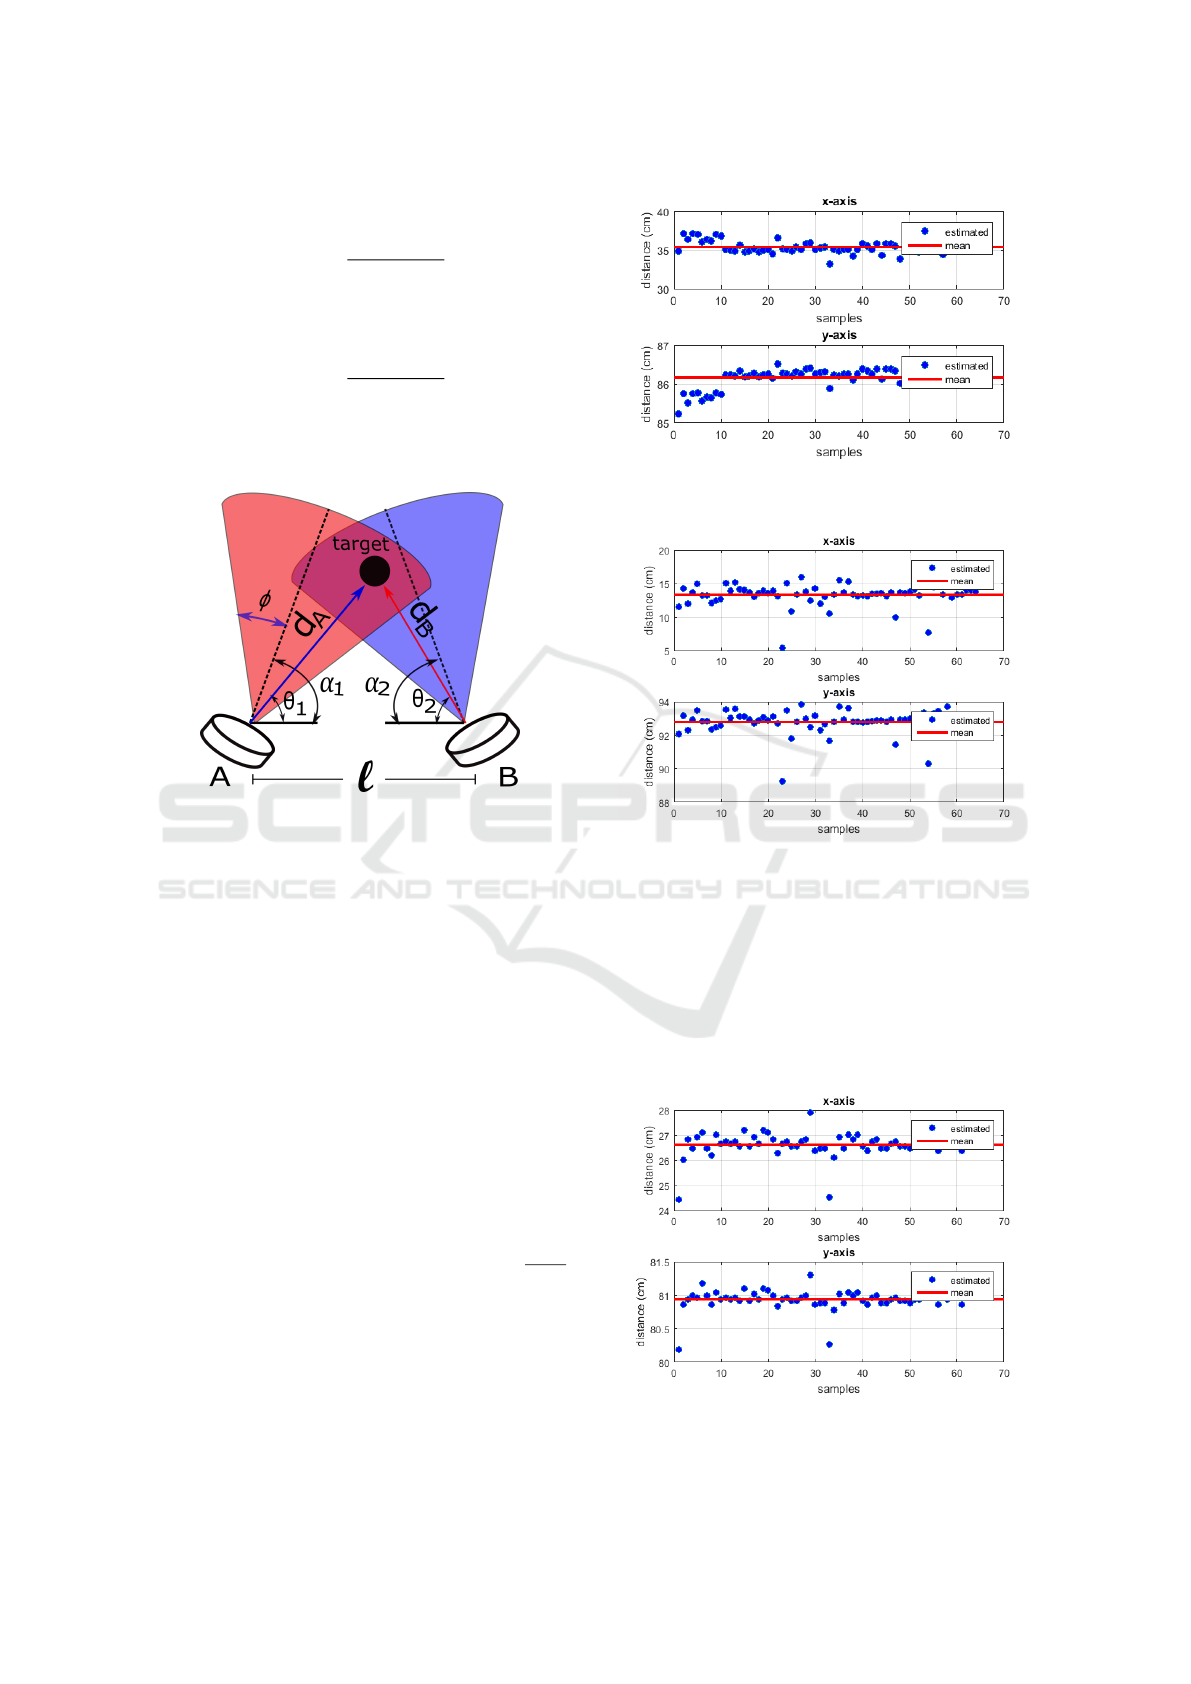
3.2 The Binaural Sensor System
The binaural sensor arrangement, presented in Fig-
ure 5, aims to combine the use of two ultrasonic
sensors to provide more detailed spatial information
and map the environment. Conforming to (Kreczmer,
2010) the disadvantages of a single sensor are reduced
when a multi-sonar system is used. The proposed sys-
tem consists in three conventional ultrasonic sensors,
one of which acts as a transmitter and the other two
as a receiver. In this work it is assumed that the prop-
agation of sound waves occurs in a horizontal plane,
equivalent to the two-dimensional space. Thus, the
location of an object is defined by the region of inter-
section with the horizontal plane through the sensors
A and B, called detection area, as shown in Figure 6.
The receivers, sensors A and B, are separated by
a known baseline (l) that allows locating the detected
objects in a planar environment, estimating the TOF
ICINCO 2019 - 16th International Conference on Informatics in Control, Automation and Robotics
820
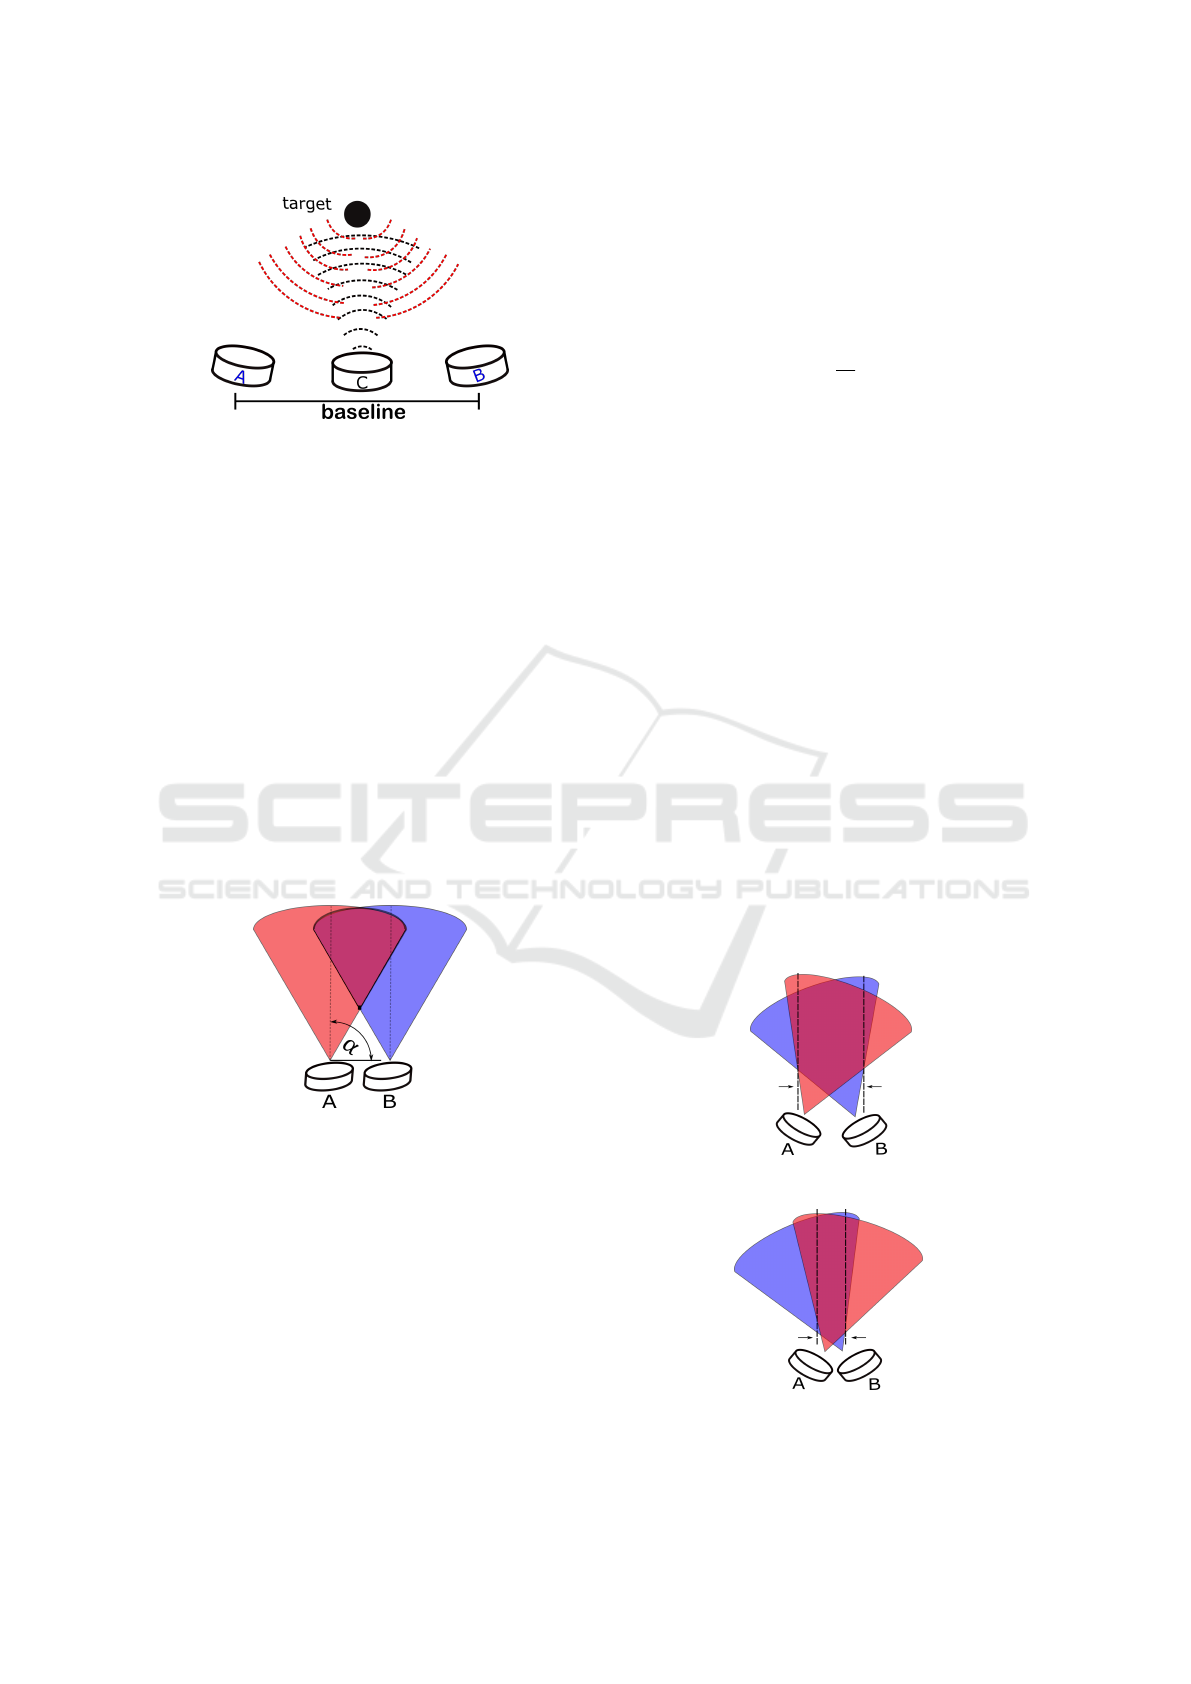
Figure 5: The Binaural sensor arrangement.
between the object and each sensor through the en-
velope detection. Then, the distance calculation is
solved by trigonometric techniques. Fixing the angle
and baseline it is also possible to change the detection
field when the two ultrasonic beam patterns overlap.
The ideal positioning of the system was defined
by the baseline and the α angle, as can be seen in Fig-
ure 6. The maximum width of the detection area oc-
curs when the beam patterns overlap completely, that
is, with a close distance and α = 90
◦
. When the width
is small, as in Figure 7b, the behavior is similar to sys-
tem mentioned in Subsection 3.1. When the width is
larger, as shown in Figure 7a, it is possible to expand
the coverage area. By adjusting the angle of rotation
the points of intersection can increase or decrease, and
the mapping of all valid positions for the detection can
be made by tracing arcs with fixed distances in the lo-
cating cone.
Figure 6: Detection area formed by the beam patterns.
Adapted from (Gearhart et al., 2009).
4 SYSTEM ARCHITECTURE
The system is composed by three low-cost ul-
trasonic sensors HY-SRF05 and a microcontroller
STM32F103C8T ARM Cortex-M3 with two built-in
analog to digital (A/D) converters. The ultrasonic
burst is performed by sensor C and the raw echo sig-
nal received by sensors A and B is sent to the 12
bits A/D converters of the microcontroller with a sam-
pling rate of 320 kHz. Assuming the sound velocity
as approximately 340 m/s, it can be stated that the dis-
tance is covered 0.034 cm/µs. The reciprocal is equal
to 29.412 µs/cm, and considering a round trip cor-
responds to 58.824 µs/cm. Using this constant it is
possible to simplify the determination of the distance
and substitute the Equation (3) by the equation below:
d =
T
f
K
, (4)
where K ≈ 59.
Four thousand readings are stored from each sen-
sor, which if multiplied by the sampling period,
T s = 3.125 µs, corresponds to a sample space of
12500 µs. Using the Equation (4) we can estimate that
the proposed system has a maximum range of about
212 cm depth, that is, along the y-axis. The x-axis is
bounded by the established baseline.
After the data acquisition, the samples are trans-
mitted over RS-232 protocol to the MATLAB, where
the envelope extraction and the TOF estimation of
sensors A and B are performed. Finally, the calcu-
lation of the object coordinates is executed. In order
to reduce the noise, a second-order Butterworth band-
pass filter was applied in the echo signal. The phase
delay produced by the filter was negligible. The sys-
tem overview is shown in Figure 8.
5 TRIANGULATION
Triangulation is the process of determining the lo-
cation of a target from known points using trigono-
metric techniques. Currently, triangulation is applied
(a) Wide overlap region.
(b) Thin overlap region.
Figure 7: Adapted from (Gearhart et al., 2009).
Low-cost Sonar based on the Echolocation
821
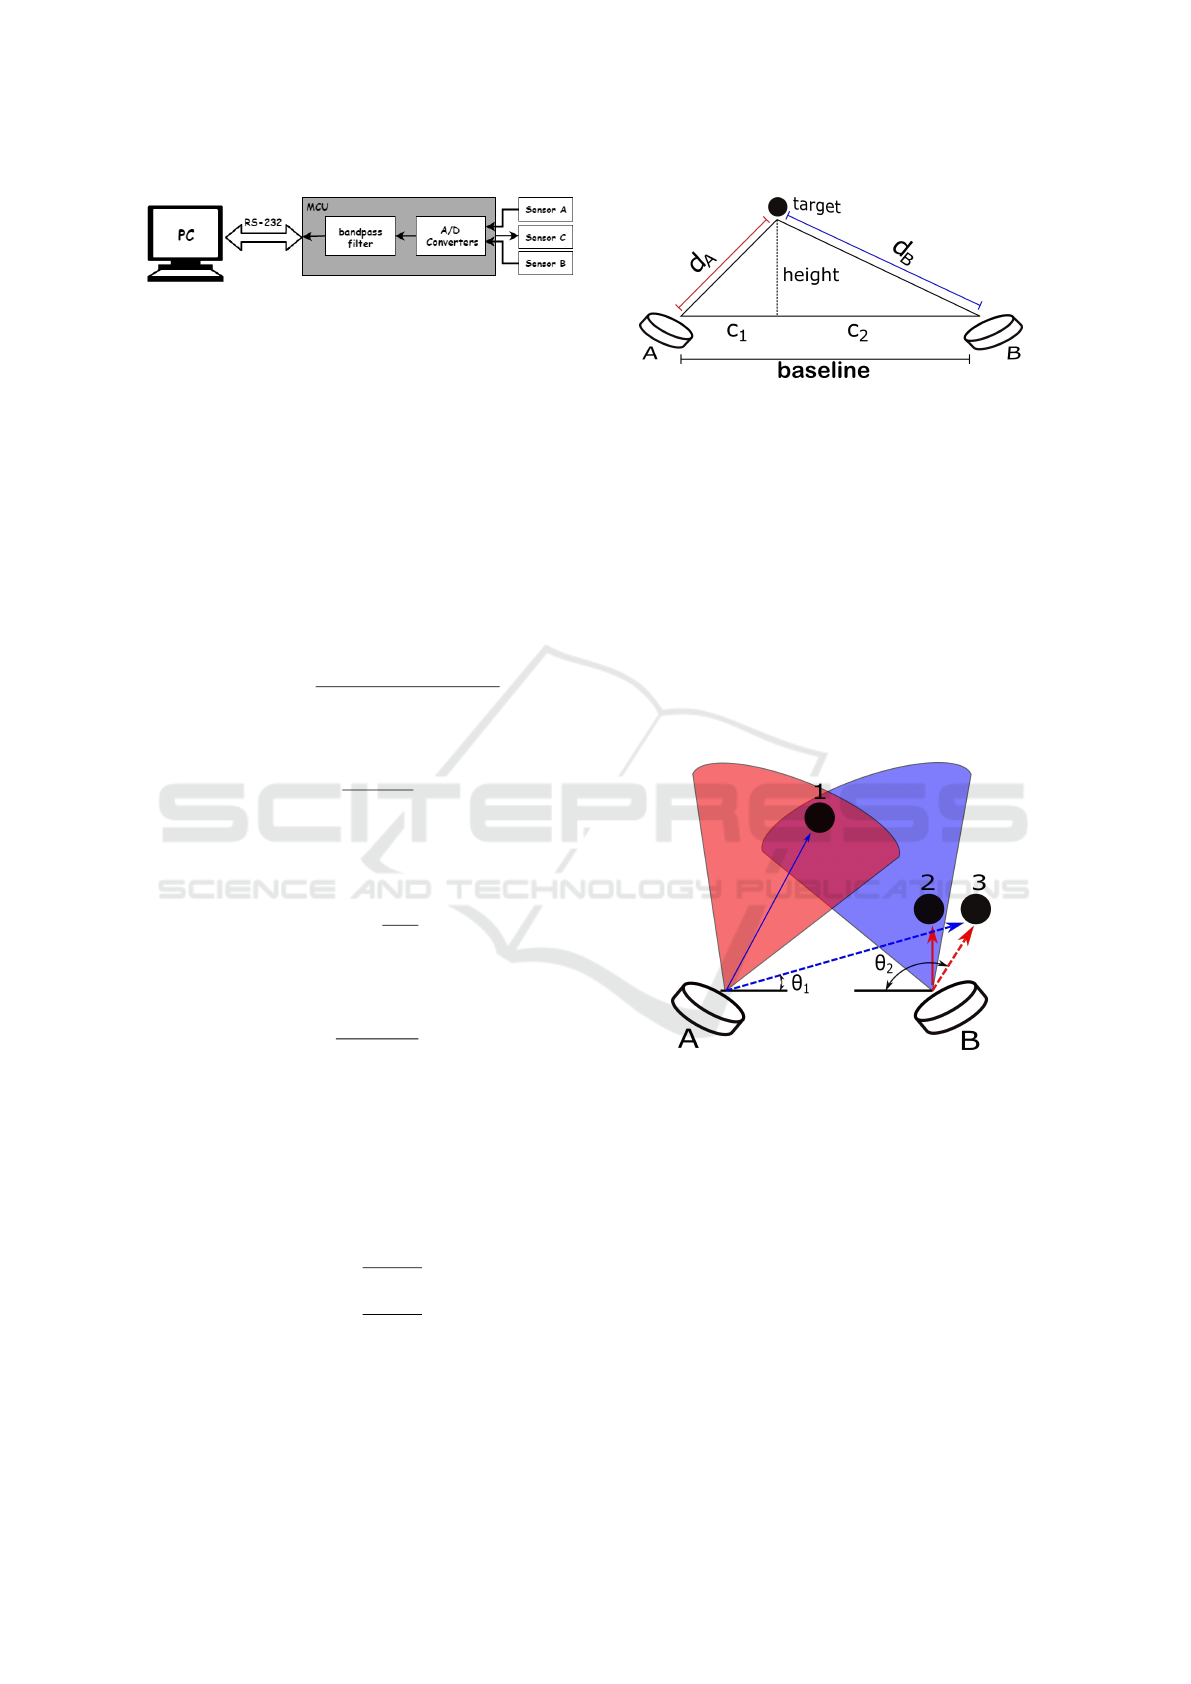
Figure 8: Hardware Implementation.
in several areas, including navigation, metrology and
astrometry. Generally, the number of sensors corre-
sponds to the number of dimensions of the estimated
position of the object, for example, two sensors can
indicate a location in 2D, while three in 3D (Gearhart
et al., 2009).
In geometry, there is a formula that allows to cal-
culate the area of any triangle when the lengths of the
three sides are known. This approach was discovered
by the mathematician Heron of Alexandria (B
´
enyi,
2003). Knowing the distance from the baseline be-
tween the sensors and the distance calculated by them,
it can be computed the area of the triangle formed us-
ing Heron’s formula, as shown in Equation 5:
∆(abc) =
p
p(p −a)(p −b)(p −c), (5)
p =
a + b +c
2
(6)
whose a,b,c are the known sides.
Alternatively, the area of a triangle is also given
by Equation 7:
∆(abc) =
b · h
2
(7)
where b is the base and h is the height of the triangle.
Rearranging the Equation (7), results in:
h =
∆(abc) · 2
b
(8)
If the area calculated in Equation 5 is replaced in
Equation 8 and the base by the known baseline, it is
possible to determine the y-coordinate of the object.
Figures 9 and 11 show the nomenclatures adopted for
the geometric parameters. The x coordinate can now
be calculated if the original triangle is separated into
two right triangles and after that the Pythagoras The-
orem is applied, according to the Equations 9 and 10:
C
1
=
q
d
2
A
−h
2
(9)
C
2
=
q
d
2
B
−h
2
(10)
where h, C
1
, C
2
, d
A
and d
B
can be seen in Figure 9.
If the Equation (9) is used, the system reference
for the coordinates on the x-axis will originate from
sensor A otherwise, from sensor B.
Figure 9: Typical triangulation.
In Figure 4 it is possible to get a perspective of
the systems that use a single ultrasonic sensor. Ob-
jects can be detected anywhere into uncertainty zone.
However, without additional information the system
is not able to make a decision to avoid a collision,
only that there is an object present in the detection
field.
Valid mathematical events but nonsense physical
can occur using the equations described previously,
such as when two objects are separate but are only
detected as one. Therefore, some constraints were de-
fined in order to avoid incoherent data. To prevent the
error shown in Figure 10, it was observed that θ
1
and
θ
2
angles are outside of the detection area.
Figure 10: Typical triangulation error. Adapted
from (Gearhart et al., 2009).
Figure 10 demonstrates that sensor A detects tar-
get 1 and sensor B detects target 2. However, θ
1
and
θ
2
are outside the triangulation area, which causes a
misinterpretation resulting in a wrong coordinate (tar-
get 3).
The next equations and the proposed analysis
were also established by (Gearhart et al., 2009). Fig-
ure 11 demonstrates how θ
1
and θ
2
should be for a
valid detection region and evidence that θ
1
= α
1
±φ.
The α
n
is the angular position of the sensor n relative
to the x-axis. The φ is half the angle of the detection
beam, and is a value specific to each sensor model.
The angular limiting interval can be given by:
ICINCO 2019 - 16th International Conference on Informatics in Control, Automation and Robotics
822
cos(α
1
−φ) ≤ cos θ
1
≤ cos(α
1
+ φ), which
cosθ
1
=
l
2
+ d
2
A
−d
2
B
2ld
A
(11)
Analogously to sensor B, the angular limiting range
is given by: cos(α
2
−φ) ≤ cos θ
2
≤ cos(α
2
+ φ), and
cosθ
2
=
l
2
+ d
2
B
−d
2
A
2ld
B
(12)
The α
1
, α
2
and φ are constant, so it is necessary to
calculate only cos θ
1
and cosθ
2
. Readings outside this
range are discarded.
Figure 11: Triangulation created from the sensors. Adapted
from (Gearhart et al., 2009).
6 RESULTS
The objective of the experimental tests was to analyze
the accuracy of the proposed method and the behavior
of the developed system. The tests were divided into
two situations: the first with only one object and the
second with two objects. The following subsections
describe the procedures and results obtained.
6.1 First Scenario
To perform the tests a small cardboard box was used
and the receivers were positioned with θ
1,2
= 45
◦
and
l = 51cm. Measurements were made with the object
positioned to the right, left and center of the detec-
tion area. Sixty-four samples of each position were
collected and the standard deviation (σ), mean ((x,y))
and variance (σ
2
) of each were calculated, as can be
seen in Table 1. Figures 12, 13 and 14 shows the vari-
ation of the samples in relation to the mean of each
measurement.
Figure 12: Dispersion of the x-axis and the y-axis samples
about the mean value of the box positioned in the right.
Figure 13: Dispersion of the x-axis and the y-axis samples
about the mean value of the box positioned in the left.
6.2 Second Scenario
Due to the fact that the raw echo signal is used, a
deeper analysis of the environment is possible. When
more than one object is present in the scene it is pos-
sible to detect it through the peaks of the envelope, as
shown in Figure 17. If two objects are very close the
Figure 14: Dispersion of the x-axis and the y-axis samples
about the mean value of the box positioned in the center.
Low-cost Sonar based on the Echolocation
823
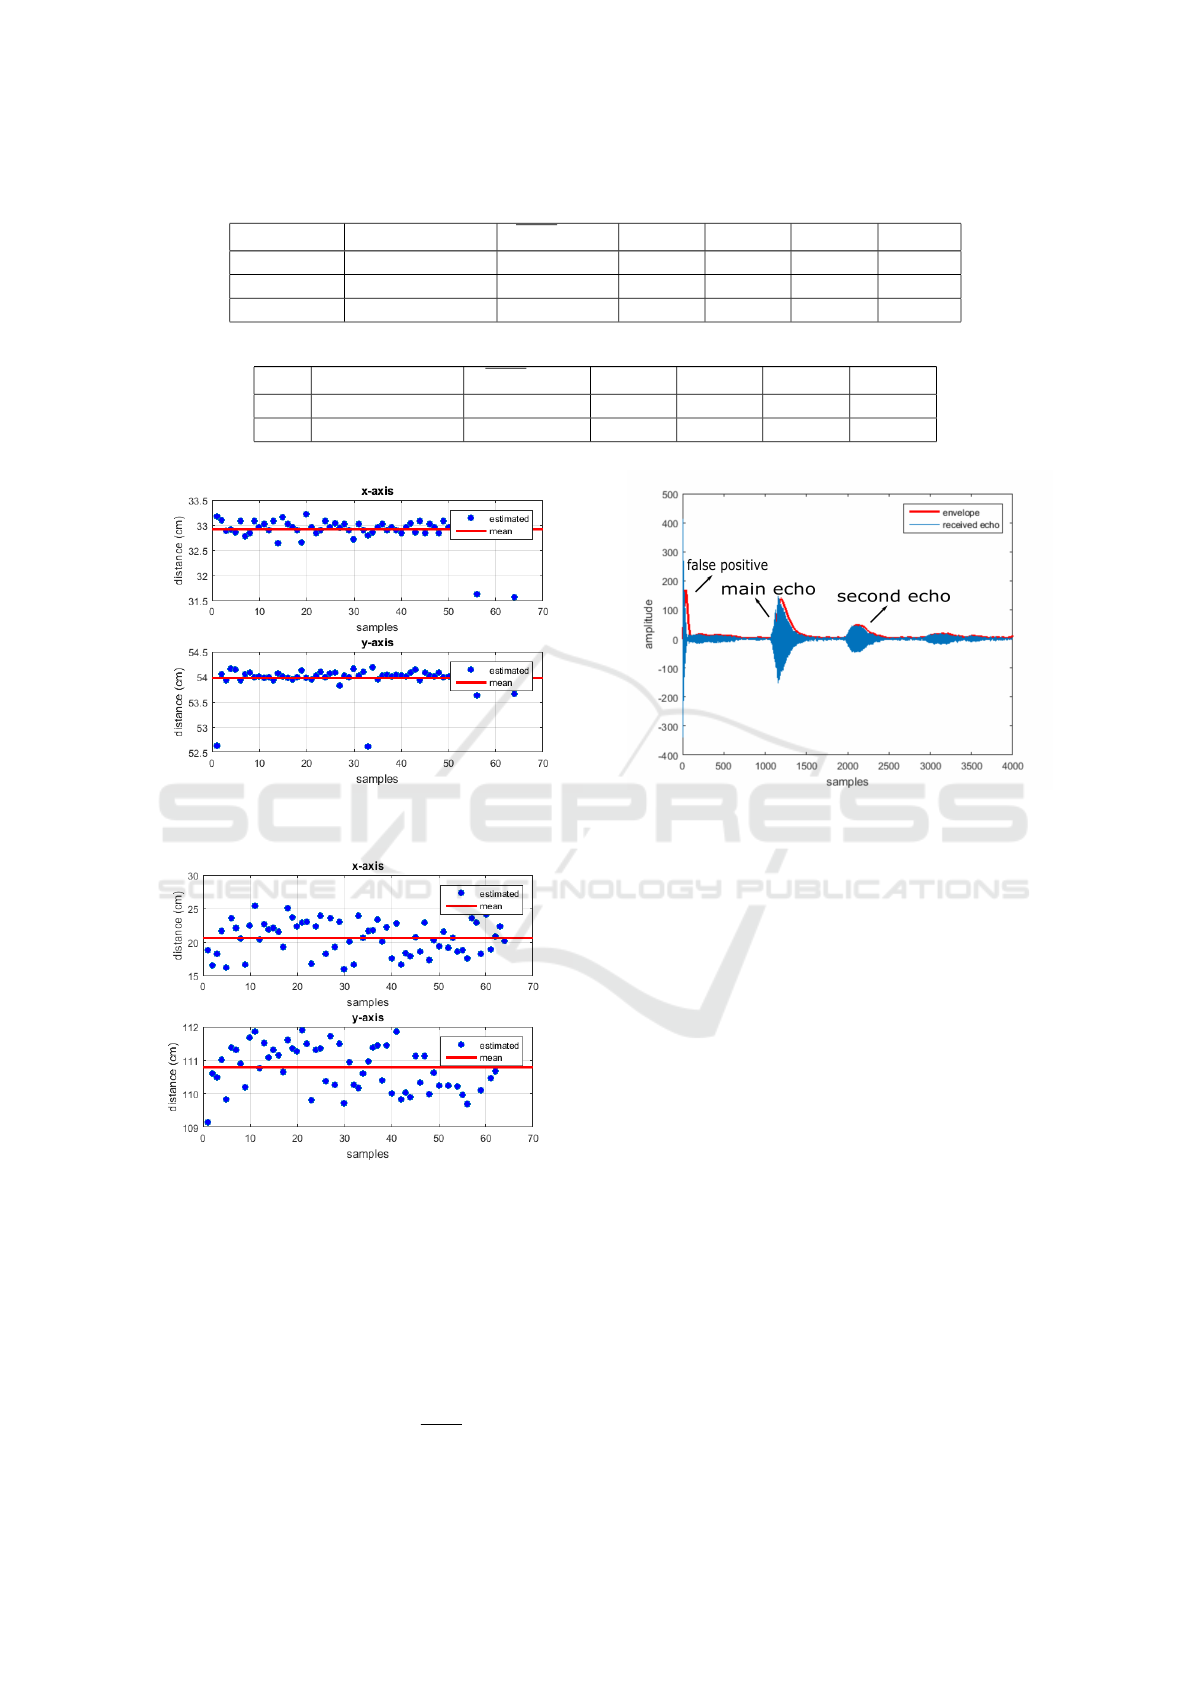
Table 1: Mean, standard deviation and variance of the first tests.
Positioning (x,y)real* (cm) (x,y) (cm) σ
x
(cm) σ
y
(cm) σ
2
x
(cm) σ
2
y
(cm)
Left (11.5, 91.8) (13.3, 92.8 ) 1.66 0.71 2.76 0.50
Center (25.6, 84.5) (26.6, 80.9) 0.48 0.15 0.23 0.02
Right (35.0, 86.4) (35.3, 86.1) 0.75 0.25 0.57 0.06
Table 2: Mean, standard deviation and variance of the further tests.
Box (x,y)real* (cm) (x, y) (cm) σ
x
(cm) σ
y
(cm) σ
2
x
(cm) σ
2
y
(cm)
1 (35.5, 54.0) (32.9, 53.9) 0.27 0.26 0.07 0.06
2 (19.0, 111.2) (20.6, 110.8) 2.47 0.65 6.10 0.43
*Coordinates based on the object’s center.
Figure 15: Dispersion of the x-axis and the y-axis samples
about the mean value of the first box.
Figure 16: Dispersion of the x-axis and the y-axis samples
about the mean value of the second box.
system can recognizes them as a single object. In this
way, in our test the objects were positioned far from
each other. One of the objects used was the same
one described in Subsection 6.1 and the other was a
medium cardboard box. The procedures in Subsec-
tion 6.1 were repeated. The positioning of both ob-
jects was random, the smaller box (Box 1) was closer
to the sensors and the larger box (Box 2) further away.
The standard deviation (σ), mean ((x, y)) and variance
Figure 17: Example of an echo signal received.
(σ
2
) of each situation are presented in Table 2. Fig-
ures 15, 16 shows the variation of the samples in rela-
tion to the mean of each measurement.
Figure 17 shows a frequent error in the receivers.
The target was more than 1 cm apart, however the sys-
tem indicated that the object was at a smaller distance.
The problem seems to occur because the echo signal
interferes with a signal that travels directly from the
transmitter to the receiver, without reflecting on the
object. Then, in an attempt to reduce the direct signal,
tubes were added at the receivers and at the transmit-
ter.
7 CONCLUSION AND FUTURE
WORK
The use of sonar devices is a common approach in
mobile robotics. The difficulty of correctly interpret-
ing the acquired data, is actually a problem. This pa-
per focused on the improvement and development of a
low cost obstacle location system based on ultrasonic
sensors and signal processing techniques.
The selection of an appropriate method to deter-
mine the accuracy of the system was one of the diffi-
ICINCO 2019 - 16th International Conference on Informatics in Control, Automation and Robotics
824

culties encountered in the execution of this work. Due
to the wide beam of the sensor, the point at which
the ultrasonic wave reflects on the object is unknown,
made the comparison of coordinates calculated by the
system with the real coordinates a complex definition.
In Tables 1 and 2 the x and y coordinates of the
center of the object were used as real only to have a
comparison reference with the mean of the samples.
After the tests were carried out, it was verified that
all the coordinates estimated by the system were con-
tained in the established perimeter. From results, it is
clear that the system had good performance, the mean
error for the first and second scenario was 1.68% and
1.19% respectively. The worst case occurred in the
detection of the second object, because the distance
was greater and consequently the dispersion of the
points as well.
As future work, it is intended to optimize the pro-
cessing time with another microcontroller or even a
Digital Signal Processor (DSP) for real-time applica-
tions, and embed all to some mobile navigation device
for testing and system validation. In general, the bin-
aural sensor system through the envelope extraction
can be an attractive alternative to the traditional mod-
els of ultrasonic detection, presenting good accuracy
and repeatability of the measurements.
ACKNOWLEDGEMENTS
This work is financed by the ERDF — Euro-
pean Regional Development Fund through the Op-
erational Programme for Competitiveness and In-
ternationalisation — COMPETE 2020 Programme
within project POCI-01-0145-FEDER-006961, and
by National Funds through the FCT — Fundac¸
˜
ao
para a Ci
ˆ
encia e a Tecnologia (Portuguese Founda-
tion for Science and Technology) as part of project
UID/EEA/50014/2013.
REFERENCES
B
´
enyi,
´
A. (2003). 87.47 a heron-type formula for the trian-
gle. The Mathematical Gazette, 87(509):324–326.
Cheeke, J. D. N. (2016). Fundamentals and applications of
ultrasonic waves. CRC press.
Gearhart, C., Herold, A., Self, B., Birdsong, C., and
Slivovsky, L. (2009). Use of ultrasonic sensors in
the development of an electronic travel aid. In 2009
IEEE Sensors Applications Symposium, pages 275–
280. IEEE.
Huang, K.-N. and Huang, Y.-P. (2009). Multiple-frequency
ultrasonic distance measurement using direct digital
frequency synthesizers. Sensors and Actuators A:
Physical, 149(1):42–50.
Jackson, J. C., Summan, R., Dobie, G. I., Whiteley, S. M.,
Pierce, S. G., and Hayward, G. (2013). Time-of-flight
measurement techniques for airborne ultrasonic rang-
ing. IEEE transactions on ultrasonics, ferroelectrics,
and frequency control, 60(2):343–355.
Kim, H.-S. and Choi, J.-S. (2008). Advanced indoor local-
ization using ultrasonic sensor and digital compass. In
2008 International Conference on Control, Automa-
tion and Systems, pages 223–226. IEEE.
Kreczmer, B. (2010). Objects localization and differentia-
tion using ultrasonic sensors. In Robot Localization
and Map Building. IntechOpen.
Kuc, R. and Siegel, M. W. (1987). Physically based simula-
tion model for acoustic sensor robot navigation. IEEE
Transactions on Pattern Analysis and Machine Intel-
ligence, (6):766–778.
Lim, J., Lee, S. J., Tewolde, G., and Kwon, J. (2014).
Ultrasonic-sensor deployment strategies and use of
smartphone sensors for mobile robot navigation in in-
door environment. In IEEE International Conference
on Electro/Information Technology, pages 593–598.
IEEE.
Marioli, D., Narduzzi, C., Offelli, C., Petri, D., Sardini, E.,
and Taroni, A. (1992). Digital time-of-flight measure-
ment for ultrasonic sensors. IEEE Transactions on In-
strumentation and Measurement, 41(1):93–97.
Patkar, A. R. and Tasgaonkar, P. P. (2016). Object recog-
nition using horizontal array of ultrasonic sensors.
In 2016 International Conference on Communication
and Signal Processing (ICCSP), pages 0983–0986.
IEEE.
Peremans, H., Audenaert, K., and Van Campenhout, J. M.
(1993). A high-resolution sensor based on tri-aural
perception. IEEE transactions on Robotics and Au-
tomation, 9(1):36–48.
Popelka, M., Stru
ˇ
ska, J., and Stru
ˇ
ska, M. (2016). Using ul-
trasonic sensors to create 3d navigation model of area
with ultrasonic sensors. International Journal of Cir-
cuits, Systems and Signal Processing.
Queir
´
os, R., Martins, R., Girao, P. S., and Serra, A. C.
(2006). A new method for high resolution ultrasonic
ranging in air. Proc. international measurement con-
federation, Rio de Janeiro.
Schillebeeckx, F., De Mey, F., Vanderelst, D., and Pere-
mans, H. (2011). Biomimetic sonar: Binaural 3d lo-
calization using artificial bat pinnae. The International
Journal of Robotics Research, 30(8):975–987.
Wu, C.-J. and Tsai, C.-C. (2001). Localization of an au-
tonomous mobile robot based on ultrasonic sensory
information. Journal of Intelligent and Robotic Sys-
tems, 30(3):267–277.
Xu, B., Yu, L., and Giurgiutiu, V. (2009). Advanced meth-
ods for time-of-flight estimation with application to
lamb wave structural health monitoring. In Proc. In-
ternational Workshop on SHM, pages 1202–1209.
Low-cost Sonar based on the Echolocation
825
