
Scaling Big Data Applications in Smart City with Coresets
Le Hong Trang
1
, Hind Bangui
2,3
, Mouzhi Ge
2,3
and Barbora Buhnova
2,3
1
Faculty of Computer Science and Engineering, Ho Chi Minh City University of Technology,
Vietnam National University, Ho Chi Minh City, Vietnam
2
Institute of Computer Science, Masaryk University, Brno, Czech Republic
3
Faculty of Informatics, Masaryk University, Brno, Czech Republic
Keywords:
Big Data, Classification, Coreset, Clustering, Sampling, Smart City.
Abstract:
With the development of Big Data applications in Smart Cities, various Big Data applications are proposed
within the domain. These are however hard to test and prototype, since such prototyping requires big comput-
ing resources. In order to save the effort in building Big Data prototypes for Smart Cities, this paper proposes
an enhanced sampling technique to obtain a coreset from Big Data while keeping the features of the Big Data,
such as clustering structure and distribution density. In the proposed sampling method, for a given dataset and
an ε > 0, the method computes an ε-coreset of the dataset. The ε-coreset is then modified to obtain a sample
set while ensuring the separation and balance in the set. Furthermore, by considering the representativeness
of each sample point, our method can helps to remove noises and outliers. We believe that the coreset-based
technique can be used to efficiently prototype and evaluate Big Data applications in the Smart City.
1 INTRODUCTION
Big Data has been receiving increasing attention in re-
cent years, as organizations and cities are dealing with
tremendous amounts of data with high complexity
and velocity (Ge et al., 2018). Given the specific fea-
tures of Big Data, the data has been classified accord-
ing to five fundamental elements, which are volume
(size of data), variety (different types of data from
several sources), velocity (data collected in real time),
veracity (uncertainty of data) and value (benefits to
various industrial and academic fields). Moreover,
additional characteristics beyond the 5V’s model has
been discussed such as: validity (correct processing
of the data), variability (context of data), viscosity (la-
tency data transmission between the source and desti-
nation), virality (speed of the data sent and received
from various sources) and visualization (interpreta-
tion of data and identification of the most relevant
information for the users). Despite the existence of
additional characteristics of Big Data, the 5V model
lays the foundational description of the Big Data con-
cept (Erl et al., 2016). Recently, Big Data research
has been undergoing substantial transformation from
its research harvest towards its high impact and appli-
cations in different areas, especially in the Smart City
(Bangui et al., 2018b).
The Smart City is to improve the lifestyle of
citizens by providing smart applications in various
fields such as urban planning, mobility and trans-
portation, smart living and community, smart environ-
ment, emergency, e-health and government (Step
´
anek
et al., 2017). The data generated in these Smart City
applications are usually fast moving and changing in
value, meaning and format. They also can originate
from various sources, such as social networks, un-
structured data from different devices or raw feeds
from sensors (Ge and Dohnal, 2018). Thus Big Data
processing and analytics can offer extensive insights
for Smart Cities. However, one of main factors that
mainly affects to the cost of Big Data analysis, is the
size of the dataset to be examined. Many datasets are
too large to store and process in a computer memory.
In the case, analyzing the datasets needs to access the
disk of the computer or even extra devices (Bangui
et al., 2018a). It is thus always an expensive compu-
tational task to analyze such datasets. Therefore, the
use of sampling technique is natural to overcome this
difficulty.
In this paper, a sampling method is proposed to
obtain a core sample dataset from Big Data while
keeping the features of Big Data such as clustering
and structures. This sampling method can be used to
quickly conduct prototypes for Big Data applications.
Trang, L., Bangui, H., Ge, M. and Buhnova, B.
Scaling Big Data Applications in Smart City with Coresets.
DOI: 10.5220/0007958803570363
In Proceedings of the 8th International Conference on Data Science, Technology and Applications (DATA 2019), pages 357-363
ISBN: 978-989-758-377-3
Copyright
c
2019 by SCITEPRESS – Science and Technology Publications, Lda. All rights reserved
357

Thus, in order to test the feasibility of the certain ap-
plications in Big Data, we could save the efforts to or-
ganize the whole big dataset. Instead, we could work
on a scalable sample dataset to do the pilot study for
the feasility and applicability test for Big Data appli-
cations.
The rest of the paper is organized as follows. Sec-
tion 2 introduces an application scenario for the sam-
pling technique. Section 3 explains the intuition of
the sampling in Big data. Section 4 describes our pro-
posed methods for generating the coreset of the Big
Data as well as improvement techniques for coreset.
Based on the coreset technique, Section 5 describes
the possible application of coreset in the Smart City.
Finally, Section 6 concludes the paper and outlines
the future work.
2 BIG DATA IN THE SMART CITY
Nowadays, the cities are becoming the space
equipped with smart digital communication
transceivers, with an ambition of connecting, in-
tegrating and enhancing communicating objects.
Accordingly, we have observed an increasing pres-
ence of intelligent applications in our daily lives such
as smart parking. Meanwhile, many studies have pro-
posed various strategies for finding better governance
intelligence for modern cities (Ge et al., 2018). One
of these approaches features gathering data from
multiple domains, and then provides specific data to
decision-makers (Matheus and Janssen, 2018).
The visual datasets are one of the largest datasets
from those typically available in Smart Cities (Ge
et al., 2018), since they help to understand the most
fundamental and challenging goals in urban places.
A typical example is the Cityscapes Dataset (Cordts
et al., 2015), which very well illustrates the visual
complexity of such scenes (i.e., GPS positions) from
50 different cities by providing a large set of stereo
video sequences of street views. Likewise, Mapillary
Vistas Dataset (Neuhold et al., 2017), Daimler Urban
Segmentation Dataset (Scharw
¨
achter et al., 2013),
and ApolloScape Dataset (Xinyu et al., 2018) con-
sist of video sequences recorded in urban traffic that
could be used for developing autonomous driving ve-
hicles, learning how to detect objects and enumerate
them precisely, analyzing the road construction, and
so on. Therefore, these datasets help the scientific and
industrial communities in understanding urban street
scenes through visual perception. As a result, the
availability of large-scale datasets plays a vital role
in the understanding of the mutual information that
can be obtained from the joint Big Data analysis al-
gorithms and urban governance challenges. Further-
more, the proper analysis process of data is required
for providing the exact knowledge and achieving the
ultimate goal of the Smart City paradigm, which is
making better use of public resources by improving
the quality of services and reducing the operational
costs.
3 SAMPLING IN BIG DATA
Whenever the dataset is too big to be analysed in its
fullest, sampling can be used to return a representative
sample of the dataset that can be examined and its
properties extrapolated to the original datase.
The basic type of sampling is the uniformly ran-
dom sampling. It, however, is inefficient when deal-
ing with datasets of non-uniform distribution. If
the shape and the density of datasets are varied, a
small sample obtained by uniform sampling would
have poor representativeness. The size of the sample
should thus be increased if a higher representativeness
is required. Two approaches proposed for overcom-
ing the drawbacks of uniform sampling are based on
distance and density features in datasets.
A point can represent a subset within a set if it is
close to the others. A basic measure is the distance.
A distance-based sampling measures the similarity of
points in a dataset. This approach is thus strongly re-
lated to clustering techniques (Bangui et al., 2019).
A distance used for the measurement is different for
datasets which depend on the distribution feature, for
example the shape of clusters in the dataset. For a
convex-shape (spherical) cluster, the Euclidean dis-
tance is proper, while a path-based one should be re-
quired for more complex shapes. In case of imbal-
anced datasets, in order to maintain the representa-
tiveness of a sample, a density bias is necessary. A
density-based sampling would select a representative
point based on a density-specified function of patterns
in a dataset. The principle is to try keeping represen-
tation of sparsely distributed clusters of the dataset. A
recent concise review of these two approaches can be
found in (Ros and Guillaume, 2017). Some methods
also were proposed in which the distance and den-
sity are coupled. These methods aim at ensuring the
structural feature as well as representativeness of a re-
sulting sample. This also is the main purpose of the
method proposed in this work while producing sam-
ples of small size.
By the approximate computation point of view,
sampling can be seen as determining approximately
a subset of a given set. For the geometric approxi-
mation problem, a concept called ε-coreset was intro-
DATA 2019 - 8th International Conference on Data Science, Technology and Applications
358

duced by Agarwal et al. (Agarwal et al., 2005). Given
a set P and ε > 0, an ε-coreset denoted by Q is a subset
of P that approximates P due to a monotonic measure
function. Recently, Ros and Guillaume have proposed
a sampling called ProTraS (Ros and Guillaume, 2018)
which can be seen as an extention of the fft (farthest
first traversal) algorithm (Rosenkrantz et al., 1977).
They also indicated that the sample obtained by Pro-
TraS is a coreset of the original dataset. ProTraS it-
eratively adds a representative into the sample until
the sampling cost drops below a given threshold. The
representative is selected due to a probability of cost
reduction which is defined based on the coupling of
distance and density concepts.
Our method employs ProTraS to compute a core-
set of a given dataset. Unlike ProTraS, the resulting
coreset is not the final sample. For each point of the
coreset, we compute the center of the subset of the
dataset that the point represents. The sample of the
dataset includes centers of all points of the coreset.
Furthermore, if the representativeness of a point of
the coreset is low, i.e., the number of the subset of
the dataset that is represented by the point is small,
the point is removed from the sample. The method is
implemented in Matlab and experimentally compared
with ProTraS. The applicability of the method is also
evaluated with two key problems in data mining in-
cluding clustering and especially classification with
imbalanced datasets.
4 CORESET FOR BIG DATA
SAMPLING
We first recall the concept of coreset of a set (Agarwal
et al., 2005). Let µ be a monotone function from sub-
sets of R
n
to R
n
∪ {0}, i.e., for P
0
⊆ P, µ(P
0
) ≤ µ(P).
Given ε > 0 and Q ⊆ P, Q is called an ε-coreset of P
with respect to µ if
(1 − ε)µ(P) ≤ µ(Q).
When this concept is applied for the clustering
problem, then it is extended as bellow.
Definition 4.1. (Har-Peled and Mazumdar, 2004) A
subset S of P is an (k, ε)-coreset for P if
(1−ε)Cost
T
(C) ≤ Cost
S
(C) ≤ (1 +ε)Cost
T
(C), (1)
where C ⊂ P is a set of k centers of P.
Our method proposed in the next section uses
the sample given by the ProTraS algorithm (Ros and
Guillaume, 2018) as the first step. We now briefly
describe this one and then discuss some observations
of its results. The main idea of ProTraS is to select
a representative point based on a probability of cost
reduction. Given an ε > 0, for each iteration of the
algorithm, it adds a new representative into a group of
the sample with highest probability of the cost reduc-
tion. When the cost drops below a threshold which
depends on ε, the algorithm stops. The details of the
algorithm are given in Algorithm 1.
Algorithm 1: ProTraS (Ros and Guillaume, 2018).
Require: P = {x
i
}, for i = 1,2,..., n, a tolerance ε > 0.
Ensure: A sample S = {y
j
} and P(y
j
), for j = 1,2, .. ., s.
1: Initialize a pattern x
init
∈ P.
2: y
1
= x
init
,P(y
1
) = {y
1
}, and S = {y
1
}.
3: s = 1.
4: repeat
5: for all x
i
∈ P \ S do
6: y
k
= argmin
y
j
∈S
d(x
l
,y
j
).
7: P(y
k
) = P(y
k
) ∪ {x
l
}.
8: end for
9: maxW D = cost = 0.
10: for all y
k
∈ S do
11: x
max
(y
k
) = argmax
x
i
∈P(y
k
)
d(x
i
,y
k
).
12: d
max
(y
k
) = d(x
max
(y
k
),y
k
).
13: p
k
= |P(y
k
)|d
max
(y
k
).
14: if p
k
> maxW D then
15: maxW D = p
k
.
16: y
∗
= y
k
.
17: end if
18: cost = cost + p
k
/n.
19: end for
20: x
∗
= x
max
(y
∗
).
21: S = S ∪ {x
∗
} and s = s + 1.
22: P(y
∗
) = {x
∗
}.
23: until cost < ε
24: return S and P(y
j
), for j = 1,2, .. ., s.
Lines 5-8 of the algorithm find the nearest group
for points that are not yet assigned to any group of the
current sample. The point among them is determined
to be the new representative if it is farthest in its group
and has also highest probability (Lines 10-19). This
also means that the representative selected by ProTraS
is the farthest-first traversal item.
Given a dataset P, let us denote by C =
{c
1
,c
2
,. . . , c
k
} the set of centers of P. ProTraS aims
at generating a coreset as the sample of P. Indeed, for
x
i
∈ P, let c
∗
i
,c
∗0
j
∈ C be the closest centers to x
i
∈ P
and y
j
∈ S, respectively. We define
• Cost
T
(C) =
∑
n
i=1
d(x
i
,c
∗
i
) and
• Cost
S
(C) =
∑
s
j=1
w
j
d(y
j
,c
∗0
j
), where w
j
is the
number of points of P(y
j
) and P(y
j
) is also called
the set of patterns of y
j
.
Since the set of representatives is selected by the
farthest-first traversal, it has been shown in (Ros and
Scaling Big Data Applications in Smart City with Coresets
359
Guillaume, 2018) that if we choose
ε =
∑
s
j=1
w
j
d
j
Cost
T
(C)
,
where d
j
= max
y
j
∈P(y
k
)
{d(y
j
,y
k
)}, for y
k
∈ S, then (1)
is satisfied. Hence, the obtained sample is a coreset of
P. We now discuss some experimental results of the
ProTraS algorithm.
4.1 Implementation of ProTraS
We implemented the algorithm in Matlab and tested
on some synthetic datasets
1
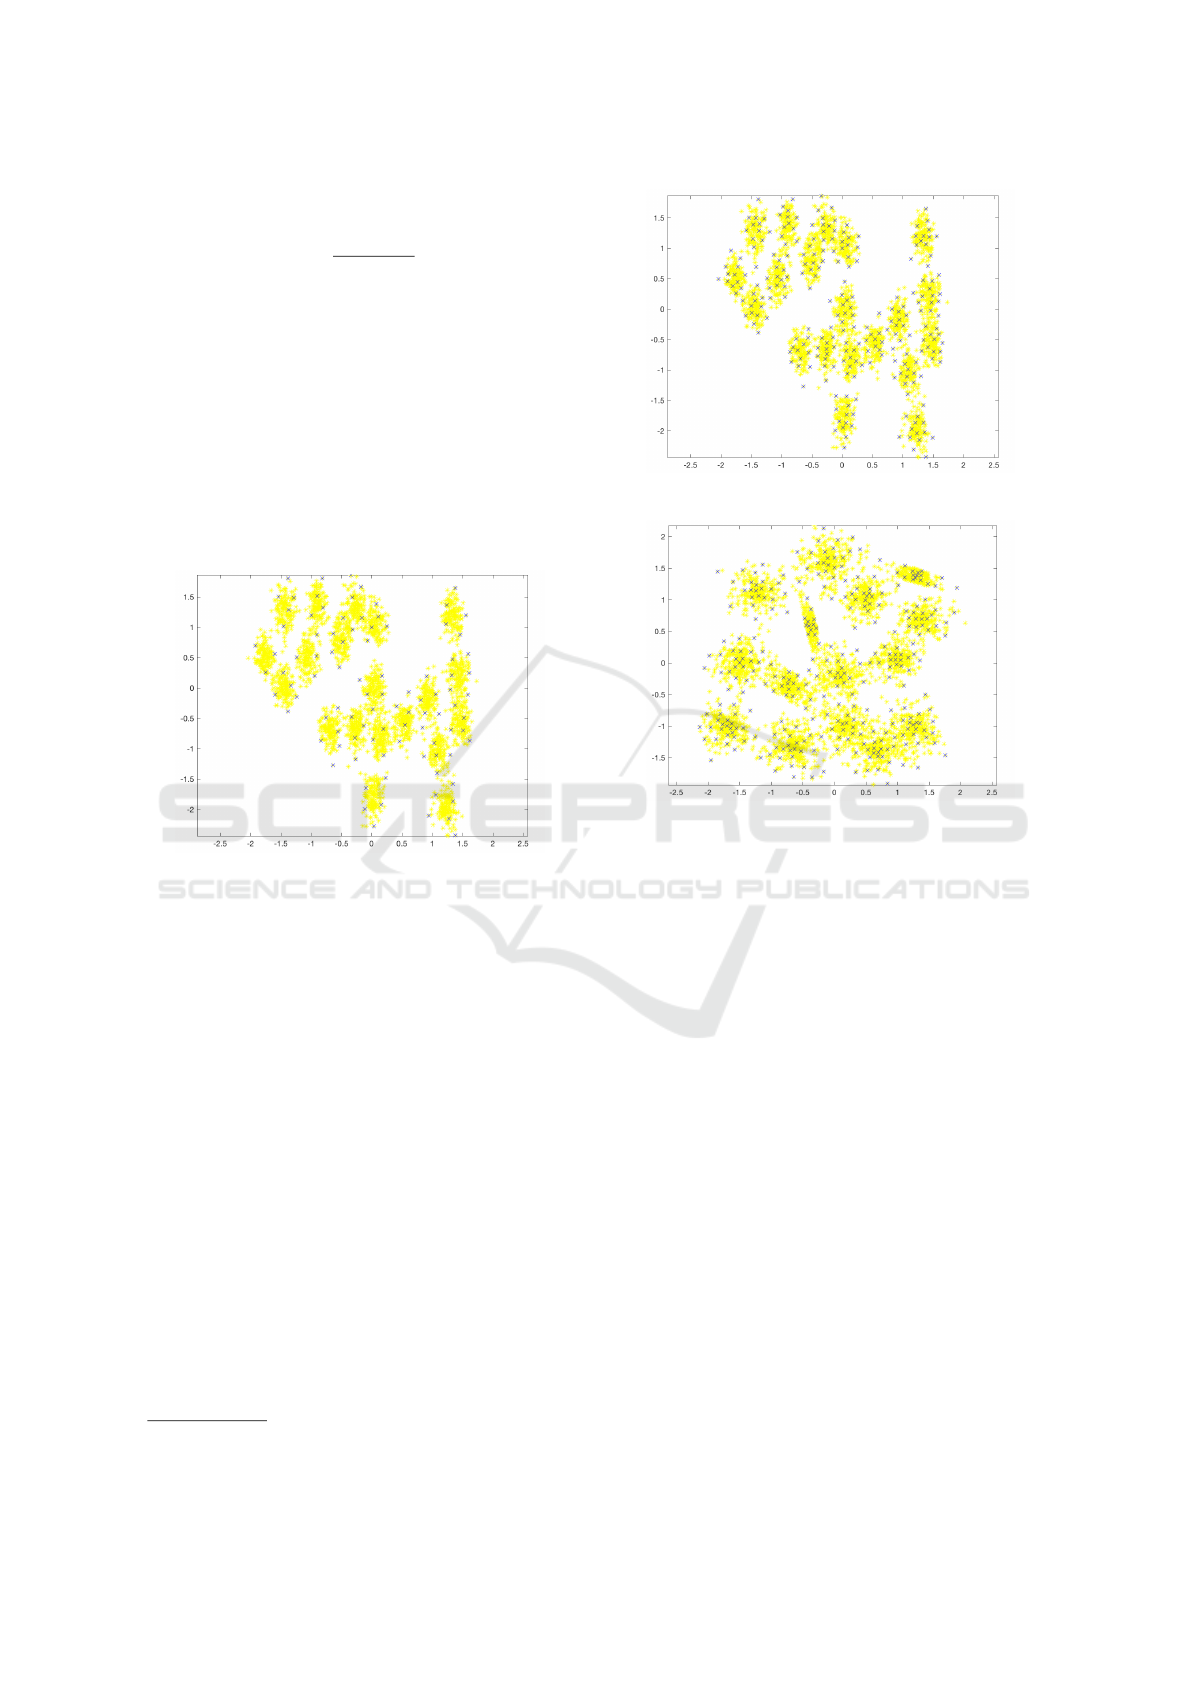
. Fig. 1 and Fig. 2 show
the results tested for S1 dataset with several values of
ε. The size of the dataset is 3000. For ε = 0.2, the ob-
Figure 1: The sample of S1 dataset obtained by ProTraS
with ε = 0.2, the sample size is 97.
tained sample consists of 97 data points. We observe
that the points are selected at border sides of clusters
of the set. This is due to the principle of farthest-
first traversal. We now decrease the value of ε. The
number of sample points is thus increased. Fig. 2
shows the sample with ε = 0.1. The sample points
are now distributed uniformly over the dataset, mean-
ing that the structural representativeness of the sam-
ple is higher. The size of the sample is 261. This is
reasonable when compared with the size of the whole
dataset.
However, since the method is based on farthest-
first traversal, the points are farthest among a group
should always be chosen. These points are not use-
ful in some cases. For example, assume that we are
clustering a very large dataset in which the separa-
tion of clusters of the dataset is low. If we apply a
ProTraS for sampling the dataset, the sample will in-
clude some points located at the middle of clusters
(see Fig. 3). That makes it difficult to process groups
which include these points in clustering task.
1
https://cs.joensuu.fi/sipu/datasets/
Figure 2: Obtained sample with ε = 0.1 and the size is 261.
Figure 3: The sample of dataset S8 consisting of 5000
points, which is obtained with ε = 0.1, the size is 327.
Another issue that can arise is that a point in a
sample is at the boundary of a dataset as farthest-first
selecting (see points marked by red circle). The dis-
tance of the points and a cluster can be longer than
that between clusters in the sample. This leads to
wrong clustering. Consequently, the results of clus-
tering on the whole dataset might be inaccurate.
In order to overcome the difficulty mentioned
above, the next section describes our technique in
which the representative in a group is re-selected to
be the center of the group. Furthermore, some points
in the sample can be removed if they are less useful
for the mining purpose.
4.2 An Improved Technique
Given a dataset P = {x
i
}, for i = 1, 2,...,n and a given
ε > 0, our method firstly calls ProTraS to obtain S =
{y
j
} and P(y
j
) for j = 1,2,. . . , s. The method next
tries to find out some sample points, which have low
representativeness and remove them from the sample.
A point in remaining points is then replicated by the
center of the set of patterns which the point repre-
sents. The details of the method are given in Algo-
rithm 2.
DATA 2019 - 8th International Conference on Data Science, Technology and Applications
360
Algorithm 2: Coreset-based algorithm for sampling.
Require: P = {x
i
}, for i = 1,2,.. ., n, a tolerance ε > 0.
Ensure: A sample S = {y
j
} and P(y
j
), for j = 1,2, .. ., s.
1: Call ProTraS for P and ε to obtain S = {y
j
} and P(y
j
).
2: S
0
=
/
0.
3: for all y
j
∈ S do
4: if |P(y
j
)| is greater than a threshold then
5: y
∗
k
= argmin
y
k
∈P(y
j
)
∑
y
l
∈P(y
j
)
d(y
k
,y
l
).
6: S
0
= S
0
∪ {y
∗
k
}.
7: end if
8: end for
9: S = S
0
.
10: return S and P(y
∗
j
), for j = 1,2, .. ., s
0
, where s
0
≤ s.
Line 4 in the algorithm decides if a sample point
will be select into our sample, i.e., S
0
. This is per-
formed using a threshold. |P(y
j
)| denotes the number
of patterns in P with y
j
∈ S being their representa-
tive. A small value of |P(y
j
)| means that the repre-
sentativeness of y
j
is low. It thus is not necessary and
then can be removed from the sample. The value of
the threshold should be chosen due to the distribution
characteristics of datasets.
For y
j
∈ S that is not removed, line 5 computes the
center of the group represented by y
j
, to consider re-
placing it. The center here, denoted by y
∗
k
, is defined
to be the point in P(y
j
) such that the total distance to
all others in the group is minimized. The set S
0
in-
cluding such y
∗
k
is the output sample of the algorithm.
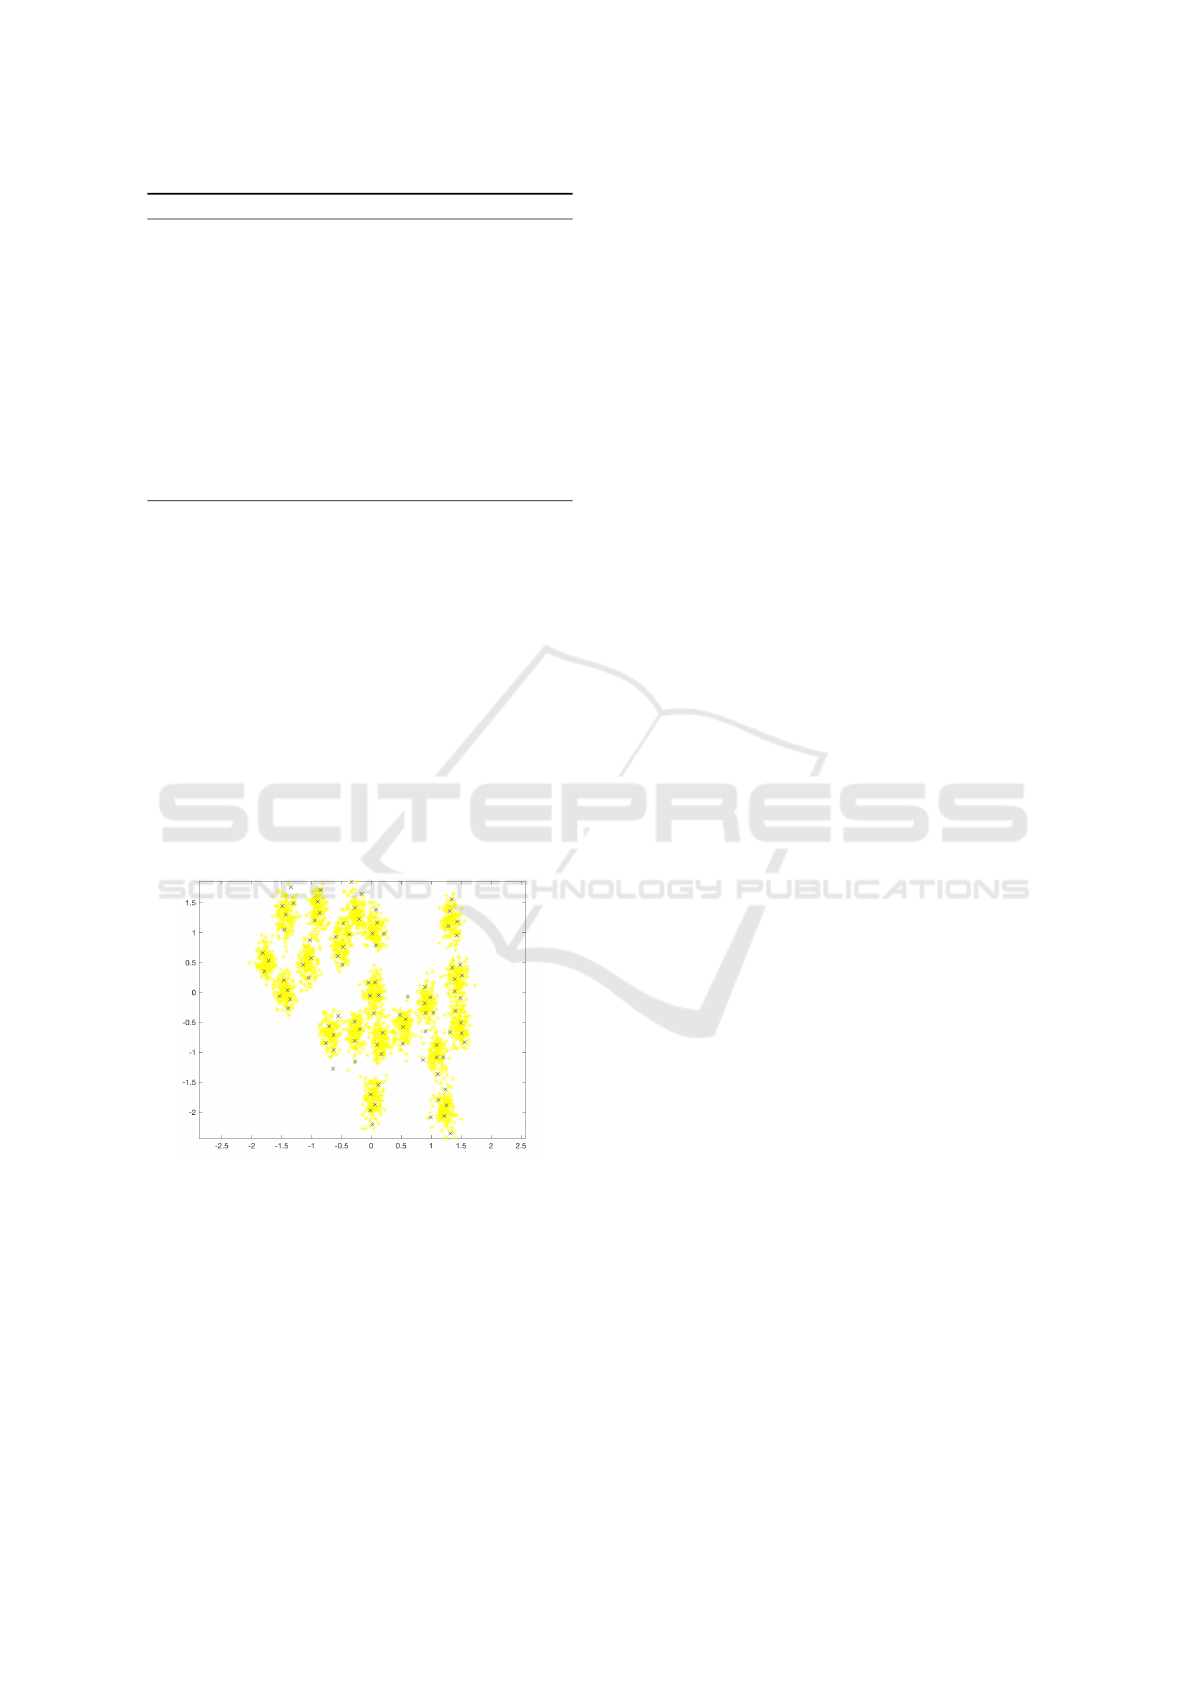
Figure 4: The sample of dataset S1 obtained with ε = 0.1
by our algorithm.
We now discuss to indicate the meaningful of S
0
.
Let us describe the replication of the representative
y
j
∈ S. This task aims at moving the representative of
a group into its center. There are two cases that can be
happen. If y
j
is located at the border of a cluster and
it represents P(y
j
) in that cluster, the center of P(y
j
)
should be located near of that cluster than any other of
the dataset. This helps S
0
to highlight the cluster ten-
dency of the dataset. In case that y
j
is strictly inside of
a cluster, it might be not far from the center of P(y
j
).
The change of distance from y
j
to the center is thus
small. In practice, most of such y
j
also is the center
of P(y
j
). Therefore, S
0
still keeps the main structure
of the whole dataset, where the distribution density is
high. Fig. 4 shows the sample obtained by our algo-
rithm for S1 dataset. The sample represents better the
structure of the dataset, compared with that shown in
Fig. 1 abtained by ProTraS. We note also that, as men-
tioned, Line 4 of our algorithm will remove a number
of points y
j
whose small value of |P(y
j
)|. This can
helps us to deal with noisy data and outliers which
usually are low representative.
5 EFFICIENT BIG DATA
PROTOTYPING WITH
CORESETS
As seen in the previous section, the investigation of
the benefits of the coreset method could achieve reli-
able results that could support the shifting from tra-
ditional cities to Smart Cities. Indeed, the new mod-
ern environment characterizes by integrating various
smart applications that demand autonomous commu-
nication between intelligent devices for responding to
specific tasks necessary for citizens’ lifestyle. The
digitization of the transport systems is one of these
applications that reflect this big advancement of mod-
ern cities, in which IoT sensors play a crucial role in
realizing the vision of future transportation. In fact,
the digitization of smart road infrastructure and ve-
hicles (i.e., cars) produce each day a significant data
through IoT devices that could be used to manage and
optimize various transport applications, such as route
planning, surveillance applications, situation recogni-
tion, weather prediction, accident detection, applica-
tions for pedestrians, emergency management, traffic
control, autonomous driving, traffic prediction, etc.
As a result, the shared transportation data can min-
imize the risks that hit back the safety of citizens
as well as contribute to building a sustainable smart
transport environment (Priyan and Devi, 2019).
The achievement of this vision of future trans-
portation requires a perfect processing of data. How-
ever, in practice, it is hard to obtain reliable and accu-
rate outcomes since the majority of transport works
focuses on applying the Big Data techniques with-
out paying attention to the rapid changes in the size
of data. For example, jamming attack topic in wire-
less vehicular ad-hoc networks (VANET) is one of the
hard challenges in the transportation domain that aims
at securing the vehicle network communication by
developing anti-jamming attack applications. To do
Scaling Big Data Applications in Smart City with Coresets
361

that, the machine learning techniques are used such
as in (Yao and Jia, 2019), where a multi-agent Q-
learning algorithm has been developed for solving
the formulated anti-jamming Markov game. Simi-
larly, as in (Kosmanos et al., 2018), the authors have
proposed a detection framework by combining two
supervised machine learning methods, which are K-
Nearest Neighbors (KNN) and Random Forests (RF),
with the metric of the variations of the relative speed
(VRS) between the target and the jammer. Another
example k-means (Pang et al., 2017), where its ad-
vantages are used to predict the number of multi-
ple jamming attackers and ensure the preset functions
of VANET. However, the common issue with these
works is the use of the whole data during the applica-
tion of Big Data techniques. Yet, the size of datasets is
increasingly being gathered by ubiquitous smart IoT
sensors. That means the manipulation of whole data
might increase the computational cost and time of
data processing exponentially. Thus, our proposed so-
lution could address those problems by turning large
data into very small yet representative data. Further, it
could guarantee the best manipulation of data in real-
time as well as the scalability of outcomes. As a re-
sult, the advantages of coreset could play an essential
role in the success of transport systems that depend
on the efficient integration, representation, and man-
agement of data.
6 CONCLUSIONS
In this paper, we have proposed a sampling tech-
nique, coreset, for Big Data. The coreset can ex-
tract the key features of the Big Data while reducing
the Big Data to a manageable data scale. Besides,
we have proposed a few improvement techniques for
coreset. Based on the coreset technique, we have pro-
posed a possible Big Data application in the context of
Smart City. Since Smart City is changing and updat-
ing quickly, different possible applications, especially
with Big Data, are frequently proposed. In order to ef-
ficiently test the feasibility the proposed application,
we envision that the coreset technique can be used to
efficiently build the prototypes for Big Data applica-
tions in Smart Cities. As future work, we plan to ap-
ply the coreset technique in real-world Smart City ap-
plications and evaluate how much effort and time can
be saved by using the proposed coreset technique.
ACKNOWLEDGEMENTS
This research is funded by Vietnam National
University Ho Chi Minh City (VNU-HCM) un-
der grant number C2019-20-13. The work was
also supported from European Regional Develop-
ment Fund Project CERIT Scientific Cloud (No.
CZ.02.1.01/0.0/0.0/16 013/0001802). Access to the
CERIT-SC computing and storage facilities provided
by the CERIT-SC Center, under the ”Projects of
Large Research, Development, and Innovations In-
frastructures” programme (CERIT Scientific Cloud
LM2015085), is greatly appreciated.
REFERENCES
Agarwal, P. K., Har-Peled, S., and Varadarajan, K. R.
(2005). Geometric approximation via coresets. In
COMBINATORIAL AND COMPUTATIONAL GE-
OMETRY, MSRI, pages 1–30. University Press.
Bangui, H., Ge, M., and Buhnova, B. (2018a). Exploring
big data clustering algorithms for internet of things
applications. In Proceedings of the 3rd International
Conference on Internet of Things, Big Data and Se-
curity, IoTBDS 2018, Funchal, Madeira, Portugal,
March 19-21, 2018., pages 269–276.
Bangui, H., Ge, M., and Buhnova, B. (2018b). A research
roadmap of big data clustering algorithms for future
internet of things. International Journal of Organiza-
tional and Collective Intelligence, 9(2):16–30.
Bangui, H., Ge, M., and Buhnova, B. (2019). A research
roadmap of big data clustering algorithms for future
internet of things. International Journal of Organiza-
tional & Collective Intelligence, 9(2):16–30.
Cordts, M., Omran, M., Ramos, S., Scharw
¨
achter, T., En-
zweiler, M., Benenson, R., and Schiele, B. (2015).
The cityscapes dataset. In In CVPR Workshop on the
Future of Datasets in Vision, volume 2.
Erl, T., Khattak, W., and Buhler, P. (2016). Big Data Fun-
damentals: Concepts, Drivers & Techniques. Prentice
Hall Press, Upper Saddle River, NJ, USA, 1st edition.
Ge, M., Bangui, H., and Buhnova, B. (2018). Big data for
internet of things: A survey. Future Generation Com-
puter Systems, 87:601–614.
Ge, M. and Dohnal, V. (2018). Quality management in big
data. Informatics, 5(2):19.
Har-Peled, S. and Mazumdar, S. (2004). On coresets for
k-means and k-median clustering. In Proceedings of
the Thirty-sixth Annual ACM Symposium on Theory
of Computing, STOC ’04, pages 291–300, New York,
NY, USA. ACM.
Kosmanos, D., Karagiannis, D.and Argyriou, A. L. S., and
Maglaras, L. (2018). Rf jamming classification us-
ing relative speed estimation in vehicular wireless net-
works. arXiv preprint arXiv:1812.11886.
Matheus, R. and Janssen, M.and Maheshwari, D. (2018).
Data science empowering the public: Data-driven
DATA 2019 - 8th International Conference on Data Science, Technology and Applications
362

dashboards for transparent and accountable decision-
making in smart cities. Government Information,
Quarterly.
Neuhold, G., Ollmann, T., Rota Bulo, S., and Kontschieder,
P. (2017). The mapillary vistas dataset for semantic
understanding of street scenes. In In Proceedings of
the IEEE International Conference on Computer Vi-
sion, pages 4990–4999.
Pang, L.and Guo, P. C., X., Li, J., and Xue, Z. (2017). Es-
timating the number of multiple jamming attackers in
vehicular ad hoc network. In In 2017 6th International
Conference on Computer Science and Network Tech-
nology (ICCSNT), pages 366–370. IEEE.
Priyan, M. K. and Devi, G. U. (2019). A survey on inter-
net of vehicles: applications, technologies, challenges
and opportunities. nternational Journal of Advanced
Intelligence Paradigms, 12(1-2):98–119.
Ros, F. and Guillaume, S. (2017). Dides: A fast and ef-
fective sampling for clustering algorithm. Knowledge
and Information Systems, 50(2):543–568.
Ros, F. and Guillaume, S. (2018). Protras: A probabilis-
tic traversing sampling algorithm. Expert System with
Applications, 105:65–76.
Rosenkrantz, D. J., Stearns, R. E., and Lewis, P. M. (1977).
An analysis of several heuristics for the traveling
salesman problem. SIAM Journal on Computing,
6(3):563–581.
Scharw
¨
achter, T., Enzweiler, M., Franke, U., and Roth, S.
(2013). Efficient multi-cue scene segmentation. In
In German Conference on Pattern Recognition, pages
435–445. Springer.
Step
´
anek, P., Ge, M., and Walletzk
´
y, L. (2017). It-enabled
digital service design principles - lessons learned from
digital cities. In Information Systems - 14th European,
Mediterranean, and Middle Eastern Conference, EM-
CIS 2017, Coimbra, Portugal, September 7-8, 2017,
Proceedings, pages 186–196.
Xinyu, H., Cheng, X., Geng, Q., Cao, B., Zhou, D., Wang,
P., Lin, Y., and Yang, R. (2018). The apolloscape
dataset for autonomous driving. In In Proceedings of
the IEEE Conference on Computer Vision and Pattern
Recognition Workshops, pages 954–960. IEEE.
Yao, F. and Jia, L. (2019). A collaborative multi-agent re-
inforcement learning anti-jamming algorithm in wire-
less networks. IEEE Wireless Communications Let-
ters.
Scaling Big Data Applications in Smart City with Coresets
363
