
PARADA: Control Support System for Parades
José Evaristo Lima, Pedro Miguel Faria
a
and Pedro Miguel Moreira
b
ARC4DigiT, Applied Research Centre for Digital Transformation,
Instituto Politécnico de Viana do Castelo, Viana do Castelo, Portugal
Keywords: Courtship, Parade, Distributed Coordination, Control Support System, GPS, Mobile Application.
Abstract: The parade of “Festas in honor of Nossa Senhora D’Agonia”, which is celebrated every year in the city of
Viana do Castelo, it is one of the highlights of the traditional festival, that gathers hundreds of people in one
giant parade throughout the city streets, this event attracts thousands of spectators. Due to its big dimension,
it presents some difficulties regarding its organization. The lack of cohesion of the parade during its course is
one of the issues observed that originates several and large empty spaces, which end up to discredit the parade.
This paper presents the study the issue related with the Parade’s organization/planning, by proposing a
solution based on low-cost technologies. In this work we intend to study the problem of empty spaces,
proposing a solution based on low cost technologies and evaluating the performance of this solution with its
potential users. In this way, a process of collect information was initiated through the observation of the
Parade, an interview with the organization and an inquiry of the collaborators and another one for the drivers.
Based on the collected information, it is proposed a solution that uses smartphones to interconnect through a
mobile application and also a web management application, in order to monitor the Parade and help in
suppressing empty spaces. The proposal was evaluated to its potential users through a functional prototype.
Usability and User Experience tests were performed and the results were promising. It is intended to validate
the proposed solution in the field and extend the proposal to other Parade.
1 INTRODUCTION
Every year, in the city of Viana do Castelo, there is a
parade of “Festas in honor of Nossa Senhora
D’Agonia”, with the goal of presenting to everyone
the traditions of the city and the surrounding villages.
The event gathers 3.000 participants and dozens of
floats, in an extension of 2300 meters, throughout the
streets of Viana do Castelo, where thousands of
people watch this parade (Viana Festas, 2017).
The parade has been having a serious issue for
several years regarding its extension, i.e., throughout
the parade there are many empty spaces, resulting in
several breaks of the cohesion and fluidity of the
course. This study proposes to research about these
issues by suggesting some solutions based on low
cost technologies and evaluating the performance of
this solution amongst its potential users.
On the literature searched it was not possible to
find any kind of system that could solve this issue.
Thus, information was collected by observing the
a
https://orcid.org/0000-0001-5673-8678
b
https://orcid.org/0000-0001-8371-0347
parade of Sr. ª D’Agonia and by contacting with the
staff, including the floats drivers and their
collaborators, with the help of an interview and two
queries. This process helped to identify the main
difficulties which every person involved on the
parade faces.
In order to project a solution based on the gathered
information, a proposal was developed, named
PARADA. The PARADA uses smartphones which
interconnect through a mobile application for
Android and iOS devices (APPARADA) and, also, a
web management application, with the ability of
monitoring the parade and helping the suppression of
empty spaces.
Finally, a prototype was designed to be validated
by its potential users, by simulating a micro parade.
To evaluate the usability and users experience,
regarding APPARADA and GESPARADA, there
were used the SUS test – System Usability Scale and
UEQ test – User Experience Questionnaire,
respectively.
352
Lima, J., Faria, P. and Moreira, P.
PARADA: Control Support System for Parades.
DOI: 10.5220/0007932703520359
In Proceedings of the 16th International Conference on Informatics in Control, Automation and Robotics (ICINCO 2019), pages 352-359
ISBN: 978-989-758-380-3
Copyright
c
2019 by SCITEPRESS – Science and Technology Publications, Lda. All rights reserved
2 RELATED WORK
The technological advances of smartphones, in terms
of processing capacity, sensor integration and data
communication, has motivated a massive use by users
around the world. In particular, the fact that
smartphones integrate different types of sensors, e.g.,
location, environmental variables, user activity,
facilitate the acquisition of information about what
surround us. Based on these data, it is possible to
develop applications and provide services geared to
user needs (Rafael, et al., 2016).
Conventional, low-cost GPS devices that are
integrated in various devices, e.g. smartphones, have
an error that, depending on the purpose of their use,
may or may not meet the necessary requirements. In
the case of the monitoring of the geographical
position of vehicles, this error can be an obstacle to
the safety of users. In order to increase location
accuracy, even using non-professional GPS sensors,
there are algorithm-based solutions that allow you to
present more accurate data.
Han Kim propose an algorithm to increase the
accuracy in positioning the data collected by a low-
cost GPS sensor. This method uses the information
collected by the GPS sensor associated with the
vehicle in progress, places that data in a buffer and,
after the buffer is complete, matches the vehicle's
trajectory with a predefined map (Kim, et al., 2016).
Based on the determined error, rotations and
translations are applied to correct the trajectory of the
vehicle.
Based on the location of the vehicles through the
GPS coordinates and later calculation of their travel
path, it is possible to monitor the traffic at a certain
location. For this, it is only necessary to count
vehicles and contextualize the route on a map. By
knowing the number of vehicles that circulate in a
certain street and adding the vehicles that follow the
same route, it is possible to anticipate a forecast of the
traffic.
What D’Andrea e Marcelloni presents is a system
to detect congestion and traffic incidents, from GPS
data collected in real time. This system aims to be an
useful tool for countries and cities in the management
of traffic density. Therefore, it uses the GPS sensors
present in vehicles and mobile devices to acquire the
necessary data for the system, e.g., smartphones or
tablets (D'Ándrea and Marcelloni, 2017).
Adaptative Cruise Control (ACC) is a system that
keeps the speed of a vehicle constant and safe for the
user, taking into account the distance of the vehicle in
front of you. This system uses "LiDAR" (Light
Detection And Ranging) sensors to measure distance
and cause accelerations and decelerations as needed
(Noei, et al., 2016). However, the response of the
sensors to the changes has a large delay. In addition,
they are also susceptible to interference from the
environment, e.g., in the case of vegetation, their
physiognomy may induce the result of the reflection
in error. A solution to increase the response speed of
the ACC system is to use wireless communication
between vehicles-to-vehicles (V2V) and vehicles-to-
infrastructures (V2I) (Noei, et al., 2016). This
paradigm is called the Cooperative Adaptive Cruise
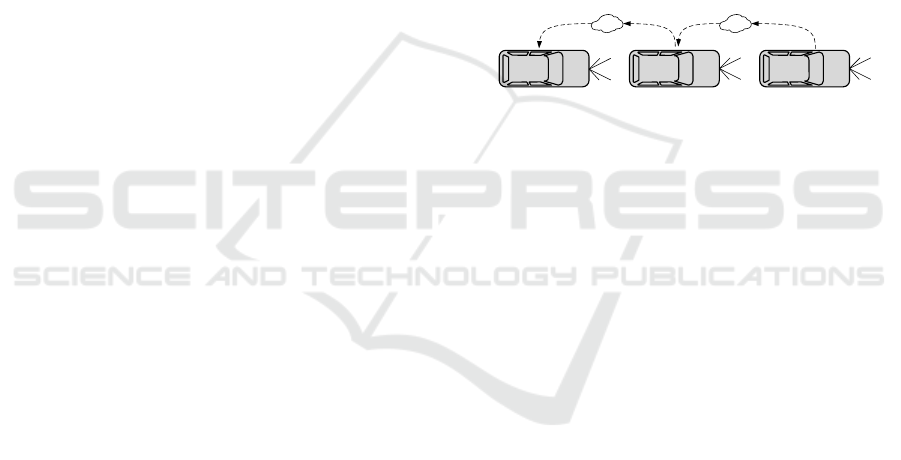
Control (CACC). Considering, then, the scheme in
Figure 1 composed of three vehicles, a leader and two
precedents: each vehicle sends via V2V
communications its current state that includes its
position, speed and acceleration or deceleration. This
same data is received by other vehicles traveling in
the same range (Noei, et al., 2016).
Wireless comm. Wireless comm.
Follower l=1Follower l=2Follower l=3
LIDAR LIDARLIDAR
Figure 1: Representation of CACC system based in (Noei,
et al., 2016).
However, as it happens with the GPS signal, both
are susceptible to electronic interference. These
interferences may arise from natural causes, e.g.,
electromagnetic noise or, hence, structured attacks by
hackers (Carson, et al., 2016). To keep the system
robust, both systems should be used together, i.e.
"Drive" sensors for distance control and V2V or V2I
communication to increase the speed response.
3 METHODOLOGY
The parade of Sr. ª D’Agonia is organized by sections,
in which each section is composed of participants
and/or floats (Carros Alegóricos). During the parade
the distance between the sections should be
considered uniform, for example, between the
participants and the float of section 1 and section 2
there should be a range of 10 meters. An empty space
happens when this distance is not respected and does
not allow the spectacle to be able to see two
consecutive sections in a row, as Figure 2 shows.
Thus, a break in the flow of the parade is generated.
During the parade there are people, called
collaborators and organizers, who are responsible for
keeping the parade together and organized, avoiding
the existence of empty spaces. These people are
PARADA: Control Support System for Parades
353
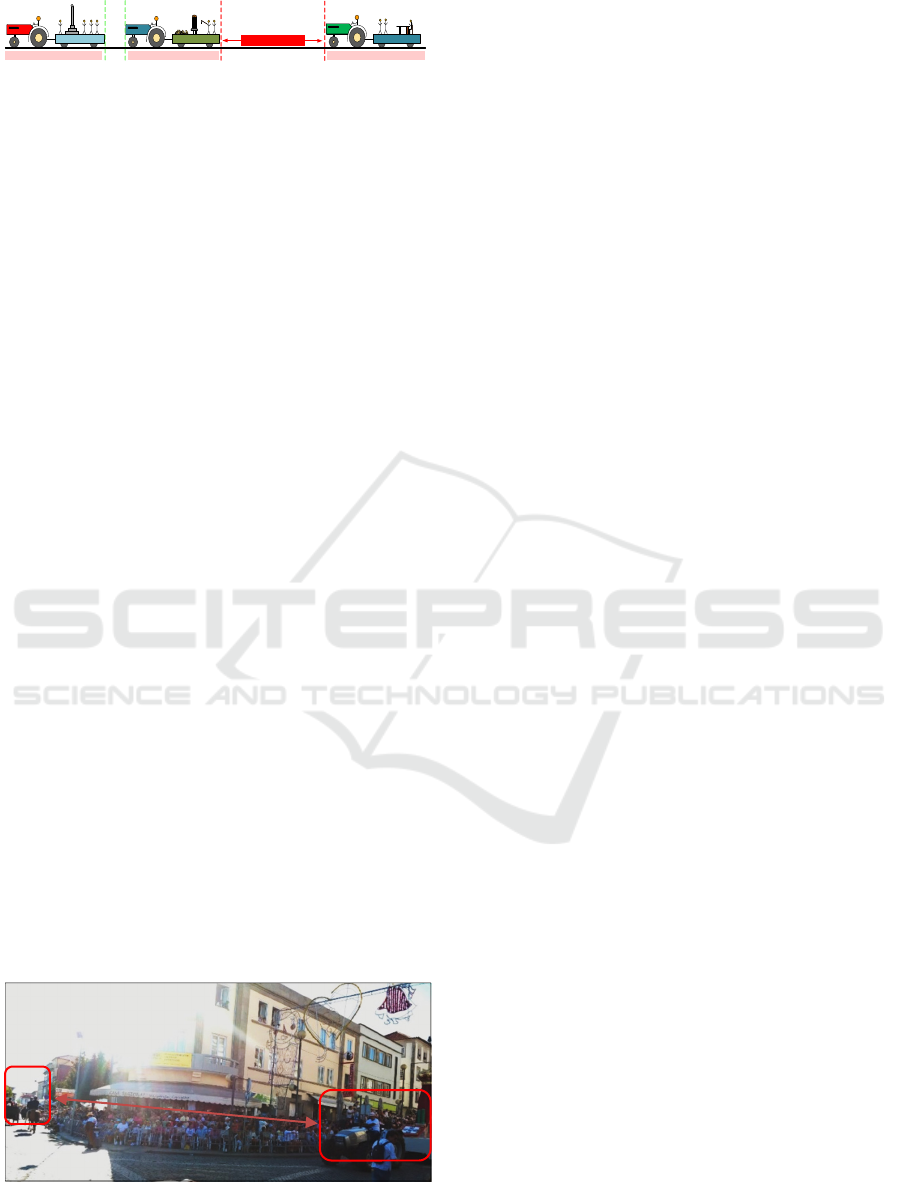
Empty space
Normal
distance
Exceeding distance
~10m
~100m
Section 1 Section 2 Section 3
Figure 2: Representation of a parade end the empty space
issue.
distributed throughout the length of the parade and
they help to keep its flow, from beginning to end, in
order to keep it as constant as possible. The floats’
drivers, by driving vehicles with low acceleration,
play an important role in the cohesion of the parade,
due to limiting its progress and consequently its flow.
3.1 Observation and Analysis of 2017
Parade
Observing the parade allows, in addition to
establishing the problems that cause empty spaces, to
have a realistic overview of the whole process in
order to develop a proposal for an effective solution.
The point of observation in the parade that took most
interest was the southern top of Avenida dos
Combatentes. This location allows you to observe the
parade along the avenue (from a south to north
perspective), in the curve at the bottom of the avenue
and following the Gil Eanes (west), which are points
where is more troublesome.
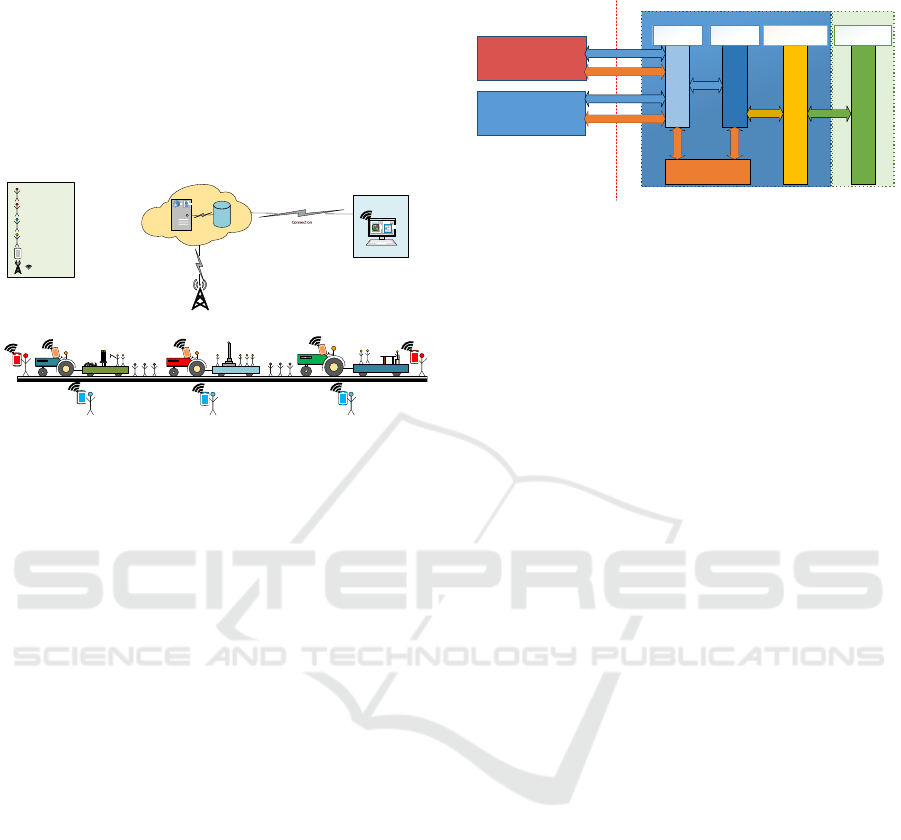
During the analysis of the flow of the 2017
Parade, at the chosen point, information was collected
about stops, particularly their duration, and
photographs, which depicted breaks or empty spaces.
In Figure 3 it is possible to verify a distance
between two sections that begins to be noticeable. At
this point it is known that there is a separation of
about 30 meters and, if the horses move faster or the
tractor advances more slowly, an empty space is
created. In the case of a curve, it is known that the
public at the knee of the curve, either on the side of
the avenue (right side of the figure) or on the side of
Gil Eanes (left side of the figure), cannot have visual
perception in order to observe the parade in a long
Figure 3: 2017 evidence of large distance between two
sections of the parade.
stretch, as can be seen in the photograph. At this moment a
subliminal idea is transmitted to the audience that the
parade may have ended.
3.2 Requirements Assessment
The current panorama of the Parade, regarding the
problem of empty spaces, was obtained using the
observation of the 2017 Parade, as presented in the
previous point, and an interview with the person in
charge of planning and organizing the Parade,
Hermenegildo Viana. With this interview, we verified
the methodology that has been implemented in order
to minimize this problem. Hermenegildo says that
when there are empty spaces throughout the parade,
it is communicated through a radio system. However,
due to the city's geography and architecture, this
system becomes obsolete and only works properly in
straight line. This way, it would be ideal if there was
a possibility to avoid this problem or to be able to
readjust it. In order to do this, the front of the Parade
would have to be informed of the existence of the
various spaces, as well as the collaborators
themselves, who, with this knowledge, would be able
to fill the empty areas.
Groups of people who have a direct connection to
the problem of empty spaces in the Parade, in order
to identify and minimize them in real time, are the
organizers, collaborators and drivers. In order to
collect information from the collaborators and
drivers, it was decided to carry out a survey for each
group instead of an interview. Due to similar tasks
performed by organizers and collaborators, only the
collaborators were questioned.
The survey directed to collaborators consists of
four parts, the first part of which is intended to
characterize the sample, and the next three focus on
aspects of the parade. Regarding the characterization
of the participants, six questions were defined: age,
gender, number of collaborators, which area of the
parade was responsible, whether the mobile phone is
used and which operating system the mobile phone
performs. In terms of the three parts related to the
parade, the first part of the question was about the
problems that occur in the parade and what are the
main difficulties. Then, in the second part, eleven
statements were asked about the degree of agreement
on a 7-level Likert scale, and finally the third part
questioned the type of information that a system
should provide to drivers, collaborators and
organizers, respectively.
The questionnaire for drivers is composed of three
open-ended questions, where one intends to perceive
the difficulties they face during the parade.
30
m
ICINCO 2019 - 16th International Conference on Informatics in Control, Automation and Robotics
354

3.3 Requirements Analysis
The interview to the person in charge of the
organization and the surveys to collaborators and
drivers were based on the 2017 Parade.
In the case of collaborators, a total of 43
participants in the 2017 parade, 20 were randomly
selected. All of them responded to the survey. The
average age of the collaborators who responded was
49 years, being in the middle age group. 60% were
female and 40% male. The responses obtained from
the survey led to the following conclusions:
• They have experience as collaborators in the
parade, around 90% have done so more than
once;
• All have mobile phones, mostly with Android
®
system (70%), 20% refer to iOS
®
;
• The main difficulties affecting the flow of
courtship are uncoordinated stops;
• They consider communication with the
organization efficient, although between
collaborators and floats’ drivers it is ineffective;
• It is difficult to perceive the state of the parade in
areas far from where they are;
• It is very important to have an application-based
system that provides real-time information on the
status of the parade to be sent to organizers,
collaborators and drivers;
• It is very relevant, in terms of organization, to
have a system that allows viewing the parade in
real time;
• It is useful for an application to provide
information to collaborators about the status of
the parade, stops and allow contact with the
organization;
• For drivers an application should convey
information about stops and fluidity; however,
because they should drive, they should only
receive this information by collaborators;
• For the organization, an application must provide
all the information useful to the parade,
highlighting fluency, stops, information
messages, among others.
In the case of the drivers' survey, of the 33 who
participated in the 2017 parade, 14 were randomly
selected, of whom 11 responded to the survey. The
respondents were all males with an average age of 46
years. The responses obtained through the survey
drivers, after a qualitative analysis, allowed to draw
the following conclusions:
• The main difficulties found during the parade by
the drivers are related to the disrespect by the
public about the circulation of floats and the
improper stops in places such as the avenue.
• As to the classification of communication among
the participants, one of the problems is related to
the fact that the information that the
collaborators/ organization pass on to the drivers
are contradictory to each other.
• Regarding the possibility of a system that helps
the organization is said to be useful, especially
for collaborators and organization.
3.4 Definition of Requirements
The information obtained from the members of the
parade, namely the Organization, Collaborators and
Drivers allowed, after processing the data, to draw
conclusions about the main needs that an auxiliary
system to the parade’s organization should respond
to. Based on this information, the following
requirements were defined:
• Allow real-time communication between
collaborators, organizers and drivers;
• Receive / send information in real time about
events related to the parade (stoppages, breaks,
participants, among others);
• Make it possible to display the status of the
parade in real time at any point in the route on a
map (mainly for the organization);
• Transmit information to drivers about stoppages
and the fluidity of the parade.
3.5 Proposal for a Solution
The main requirement on which the whole solution
proposal is based is related to the need for
interconnection of Organizers, Collaborators and
Drivers. It is essential that the system is networked
and allows the exchange of information in real time
between these elements. It should also enable the
organization to visualize, in real time, the status of the
Parade and allow its monitoring.
After a first approach to the problem, smartphones
presented themselves as a tool with the ideal
capabilities to integrate the proposed solution. In
addition to its network connectivity capabilities, it is
possible to develop applications and the incorporation
of several sensors.
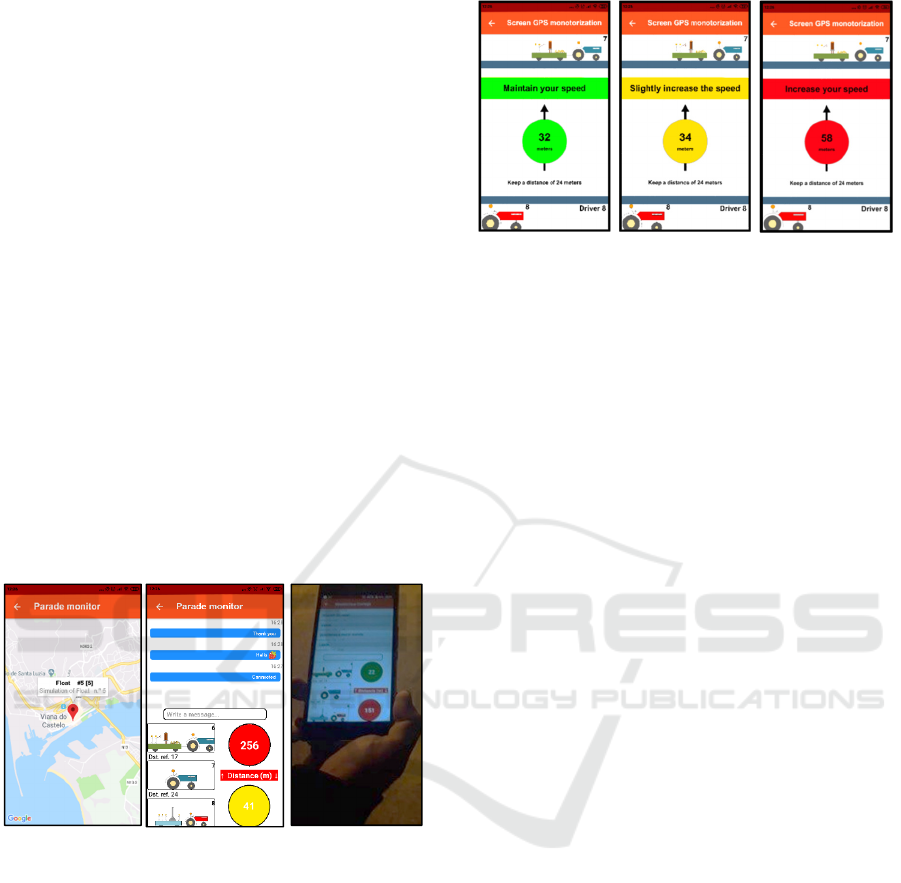
The proposed solution to solve the problem of
empty spaces, shown in Figure 4, supposes the use of
a smartphone by Organizers, Collaborators and
PARADA: Control Support System for Parades
355
Drivers, on which a certain application is executed.
This application provides relevant information about
the Parade, in real time, according to the type of user,
i.e. Organizer, Collaborator and Driver. It also
enables communication between Collaborators and
Organizers.
Moreover, it proposes a web application
(optimized for computers) for the Organization that
does not accompany the Parade on the ground.
Su btit le
Organizers
Driver
Collaborator
Organizer
Participant
Smartpho ne
Cloud
Web Server
Access Point
Database
Connection
Internet
connection
Figure 4: Schema of the proposed solution.
4 PARADA
The PARADA is composed by a mobile application,
APPARADA, which has an interface adaptive to the
type of user and by a management Web application,
GESPARADA, which incorporates a set of functions
for configuration and organization of the Procession.
The characteristics of the architecture of
PARADA presuppose the creation of a set of
heterogeneous applications to access at the same
back-end, i.e., database and computational logic. It
was decided, due to integration issues, to provide all
the functions of operation with this backend, through
a layer of services. This way, it is possible to create a
level of abstraction large enough to be easier to
implement applications on several platforms, extend
or add components or new operations to these
applications in a relatively simple way. It should be
noted that because some of these operations are
security-sensitive, security solutions have been
implemented over these services.
The RESTful architecture, Figure 6, was used to
allow access to resources through URIs (addresses)
and to use the HTTP protocol, namely the GET,
POST, PUT and DELETE verbs, to perform
operations. The data exchange is done in JSON
notation. The storage of this data is done using a
MongoDB database, type NoSQL, which stores them
in the same format. This data model substantially
facilitates the implementation and use of CRUD
(Create, Read, Update, Delete) services as it does not
require conversions.
nodeJS
D
A
T
A
MongoDB
(Database)
S
C
H
E
M
A
S
Mongoose Model
(CRUD Services)
Web
Socket
GET
POST
PUT
DELETE
Controller
R
O
T
E
s
(url)
Express
(Router)
!
TOKEN
JSONWebToken
Authentication/Descodification
T
O
K
E
N
A
U
T
H
APPARADA
GESPARADA
LOGIN || TOKEN
!TOKEN
LOGIN || TOKEN
!TOKEN
Client side Server side
Figure 5: Architecture of the proposed solution.
4.1 GESPARADA
GESPARADA is a web application, with an interface
adapted to the theme Ace Admin
®
, supported by the
RESTful architecture that allows the user to define,
configure and monitor the Process. Each page
responds to at least one requirement, e.g., viewing
parade status in real time. Only Organizer users have
access to all features. This system was developed to
be generalist, i.e. support the management of several
parades and for each of them it is possible to associate
floats, their drivers and collaborators. It can be
divided into three parts for a better understanding:
• Creation of the Parade (and floats and users).
• Parade Setup:
o Allocation of floats;
o The Association of Floats to drivers;
o Association of collaborators and organizers.
• Parade Monitoring:
o See the parade in real-time on a map;
o Send / receive information messages.
4.2 APPARADA
The mobile app, APPARADA, is intended for
Android
®
and iOS
®
mobile phones. This requirement
was one of the conclusions of the collaborators survey
since, based on the answers, collaborators were using
smartphones with both systems. In order to facilitate
the development of the application, a study was made
on hybrid development platforms that support both
systems (Latif, et al., 2017) (Martinez and Lecomte,
2017) (Biswas, et al., 2013). It was decided, based
onthe development capabilities, support for both
systems and the documentation available, for a
development with React Native. React Native allows
you to develop the application for smartphones using
JavaScript and the React architecture. This tool
ICINCO 2019 - 16th International Conference on Informatics in Control, Automation and Robotics
356
enables the creation of applications that use real
components as if they were programmed in
Objective-C / Swift or Java.
The APPARADA is used in two strands, the first
focuses on the acquisition of data and the second on
the presentation of data. It can be summarized in the
following functionalities:
•
Monitor the GPS position (drivers using
APPARADA send their geographic position to
the server).
•
Monitor the Parade (based on the geographic
position, it is shown to drivers, collaborators and
organizers the distance between floats, namely
for what follows immediately in front of and
behind).
•
View of the Parade on a map (any user can see
the geographic position of the floats on a map).
The user, when opening the application, may
choose to see the parade on the map, which does not
require authentication, or else, being a Driver,
Collaborator or Organizer, can authenticate and
access the other functions dedicated to monitoring the
Parade.
Figure 6: The main interface of the APPARADA.
GPS position monitoring is a feature of the mobile
application that is only available to Driver type users.
This feature supports the parade monitoring because
it is based on the GPS coordinates acquired that the
distance calculations are carried out, through the
Distance Matrix API of Google Maps, between Floats
and what you can see of the parade on a map.
In this case, the Driver type user, after
authentication, is identified in GESPARADA as the
driver of a particular float. From that moment, it starts
to acquire GPS coordinates of the place where it is
and sends them remotely. In response, the distance in
meters from the float that follows in front of you is
shown on the screen as shown in Figure 7.
Figure 7: The interface for the Drivers user.
Inside the red circle of Figure 7 written the current
distance that the car 7 has towards the car 6. At the
bottom appears a message indicating which distance
should be maintained, in this case 24 meters. At the
top (after the arrow) messages are generated with
suggestions that help the driver make a decision. Both
the circle and the rectangle with suggestions change
colour according to whether or not the distance to the
car that follows is met. In particular, this functionality
is sensitive to both positive and negative distances,
i.e. if the Driver is at a lower distance than the
recommended (reference) distance it is suggested to
slow down. If you are at a greater distance than
recommended, you are advised to increase the speed.
Finally, it should be noted that this functionality
should not interfere with driving, so the interface is
only expositive. In the case of the interface (Figure 7
– middle image) for the Collaborators or Organizers
the aspect changes slightly since the use of a chat is
already foreseen for sending and receiving
information.
5 TESTS AND RESULTS
A test scenario was created for the solution proposal,
in order to obtain information on the Usability of the
System and on the User Experience.
Twelve volunteers gathered in Viana do Castelo
to walk a portion of the parade of Sr. ª D'Agonia on
foot from the start (next to the Eiffel bridge) to the
end of the avenue using the mobile application. Eight
of the volunteers have already participated in the
parade as participants and one of them has already
collaborated. The rest were spectators only. The
system's functionalities were explained and
assignments were assigned to each one.
Thus, of the twelve people, seven took the
position of user of the type driver and four of the type
Collaborator, using APPARADA. The rest was an
organizer and used the GESPARADA. In order to
PARADA: Control Support System for Parades
357
evaluate the PARADA on the part of the participants,
the System Usability Scale (Brooke and others, 1996)
and UEQ - User Experience Questionnaire (Cota, et
al., 2014) were used.
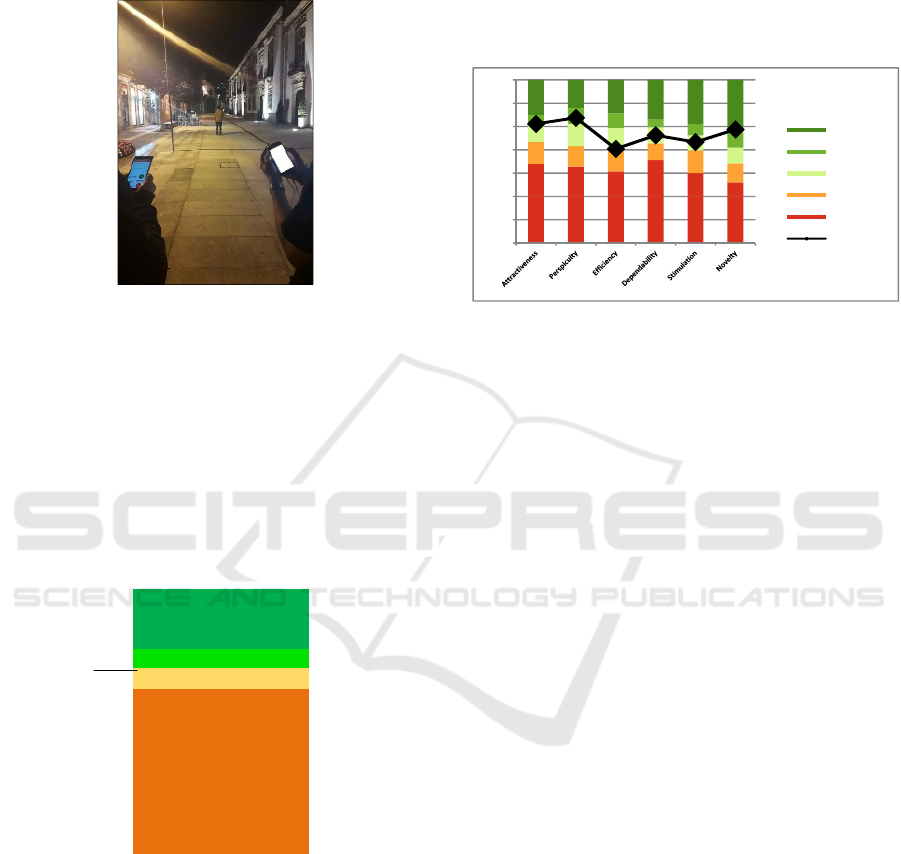
Figure 8: Photograph collected during the conducted test.
5.1 System Usability Scale (SUS)
In this case, the SUS test was used with a 5-level
Likert scale, from totally disagreeing to fully
agreeing. The PARADA Score resulting from the
evaluation, based on the responses to the SUS survey,
is 69.4. The SUS Score predicts a ranking above the
average for values greater than 68. Thus, PARADA
is considered good in terms of usability (Bangor et al.,
2009).
62.6
70.5
77.8
90.1 “best imaginable”
85.5 “excellent”
71.4 “good”
50.9 “ok”
35.7 “poor”
20.3 “awful”
12.5 “worst imaginable”
69.4
PARADA
Figure 9: SUS evaluation score levels.
5.2 User Experience Questionnaire
(UEQ)
To classify the PARADA through the UEQ test, the
Portuguese version (Cota, et al., 2014) was used with
a questionnaire composed of twenty-six items
grouped into six characteristics. In the graphic of
Figure 10 it is possible to see the classification of the
application, based on the obtained answers.
In this evaluation it is possible to verify that the
efficiency has a level almost below the average that is
identified with the failures in the acquisition of the
GPS coordinates. Moreover, at the interface level all
functions performed without any problem, both at the
level of APPARADA and at the level of
GESPARADA.
Figure 10: UEQ evaluation graphic.
6 CONCLUSIONS
The proposed solution, known as PARADA, has the
main goal of helping the organization of the parade
and its organizers, Drivers and collaborators, to carry
out their tasks in a more assertive and easy way.
Drivers, using APPARADA, can consult the
mobile application to check if they are complying
with the distance between vehicles. At the same time,
Collaborators can control this distance and receive or
send information to other Collaborators and
Organization through a chat. With this
communication model it is possible, at any point in
the parade, to have the information exchanged in real
time. This factor is crucial to keep the parade orderly
and also to give a quick response when unforeseen
events occur. In addition, the application allows you
to see the positioning of all Floats on the map,
including the description of each one, which also
allows anyone to identify the float and where it is.
At GESPARADA, the organization has at its
disposal a detailed information panel on each float,
including a map with the positioning along the route.
With this information it is possible that the organizers
anticipate possible empty spaces even before they
happen.
Finally, it should be noticed that this system
serves as support to the organizers and not as a
complete automation substitute of the human
component of the organization, as the event has a
huge complexity and there is vast amount of existing
distributed knowledge that will be bewildering to
model. Thus, the intended developed system -
-1,00
-0,50
0,00
0,50
1,00
1,50
2,00
2,50
Excellent
Good
Above Average
Below Average
Bad
Mean
ICINCO 2019 - 16th International Conference on Informatics in Control, Automation and Robotics
358

PARADA should be used to support decision making
regarding control and coordination, i.e. as a control
support system.
This work was always developed with close
proximity to the users, and a survey was carried out
based on queries and an interview that allowed the
identification of the main problems and the main
expectations of the various collaborators. The
developed system was tested, namely through the
simulation of a mini parade, after which it was
verified the fulfilment of the requirements of
functionality as well as usability and user experience.
The results are very promising, however, some
interface situations have to be corrected, as well as to
perfect any problems of precision in obtaining
coordinates that, if they occur, can have a negative
impact on the usefulness of the proposed solution.
The use of Bluetooth devices to improve position
accuracy and robustness to GPS errors/faults is being
considered in the future developments. Our intention
is to validate the presented system by using it in a real
parade (namely the Nossa Senhora D’Agonia Parade)
and measuring the impact and its benefits with respect
to the existing organizational model and tools.
REFERENCES
Biswas, A., Pilla, G. and Tamma, B. R., 2013.
Microsegmenting: An approach for precise distance
calculation for GPS based its applications. s.l., s.n., pp.
327-332.
Brooke, J. and others, 1996. SUS-A quick and dirty
usability scale. Usability evaluation in industry,
Volume 189, pp. 4-7.
Bangor, A., Kortum, P., and Miller, J., 2009. Determining
what individual SUS scores mean: adding an adjective
rating scale. J. Usability Studies 4 (3), 114-123.
Carson, N., Martin, S. M., Starling, J. and Bevly, D. M.,
2016. GPS spoofing detection and mitigation using
Cooperative Adaptive Cruise Control system. s.l., s.n.,
pp. 1091-1096.
Cota, M. P., Thomaschewski, J., Schrepp, M. and
Gonçalves, R., 2014. Efficient measurement of the user
experience. A Portuguese version. Procedia Computer
Science, Volume 27, pp. 491-498.
D'Ándrea, E. and Marcelloni, F., 2017. Detection of traffic
congestion and incidents from GPS trace analysis.
Expert Systems with Applications, Volume 73, pp. 43-
56.
Kim, H. S., Park, J. B. and Joo, Y. H., 2016. A position
accuracy enhancement algorithm for a low-cost GPS
receiver under distance boundary consideration. 2016
International Conference on Robotics and Automation
Engineering (ICRAE), p. 83.
Latif, M., Lakhrissi, Y., Es-Sbai, N. and Nfaoui, E. H.,
2017. Review of mobile cross platform and research
orientations. (1) ERSI Laboratory, Sidi Mohamed Ben
Abdelah University, s.n.
Martinez, M. and Lecomte, S., 2017. Towards the quality
improvement of cross-platform mobile applications.
2017 IEEE/ACM 4th International Conference on
Mobile Software Engineering and Systems
(MOBILESoft), p. 184.
Noei, S., Sargolzaei, A., Abbaspour, A. and Yen, K., 2016.
A Decision Support System for Improving Resiliency
of Cooperative Adaptive Cruise Control Systems.
Procedia Computer Science, Volume 95, pp. 489-496.
Rafael, P. T., César, T. H. and Hiram, G. Z., 2016. Full On-
Device Stay Points Detection in Smartphones for
Location-Based Mobile Applications. Sensors, Vol 16,
Iss 10, p 1693 (2016), p. 1693.
Viana Festas, 2017. VianaFestas - Associação Promotora
das Festas da Cidade de Viana do Castelo. [Online]
Available at: http://www.vianafestas.com [Acedido em
08 julho 2018].
PARADA: Control Support System for Parades
359
