
Application of the Statistical Analysis Methods for Improving the
Managing the Dealer-service Network Efficiency
Irina Makarova
1a
, Larisa Gabsalikhova
1b
, Eduard Mukhametdinov
1c
, Ksenia Shubenkova
1d
and Aleksandr Kapitonov
2
1
Kazan Federal University, Syuyumbike prosp., 10a, 423822, Naberezhnye Chelny, Russian Federation
2
Public Corporation KAMAZ, Transportny pr-d, 70, Naberezhnye Chelny, Russian Federation
Keywords: Dealer-service Network, Effectiveness, Data Envelopment Analysis, Performance Evaluation.
Abstract: The article proposes a method to increase the efficiency of dealership service centres (DSC) based on the
system analysis use. The method is based on clustering the DSC into groups according to formats, a
differentiated approach to the assessment of their activities and the relative useful efficiency calculation. The
analysing purpose effectiveness of the dealer-service network (DSN) is to obtain an objective efficiency
assessment of each DSC, identify the causes of inefficient operations and develop a strategy for improvement.
As a formalization tool, it is proposed to use the software product Konsi-DEA ANALYSIS, which allows to
evaluate the parameters of the objects functioning, as well as calculate the coefficients of efficiency and
superefficiency for each of them.
1 INTRODUCTION
The main trend in the development of the economy
and society, with which intelligent and rational
management and development of all activity fields,
including the automotive industry, is currently
associated is digitalization. In all activity areas, the
methods for finding optimal sustainable solutions is
associated with the fourth industrial revolution, which
is the main trend in the development of the
automotive industry. The high motorization level and
markets globalization are forcing automakers to
search for new solutions, constantly improving both
the vehicles design and production technology, as
well as new ways to attract customers.
The automotive industry development and
growing competition in world markets are leading to
the new trends' emergence, such as expanding the
assembly plants network in different countries,
updating the automotive vehicles’ model line,
including the emergence of more environmentally
friendly and energy-efficient models. Today, the
economy's linear model, based on the principle of
a
https://orcid.org/0000-0002-6184-9900
b
https://orcid.org/0000-0003-3325-3285
c
https://orcid.org/0000-0003-0824-0001
d
https://orcid.org/0000-0002-9246-6232
“take - make - waste”, has been replaced by the so-
called “circular economy”, which has a reducing and
closed nature and is based on minimizing the
consumption of primary raw materials and reducing
waste disposal. All this is completely correlated with
such a key direction of the Fourth Industrial
Revolution, as the formation of environmentally
friendly technical and technological systems.
According to research by the international company
Persistence Market Research (2015), their
introduction to the automotive industry will create an
opportunity to reduce raw material consumption by
98%; to save 83% of energy; reduce the finished
products cost to 40% and carbon dioxide emissions to
87%. This can be realized in the event that the
manufacturer is responsible for his product over the
course of its life cycle.
Under these conditions, the task of creating a
corporate service system and increasing the processes
efficiency in it becomes urgent. In order to ensure
customer loyalty, their trust in the brand, the producer
company should improve the quality of not only the
vehicles produced, but also their subsequent service
638
Makarova, I., Gabsalikhova, L., Mukhametdinov, E., Shubenkova, K. and Kapitonov, A.
Application of the Statistical Analysis Methods for Improving the Managing the Dealer-service Network Efficiency.
DOI: 10.5220/0007878506380648
In Proceedings of the 5th International Conference on Vehicle Technology and Intelligent Transport Systems (VEHITS 2019), pages 638-648
ISBN: 978-989-758-374-2
Copyright
c
2019 by SCITEPRESS – Science and Technology Publications, Lda. All rights reserved
support. The customer focus principle can be
implemented by intellectualizing the management
and scientific methods using. Modern enterprises
operate in conditions of tough competition, which
dictates the need to improve their activities' every
aspect efficiency. Evaluation of the enterprise
functioning effectiveness is based on identifying and
systematizing the functions performed by the
enterprise and in the selection of indicators that allow
you to perform a information qualitative analysis and
make decisions based on the results obtained. In this
case, the selected methods should provide an increase
in the analysis accuracy and prediction in evaluating
the effectiveness.
There are three main methods groups for
measuring performance: use of economic factors as
variables reflecting the enterprise efficiency;
mpirical (expert) performance evaluation methods;
methods based on creating effectiveness' confines.
Considering the corporate service's system of as
one of the subsystems of a vehicles manufacturer,
functioning in close cooperation with production and
logistics systems, the connection between which is
carried out using information and material flows, we
can affect the efficiency and sustainability of the
entire system, which increases vehicles
competitiveness and consumer confidence in the
brand.
2 EXISTING METHODS FOR
ASSESSING THE AUTO
SERVICE EFFECTIVENESS
Customer focus and processes optimization by
reducing losses are the main goals of the transition to
Industry 4.0. The need for production systems'
constant adjustment to customer variable
requirements stimulates the development of new
methods in the framework of process organization or
production control (Trojanowska et al., 2011).
The automotive industry development is the
country's industrial standard, according to which the
vehicles number in a country can be considered as an
indicator of the living standard. That is why
industrialized countries will seek to develop the
automotive industry. The authors of the article
(Maritz, Alex et al., 2013) as a basis for research in
the automotive industry in 2007-2009 integrated data
coverage analysis (DEA) and Malmquist
performance analysis to measure total efficiency
(TE), pure technical efficiency (PTE) and scale
efficiency (SE) of nine automotive enterprises in
Taiwan to further improve the manufacturers
operational efficiency.
The research (Kumar, 2017) aims to measure and
evaluate the performance of vehicles manufacturers
in India using the DEA, which provides management
with information on the most efficient vehicles
manufacturing companies in the observations set and
identifies relatively inefficient companies compared
to the most effective. The authors believe that the
main factor leading to their poor performance is
excessive employee costs. Therefore, enterprises
must dismiss some employees, or reduce the costs of
employee benefits.
To optimize the processes using various methods
or combinations thereof. As a rule, this is an
effectiveness assessment and identification of
"limited" places for the subsequent processes
modernization. The document (Lee et al., 2010)
DEA-based analyses the performance of twenty
retailers of two Taiwanese car dealers, combined with
practical automotive industry experience. The authors
select important input and output variables for
evaluating effectiveness to identify the causes of
inefficiency, and also suggest ways to improve
project management. The DEA is introduced to
evaluate the performance of each automotive
company retailer. The result makes it possible to
develop operations management strategies for car
dealers in the future in accordance with an important
goal for all car retailers - maximizing revenue and
permanent job. In addition, it is important to
strengthen the ability of vendors in the field of
archiving in customer services and increase customer
loyalty and stability.
The article authors (Hladík, 2019) propose a new
DEA method for calculating efficiency indicators.
The method is based on reliable optimization: higher
estimates for those decision-making units (DMU),
which remain effective even for large simultaneous
and independent changes of all data and vice versa.
The approach novelty is that it preserves the ranking
order in comparison with the classical approach and
is a single invariant. It is naturally normalized, so it
can be used to calculate unrelated models' universal
DMU indices, which makes it possible to evaluate
both inefficient and effective decision-making units.
The method can be extended to generalized or
alternative models, for example, for processing
interval data. The new approach can be adapted to
reliability and to other used measurement methods,
such as super-efficiency models or cross-
effectiveness. Particularly promising are recent
results in assessing cross-performance, two-step and
network
DEA, probabilistic approaches, and DEA
Application of the Statistical Analysis Methods for Improving the Managing the Dealer-service Network Efficiency
639
models with uncertainties.
Currently, the decision-making process is
confronted with various problems that need to be
taken into account and planned, since, for example,
programs in the automotive industry related to vital
human factors are not structured (Baghery et al.,
2018). One way to evaluate potential failures of a
product or process and their consequences is the
process failure mode and effects analysis (PFMEA),
which identifies actions to eliminate failure or reduce
their effects throughout the product life cycle. A well-
known method for prioritizing failures is the risk
priority number (RPN). The authors have proposed a
new approach to setting priorities in the uncertainty
condition. In addition, a new score was used to
calculate the risk of each production process. In fact,
the assessment obtained from the combination of the
DEA interval methods and the Gray relational
analysis (GRA) reduced the traditional method
problems, since the production processes were
prioritized on their criticality basis. At this stage, the
SOD factors (severity, occurrence, and detection)
were considered as input to the DEA interval model.
Then, the first stage results were used as input data in
the GRA method for determining the priority of parts
manufacturing processes. Finally, some suggestions
were made to avoid potential disruptions in auto parts
production processes, and some measures were taken
in this regard.
Given the fierce competition between large
companies, in recent years, a sustainable supply chain
has been recognized as a key component of corporate
responsibility. The supplier’s classification can
facilitate the selection of a suitable supplier for
management, which saves the company time and cost.
DEA has become one of the most commonly used
tools for measuring the supplier’s relative
performance. The article authors (Tavassoli et al.,
2019) proposed a new super-efficient stochastic
model DEA for measuring the supplier’s relative
effectiveness in the presence of zero data. The
proposed method has many advantages for
practitioners in the sustainability field and supply
chain management: first, the proposed model can
rank all providers in sustainability terms. Secondly,
the recently developed stochastic model DEA with
high efficiency provides an optimal solution using
cost savings and output surplus for efficient suppliers.
Third, the newly developed DEA-DA can predict new
supplier group membership with high accuracy in a
stochastic context.
The article (Rashidi, 2019) presents a results
comparative analysis achieved in identifying the most
preferred steady suppliers, using two widely used
methods - methods for Technique for Order
Preference by Similarity to Ideal solution (TOPSIS)
and DEA. Fuzzy DEA and fuzzy TOPSIS apply to a
common set of logistics service providers in Sweden.
Sources of initial materials and the associated
supplier selection process are important strategic
decisions and actions in any organization. Research is
important for interested parties because it indicates
future research directions: comparison of suppliers'
sustainability assessment methods; sensitivity results
analysis to the number and nature of the criteria
included in the analysis; solution to the problem of
data collection. The results show that the suppliers
rating depends on the method. Recognizing the
assessment methodology, suppliers should be
motivated to respond quickly to the sustainability
requirements of the procuring customer.
Choosing a sustainable supplier is the process of
identifying the right partners for the supply
organization with the best value for money while
reducing the various effects of its activities on society
and the environment. Therefore, it plays an important
role in promoting the organization towards
sustainable development. This article (Moheb-
Alizadeh et al., 2019) aims to develop an inclusive
multi-purpose model of mixed integer linear
programming that takes into account several periods,
several products and multimodal transportation to
evaluate suppliers and distribute order volumes.
Among all the Pareto-optimal solutions to the original
multi-purpose programming problem, a preferable
solution is reasonably chosen based on the DEA
super-efficiency indicator of all procuring firms as a
decision support tool. The applicability of the
proposed approach is illustrated by the example of
practical use in the automotive industry.
Since the beginning of the 90s, many world
countries began to pay great attention to the
environment and raw materials resources. This
interest has led to the emergence of a number of new
concepts in the industry, including reverse logistics
(RL). To solve these problems, scientists use an
effective class of methods called metaheuristics. The
article authors (Rachih et al., 2019) classify
previously published articles on RL on the basis of
metaheuristic approaches and the problematic context
of the reverse supply chain.
Article (Wang et al. 2019) explores seven
enterprises from the Shanghai Professional
Committee for the vehicles disposal. The authors
believe that the proposed decision analysis using
several attributes in the ELV industry will facilitate
the ELV processing industry's management.
Empirical studies in this article indicate the
LogiTrans 4.0 2019 - Special Session on Logistics and Transport in the Industry 4.0
640
following. (1) The projection value of relatively
inefficient DMU can be calculated by combining
triple exponential smoothing and DEA, which
provide the increasing efficiency goal, while a slight
improvement in inefficient DMU can be used to build
a decision matrix for efficiency. (2) The preferred
solution can be selected from the decision matrix by
combining the entropy weight method with TOPSIS.
In addition, comparison of decision making
alternatives on additive weighting, weighted product
and ELECTRE (Elimination et Choice Translating
Reality) and TOPSIS alternatives can be performed to
test the stability of the decision process with several
attributes. (3) Finally, a combination of the above
methods is an effective decision-making method with
several attributes to increase the efficiency of the
ELV industry with several input and output
indicators.
Recycling is aimed at preventing rapid depletion
of natural resources when converting received waste
into value for the economy. However, this process is
becoming a serious problem in the automotive
industry, which requires the joint participation of
several players in a complex supply chain. The study
(Kusakcı, 2019) aims to develop a fuzzy mixed
integer positioning model for the ELV RL network in
accordance with the directives in force in Turkey.
Accordingly, this study uses a new approach and
assumes that the ELV supply on the network is
uncertain. The proposed mathematical model's merits
are proved in a real scenario, which solves the
problem of designing RL for ELVs generated in the
Istanbul metropolitan area.
The article goal (Hao Hao, 2018) was to improve
the reverse supply chain's management in the
automotive industry in the context of environmentally
friendly, circular and sustainable development by
predicting the number of vehicles with an expired
service life to be processed, by creating a multi-factor
model. To solve the problems associated with
nonlinear characteristics and the uncertainty of the
recyclable end-of-life vehicles' number, as well as
taking into account the many factors affecting the
recirculation’s number, this article presents a
combined forecasting model consisting of a grey
model, exponential smoothing and an artificial neural
network, optimized by the particle swarm
optimization (PSO) algorithm.
Faced with the contradiction between the rapid
growth in the vehicle owners' number and the low
return rate of end-of-life vehicles, RL services carried
out by third-party companies for the processing and
ELV dismantling in China are experiencing major
problems in a low carbon economy. This document
builds a four-level model of a RL network, which
includes ELV sources, collection centers, recovery
centers, and dismantling. The article authors (Xiao et
al., 2019) have developed a mathematical model of
mixed integer linear programming (MILP) for
solving a problem using the Lingo global
optimization software. The MILP model is designed
to minimize overall costs (location, transportation,
and environment) arising from improper management
of the ELV. The model successfully takes into
account the location, number and power level of key
objects at the same time, which increases the RL
network model's complexity and fills the existing gap
in research. This provides important management
implications for the ELV reverse logistics system at
two levels: the macro environment and the micro-
industry. For the micro-industry, logistics managers
must rationally distribute the number and key
facilities' capacity level in the network, including the
collection and dismantling center, based on actual
demand, and reduce resources waste and
environmental pollution. Further research may
develop stochastic or fuzzy MILP models that take
into account unspecified ELV quantities. In addition,
it is possible to design a closed supply chain network,
which direct consists and RL for the simultaneous
processing of the ELV, in order to analyse the
environmental impact on different network
participants.
As can be seen from the above review, the method
choice depends on the problem being solved.
Nevertheless, the DEA is a good optimization tool in
management tasks at different stages of the life cycle
in the automotive industry.
3 RESULTS AND DISCUSSION
3.1 The Indicators System for
Evaluating the Auto Service
Effectiveness
The dealer-service network (DSN) is a complex
system consisting of dealer service centers (DSC)
with three subsystems that operate in close
cooperation, i.e. implemented on the principle of "3S"
(Sales, Spare Parts, Service). The DSN development
has two directions - the construction of new and the
reconstruction of existing service centers. The
development strategy includes the effectiveness
evaluating stage of the existing network to identify
leaders and outsiders, determine the using possibility
existing development potential, taking into account
the regional development strategy and the vehicle
Application of the Statistical Analysis Methods for Improving the Managing the Dealer-service Network Efficiency
641
fleet structure. The direction of DSN development
depends on the analysis results and the effectiveness
of the existing DSN.
For an adequate comparison effectiveness of the
existing DSC, we must bring their indicators to a
comparable form. Each such DSC has potential
capabilities that can be numerically designated by a
parameters set. The activity of any of these DSC is to
strive to maximize apply their capabilities, what can
be represented as a desire for an ideal system. The
ideal system, in this case, is such a system that reaches
the possibilities limit in its activity. Thus, we must
understand that there are enterprises that are similar
in their capabilities and activities. These enterprises
can be ranked according to the achievement
indicators degree of an ideal system. Since any DSN
is comprised of DSC with different potential, before
comparing their effectiveness, it is necessary to
cluster them into comparable groups.
If the service needs are not met in a separate
region, then it is necessary to consider options for
adjusting the development strategy:
1) if the existing DSN is inefficient, and DSC have
reached the limits of their capabilities, then the
DSN needs to be expanded (either upgrading
existing enterprises or building new ones);
2) if the existing DSN works inefficiently, but the
DSC has not reached the possibilities limit, then it
is necessary to identify the inefficiency causes and
stimulate the efficiency's growth;
3) if the existing DSN is working effectively, but
there is a significant gap between the leaders and
the outsiders, then the strategy should be revised
and the resources should be adjusted.
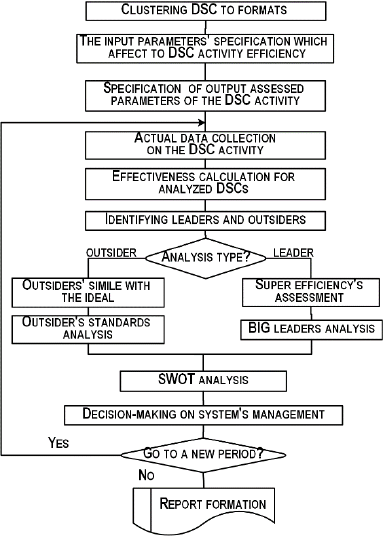
For these purposes, i.e. to evaluate the DSN
effectiveness and to choose the development strategy,
the authors developed an algorithm (Buyvol et al.,
2017), which consists of several stages (Figure 1).
At the first stage, it is necessary to evaluate the
effectiveness of the existing region DSN, including in
terms of its expansion possibility:
clustering of the DSC into single-format groups
by characteristics (parameters characterizing
enterprises in terms of types of activities, volumes
of services, etc.) and services provided types for
comparability of performance estimates;
identifying leaders and outsiders within single-
format groups, for which it is necessary to
determine the input parameters characterizing the
potential of the DSC under study and their
capabilities, which are defined as the resources
used in the work; and the conditions in which the
DSC
operates, as well as the output parameters
that reflect the its results activities.
Under efficiency on this case is understood as the
ratio of output parameters to input. The DSN subject
will be effectiveness if, at the current value of the
input parameters, it is impossible to achieve large
output values. For the outsiders identified as a result
of this phase, a SWOT analysis is carried out, which
allows to determine the strategic planning directions,
identifying the strengths and weaknesses of the
enterprise, as well as identifying threats and
opportunities for development.
Figure 1: Algorithm for evaluating the effectiveness of the
DSN functioning.
The second stage consists in a comprehensive
assessment of the regional needs for vehicles-care
services under region’s development different
scenarios. To perform the analysis, you need:
assess the current state of the park and fulfil the
forecast of changes in its structure under different
development scenarios;
calculate the need for services under different
development scenarios;
assess the capabilities of the existing DSN to meet
the needs for corporate service operations at
various development scenarios;
determine the most appropriate scenario for the
DSN development, taking into account
investment risks.
LogiTrans 4.0 2019 - Special Session on Logistics and Transport in the Industry 4.0
642
At the third stage, the chosen strategy adequacy is
assessed: determination of the current performance
DSC indicators and the complex indicator values of
the DSC effectiveness at the period beginning;
monitoring system status and comparing performance
indicators with baseline ones; indicators analysis,
problem situations identification and strategy
adjustment.
To assess the DSC effectiveness, various analysis
methods are used, one of which is the DEA method,
that allows to evaluate the objects functioning
parameters, which implemented in the Konsi-DEA
ANALYSIS software package (Makarova et al.,
2012). The DEA method is based on creating
effectiveness' confines and finding the relative
performance of each object studied. This method is
used to assess the effectiveness of homogeneous
objects systems that are engaged in the same
activities, while using the same resources. With this
approach, the DSC efficiency is assessed by
comparing it with the “ideal” enterprise, which works
“at the limit” and at the same time uses the resources
at its disposal in an optimal way.
DEA-analysis allows you to highlight the leaders
and outsiders in their format groups, compare them
with the standards and develop objective strategic
solutions for taking the enterprise to the leaders. The
outsider indicators analysis suggests a changes
assessment to which the DSC parameters should be
subjected in order to increase the its activities
effectiveness. To make changes in the outsider's
work, it is necessary to compare it with the standard
(enterprises involved in the formation of the ideal).
Customer satisfaction and loyalty are described in
a non-linear function, according to which it is
beneficial for an enterprise to achieve a high degree
of client loyalty, and not to be content with an average
level, because the regular customers circle can be
formed only at the funds expense spent on increasing
their loyalty (Buyvol et al., 2012).
Potential financial benefits manifest themselves in
the long term, while the consequences of consumer
dissatisfaction manifest themselves much faster and
can be significant, since the secondary effect can
negatively affect to future services provided volumes.
For service companies (b2c), customer satisfaction
score should be above 80%. In case it exceeds 90%,
it can be argued that the company has become one of
the leaders. To achieve customer loyalty in a highly
competitive environment, it is necessary to achieve a
high degree of satisfaction with the services provided.
This means that the company needs to raise the level
of quality of service to a value that is impossible (or
extremely difficult) to copy.
Therefore, it is no coincidence that the ISO 9004-
2000 standard for enterprises certification of
prescribes the mandatory monitoring of the own
consumer’s satisfaction (clients, customers, buyers)
as one of the indicators of the quality management
system efficiency (ISO, 2000). Based on the selected
performance indicators, a comprehensive system for
assessing the DSN subject was developed.
Since the DSC differ in the work performed types,
the results assessment of their activities should also
be carried out differentially, highlighting for each
homogeneous group its own factors list affecting the
efficiency of the results and, consequently, the
enterprise competitiveness. In this sense, the
distinction should be made both of the indicators
themselves and of their values for different DSC
types and also the subjects themselves should be
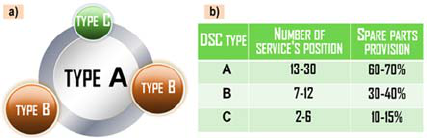
separated into one-format groups. To classify DSC,
you can use a complex indicator characterizing the its
project potential. As a rule, when creating DSN in the
regions, the following scheme is used: in the “bush's”
center there is a large DSC of format A, and on the
“bush's” periphery, depending on the specific
location, there are DSC of format B or C (Figure 2a).
In this case, standard DSC formats are used (Figure
2b).
Figure 2: a) disposition scheme DSC in region; b) DSC
parameters of different formats.
To find the relative effectiveness of each studied
DSC, it is need to determine the input and output
parameters, and the ratio of these parameters will
determine the effectiveness. Due to territorial
dissociation, as well as differences in the functioning
parameters, for the effective DSC work, there should
be a single managing centre, which should receive
timely and operatively information about the
productivity indicators of each DSC. Adjustment of
the development strategy of the DSN, as well as, in
the short term, a change in the managing actions and
the resources redistribution, should take into account
the analysis results of the incoming operational
information.
Analysing the information received, at the first
stage, the DSC productivity indicators are
determined, and then the ineffective activity causes
are identified. If the current efficiency is so low that
Application of the Statistical Analysis Methods for Improving the Managing the Dealer-service Network Efficiency
643

it casts doubt on the enterprise existence, then the
strategy should become short-term and focus
primarily on preventing the funds outflow. Even if the
DSC works effectively, it does not follow from this
that it is necessary to adhere to the chosen strategy.
The market is constantly changing, and the strategy
role is to help the company quickly adapt to changes
in the market. Significant reserves for improving the
competitiveness and corporate service system's
stability are rooted in the management improvement.
One of the methods widely used nowadays involves
monitoring the system efficiency indicators and
comparing their values in the previous and present
periods. Decision making is carried out depending on
how the indicators values have changed.
3.2 Methodology for Evaluating DSC
Effectiveness
In order to assess the performance of each DSC
indicators were comparable, it is necessary to
calculate the relative indicators for each activity.
When DSN analysing, we proceeded from the fact
that the services rendered volume, relative to the
number of work station (K
WST
), is an output
parameter. The following parameters were chosen as
input parameters: using of the production premises
area (K
PPA
), warehouse space (K
WS
), work station
operating time (K
op.t
).
K
WST
- work station use rate - is the ratio of the
services rendered volume to the number of work
station. This indicator allows to evaluate the work
organization, personnel qualification and work
mechanization. The better the work organization
indicators, staff qualifications and mechanization of
work, the higher the efficiency of the work station
use:
(1)
where V - the volume of services rendered, mln. rub;
x - the number of work station, units.
К
PPA
- coefficient of technical workroom area use
- the ratio of the maintenance and repair (M&R) area
to the number of vehicles' maintenance work station:
&
(2)
K
WS
- coefficient of warehouse space use - is the
ratio of the warehouse space area to the work station
number:
(3)
K
op.t
- the coefficient of operating time use is the
ratio of services rendered volume to the product of the
number of work station and hourly productivity:
.
(4)
.
(5)
where T
wsh
is the work shift duration, an hour; N is
the number of work shifts; D
op.y
– the number of
operation days in a year, days.
In order for the calculated efficiency absolute
indicators to be combined into one general aggregate
efficiency indicator, their conversion to the
benchmarkable indicator, reflecting the possibilities
maximum, is need. Evaluation of the DSS
effectiveness involves the use of a complex indicator
q, which is defined as the product of indicators:
∏
.
.
(6)
where k is the number of indicators.
The complex indicator for assessing the DSN
competitiveness is defined as the arithmetic mean of
the complex rating DSC indicators and serves as an
evaluative measure of the whole network:
∑
(7)
For DSC different format groups, the minimum
requirements for the general indicators are different.
They are used to evaluate the DSC (number of
personnel, minimum technical workroom's area,
warehouse space placement, administrative and
household rooms, parking lots, the minimum
equipment set, special tools and accessories, M&R
documentation). These indicators are divided into two
groups: design parameters ("etalon"), affecting to
DSC efficiency, and output calculated parameters.
The design parameters characterize the potential
of the DSC under study and their capabilities, they are
defined as the resources that are used in the work, and
the conditions in which the DSC operates. The
estimated parameters for DSCs of different formats
should also vary and reflect the activities results both
in vehicles sales and spare parts (turnover of spare
parts and sold cars) and in service (services volume
rendered by activity type, customer satisfaction with
the services quality, percentage loading work station).
To evaluate the performance of both individual
DSCs and DSNs in general, it is necessary to have the
initial design parameters of them each, as well as
statistical information about the parameters of their
functioning in different periods. Therefore, for each
typical service center, the optimal its operational
indicators are determined, corresponding to the
projected design capacities (profitability,
profitableness, costs level per client, etc.).
Since the effectiveness of DSC each, regardless of
its format, is characterized by the achievement degree
LogiTrans 4.0 2019 - Special Session on Logistics and Transport in the Industry 4.0
644
of each limiting values of the input design parameters,
it is more logical to use relative unit performance
indicators to compare the integral indicators of the
DSC functioning in each group. Therefore, at the first
stage, relative indicators are calculated,
characterizing the achievement degree of the
maximum values of these parameters, who will be
taken as single performance indicators.
Thus, each DSC will be characterized by
indicators set that comprehensively and adequately
reflect its competitive potential. At the same time,
given that the initial indicators set has a different
physical meaning and the impact nature on the final
DSC competitiveness assessment, they were divided
into groups: I
1
- indicators, the growth of which leads
to an increase in the overall DSC assessment (for
example, the growth of staff qualifications has a
positive effect on the productivity); I
2
- indicators, a
decrease in which leads to an increase in the overall
DSC rating (an increase in customer waiting time in
the queue adversely affects the image of the
enterprise and thereby reduces efficiency). To bring
their impact nature on the final assessment to a single
base, the indicators values of the second group should
be converted by the formula:
1
(8)
Then DSC are divided into homogeneous “single
format” groups, for which efficiency indicators and
use of production capabilities are analysed. DSCs are
compared with each other, the best use of production
capabilities is determined, and leading enterprises and
outsider enterprises are identified. DSC is effective if
at the current value of the design parameters it is
impossible to achieve large values of the output
parameters.
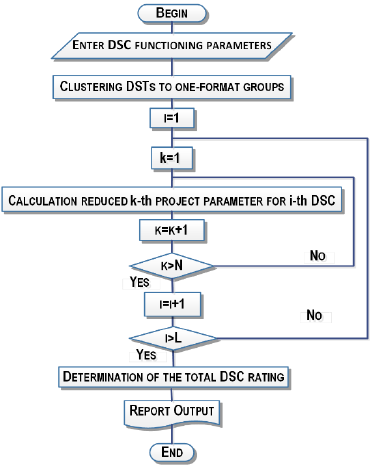
In order for the comparison to be correct, at the
first stage we divide the entire existing data array
about DSC into 3 groups, according to their format,
i.e. quantity of work station. Since DSC even into
one-format groups, have different potential for
development, it is expedient to evaluate their
production capabilities from this point of view. In
order for the comparison to be correct, the indicators
reduced to the number of work station are calculated.
Then ranking is carried out for each of the factors and
the total rank is calculated. The algorithm of DSC
classification by design parameters is shown in Figure
3. Thus, we obtain data on the potential, which can
later be used to build a DSN development strategy.
Figure 3: Algorithm for DSC classification.
3.3 An Example of the Developed
Methodology Implementation
In order to realize the developed methodology for
adjusting the development strategy for DSN, a
software implementation of the developed algorithm
was performed based on their activities analysis.
Ranging example of the DSC of format A is given in
the Figure 4.
Due to the availability of the upload and download
function of periodically generated files with data
coming into the managing center, the statistics of the
DSC activity results is accumulated, which can be
used to analyse data in comparison with the results of
previous periods and etalon values.
This program advantage is that its use minimizes
the subjective factors impact on the qualitative and
quantitative information assessment on the
enterprises activity and facilitates the adoption of
informed decisions based on its analysis without the
expert involvement. The information in the program
module window is divided into tabs in accordance
with the rating categories. Protection is provided
against the input of incorrect information
(information is entered strictly in accordance with the
data types), as well as the mandatory filling out of the
established list of fields is prescribed (with the
turning possibility off the reminder of field
completeness checking).
After entering the information into all the required
Application of the Statistical Analysis Methods for Improving the Managing the Dealer-service Network Efficiency
645
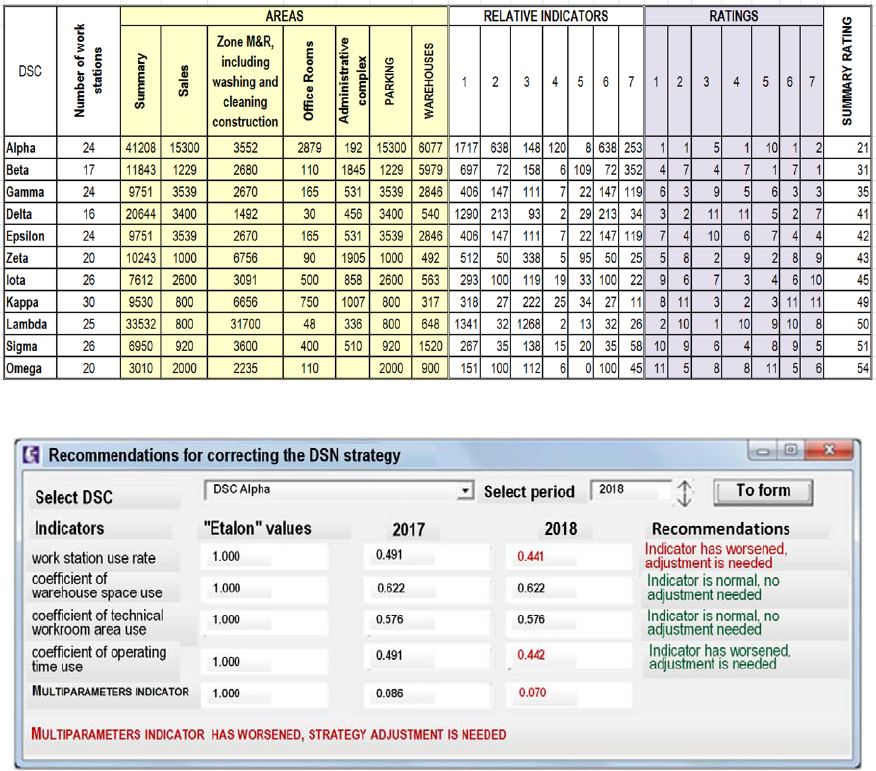
Figure 4: The calculation results of total ratings for DSC format A.
Figure 5: The program’s window for choosing the DSC development strategy based on the analysis results of their activities.
fields, the specialist responsible for collecting
information on all DSC sends the file with the data
that is loaded into a single database in the main
managing center. A DSN specialist of efficiency
evaluation uploads data from all DSCs to a single
database. The program allows calculating the relative
indicators for each DSC, comparing them with the
etalon values. After that, the change in indicators
comparing to previous periods is analyzed, the value
of efficiency is calculated as for each DSC, so for the
DSN in general. Based on this data, the correctness of
the chosen strategy is analyzed (Figure 5).
As a result of the DEA-analysis of the DSN
efficiency, it was established that five out of eleven
DSC are working with sufficient efficiency. DSC was
selected, which works with low efficiency. To
identify its strengths and weaknesses, a SWOT
analysis was conducted, and positive aspects were
identified, including a convenient operating mode and
a small number of competitors in the region. A
comparative analysis of the activities of this DSC for
past periods has shown that the deterioration of the
complex indicator is caused by a decrease in the work
station use rate and the coefficient of operating time
use, which requires identifying the causes of these
indicators deterioration and adjusting the
development strategy.
0.580.620.490.49
0.580.620.440.44
Comparative analysis of the integrated indicators of
the dealer-service network by years suggests that the
LogiTrans 4.0 2019 - Special Session on Logistics and Transport in the Industry 4.0
646
chosen strategy was effective, since there is a positive
trend.
1
∑
1.986
12
0.17
2
∑
2.174
12
0.18
In the DSC, where production capacity is fully
involved, the question of achieving the maximum
optimal managing is raised. For the DSC, which have
not exhausted their production capabilities, the
reasons for low efficiency are identified, the input
parameters are highlighted, the adjustment of which
will allow organizing processes more rationally, a
measures plan is developed for their optimization.
After this, the analyst assesses which improvements
will bring the planned activities to each DSC and the
system as a whole. Developed activities are brought
to the DSC attention for further implementation.
4 CONCLUSIONS
This research’s practical significance lies in the fact
that the developed algorithms use and techniques
contributes to improving the service vehicles quality,
and ensuring the effective implementation of their
resources and improving the service level in the DSC
by improving the quality of science-based
management decisions. A general method of
increasing the competitiveness of the DSC and DSN
as a whole is proposed. This method based by
highlighting the assessment factors and the
parameters affecting them, calculating the “etalon”
and actual values and adjusting the managing action
depending on the actual values degree of deviation
from the “etalon” values. Thus, consideration of the
DSN in the complex will allow identifying leaders
and outsiders among the DSC in format groups,
develop a plan for changes in the DSC operation and
implement a reasonable redistribution of resources
between the DSC within the DSN.
REFERENCES
Baghery Majid et al. Risk measurement and prioritization
of auto parts manufacturing processes based on process
failure analysis, interval data envelopment analysis and
grey relational analysis. J Intell Manuf (2018) 29:1803–
1825
Buyvol, P. at al. Improving the branded service network
efficiency based on its functioning evaluation. Astra
Salvensis. Vol. 2017, 2017, Pages 373-385
Buyvol, P.A. et al. Management of Automobile Plant
Dealer-Service Network Efficiency by Means of
Decision Support System. Third Forum of Young
Researchers: in the Framework of International Forum
Education Quality - 2012 Pages: 202-207 Published:
2012
Hao Hao et al. Forecasting the number of end-of-life
vehicles using a hybrid model based on grey model and
artificial neural network. Journal of Cleaner
Production 202 (2018) 684e696
Hladík Milan. Universal efficiency scores in data
envelopment analysis based on a robust approach.
Expert Systems With Applications 122 (2019) 242–252
ISO 9004:2000. Quality management systems -- Guidelines
for performance improvements. https://www.iso.org/
standard/28692.html
Kumar Nand et al. Evaluation of Efficiency of Automobile
Manufacturing Companies in India Using Data
Envelopment Analysis. International journal of
advanced production and industrial engineering.
IJAPIE-2017-01-111, Vol 2 (1), 01-06
Kusakcı Ali Osman et al. Optimization of reverse logistics
network of End of Life Vehicles under fuzzy supply: A
case study for Istanbul Metropolitan Area. Journal of
Cleaner Production 215 (2019) 1036-1051
Lee C.C., Chang F.T. A Performance Management on
Automobile Dealers with Applying Data Envelopment
Analysis. Proceedings of the 2010 IEEE IEEM. Pp.380-
384
Makarova, I. et al. Dealer-service center competitiveness
increase using modern management methods.
Transport Problems Vol: 7 Iss: 2 pp. 53-59 (2012)
Maritz, Alex, Shieh, Chich-Jen. Performance Analysis of
Automobile Industry in Taiwan with Data Envelopment
Analysis. International Journal of Applied
Mathematics and Statistics, Vol. 38; Issue No. 8; Year
2013, pp.84-95
Moheb-Alizadeh Hadi, Handfield Robert. Sustainable
supplier selection and order allocation: A novel multi-
objective programming model with a hybrid solution
approach. Computers & Industrial Engineering 129
(2019) 192–209
Rachih Hanane et.al. Meta-heuristics for reverse logistics:
A literature review and perspectives. Computers &
Industrial Engineering 127 (2019) 45–62
Rashidi Kamran, Cullinane Kevin. A comparison of fuzzy
DEA and fuzzy TOPSIS in sustainable supplier
selection: Implications for sourcing strategy. Expert
Systems With Applications 121 (2019) 266–281
Tavassoli Mohammad, Saen Reza Farzipoor. Predicting
group membership of sustainable suppliers via data
envelopment analysis and discriminant analysis.
Sustainable Production and Consumption 18 (2019)
41–52
Trojanowska, J. et al. Influence of selected methods of
production flow control on environment. In: Golinska,
P., Fertsch, M., MarxGomez, J. (eds.) Information
Technologies in Environmental Engineering, pp.
s.695–705. Springer, New York (2011). doi: 10.1007/
978-3-64219536-5_54
Application of the Statistical Analysis Methods for Improving the Managing the Dealer-service Network Efficiency
647
Wang Zhiguo et al. Multi-attribute decision making on
reverse logistics based on DEA-TOPSIS: A study of the
Shanghai End-of-life vehicles industry. Journal of
Cleaner Production 214 (2019) 730-737
Zhongdong Xiao et al. Location-allocation problem of
reverse logistics for end-of-life vehicles based on the
measurement of carbon emissions. Computers &
Industrial Engineering 127 (2019) 169–181
LogiTrans 4.0 2019 - Special Session on Logistics and Transport in the Industry 4.0
648
