
Improving Road Safety by Affecting Negative Factors
Irina Makarova
1 a
, Gulnara Yakupova
1 b
, Polina Buyvol
1 c
, Ksenia Shubenkova
1 d
,
Kuanysh Abeshev
2 e
and Maria Drakaki
3
1
Kazan Federal University, Syuyumbike prosp., 10a, 423822 Naberezhnye Chelny, Russian Federation
2
School of Engineering Management, Almaty Management University, Rozybakiyeva st., 227, 050060, Almaty, Kazakhstan
3
Alexander Technological Educational Institute of Thessaloniki, P.O BOX 141, 57400, Thessaloniki, Greece
kuanysh.abeshev@gmail.com, mdrakak@gmail.com
Keywords: Intelligence and Prognostic Analysis, Descriptive Statistics, Road Safety, Traffic Accident.
Abstract: The current increase in automobilization leads to a decrease in road safety. Therefore, the purpose of this
research is to analyze and identify the causes that significantly affect the size and severity of accidents. Most
often, only the time factor is analyzed, which includes the month, day of the week and directly the time of
day when the accident occurred. However, among the influencing factors it is necessary to consider such as
weather and climatic conditions, the parameters of the road and the surrounding infrastructure, the condition
of the driver, the type of incident and the type of violation. The main problem in constructing a model
explaining the dependence of target factors is the sparsity of the initial data and a large number of independent
variables. In this regard, the construction of a unambiguous predictive model is difficult. However, general
patterns and factors potentially influencing the result were identified. For this purpose, both the classical
methods of descriptive statistics and the methods of intelligence and prognostic analysis were used. The
adoption of measures affecting the selected factors will reduce human losses. At the same time, the evaluation
of made decisions effectiveness should be based on feedback.
1 INTRODUCTION
The currently observed increase in motorization leads
to a decrease in road safety (RS). A traffic accident
(TA) is the result of a complex interaction between
drivers, vehicles, roads, road infrastructure and
environmental elements. Not all factors that can
potentially influence its occurrence can be recorded
and measured during the observation process. For this
reason, searching for new methods that make it
possible to analyze and identify the causes
significantly influencing the number and severity of
TA remains relevant.
According to statistics, in the Russian Federation
for 11 months, 2018, there were 151291 accidents (-
1.78% compared to the same period last year), in
which 16412 people died (-5.4%) and 192959 people
were injured (-1.49%)(Road Safety Indicators, 2019).
a
https://orcid.org/0000-0002-6184-9900
b
https://orcid.org/0000-0001-6822-3700
c
https://orcid.org/0000-0002-5241-215X
d
https://orcid.org/0000-0002-9246-6232
e
https://orcid.org/0000-0003-1140-7431
Despite the general improvement in the situation
on the roads of Russian Federation, the state
inspectorate for road safety is currently faced with an
ambitious task - to achieve zero road mortality and
take the leading positions among European countries
on this indicator. To achieve this goal, a road safety
strategy in Russia until 2024 was approved at the
beginning of the year (On approval of the Road Safety
Strategy, 2019). According to its key indicator, the
death rate on the country’s roads by the end of the
program should be reduced to 20 thousand people per
year. In fact, this figure was reached in 2017:
according to the Ministry of Internal Affairs, more
than 168 thousand accidents occurred in Russia, in
which almost 19 thousand people died (this is 6.5%
less than in 2016). However, the strategy proclaims
the desire for zero road mortality by 2030. As a target
for 2024, the social risk index was also set, which is
not more than four killed per 100 thousand people.
Makarova, I., Yakupova, G., Buyvol, P., Shubenkova, K., Abeshev, K. and Drakaki, M.
Improving Road Safety by Affecting Negative Factors.
DOI: 10.5220/0007877106290637
In Proceedings of the 5th International Conference on Vehicle Technology and Intelligent Transport Systems (VEHITS 2019), pages 629-637
ISBN: 978-989-758-374-2
Copyright
c
2019 by SCITEPRESS – Science and Technology Publications, Lda. All rights reserved
629
2 THE SELECTION OF
PATTERNS THAT AFFECT THE
ACCIDENT
Improving RS requires precise methods of analyzing
the road network (RN) to identify the most dangerous
areas that are prioritized for the implementation of
countermeasures in order to maximize the measures’
effectiveness. When analyzing, critical points are
usually identified using statistical (regression) models
and criteria obtained on the basis of accident data for
the period (Park et al., 2013; Hu et al., 2013; Yannis et
al., 2016; Yannis et al., 2017; Srinivasan et al., 2013).
Then, to quantify the risk of TA for each identified
critical point, a Bayesian aposteriori analysis is used
(Stipancic et al., 2018; Jiang et al., 2014; Huang et al.,
2009; Serhiyenko et al., 2016). However, it should be
noted that since collisions’ databases have inherent
errors, omissions of values and distortions of actual
values, a significant drawback of this approach is the
low reliability of the results (Park et al., 2013).
In order to identify patterns and build prognostic
models in this work, classical methods of descriptive
statistics, as well as methods of data mining and
prognostic analysis, were chosen.
3 DESCRIPTIVE ANALYSIS
The data collected by the State Traffic Safety
Inspectorate for the city of Elabuga for 2017 were
used as the initial information.
86 factors were available in the original sample.
However, such a large number of independent
variables is a problem in constructing a model
explaining the dependence of target factors.
Considering also the source data spacing, upon
further analysis, we were forced to reduce the number
of factors to 18. These included the type of TA, traffic
violations, street, the type of road infrastructure
object in place, lighting, number of lanes, weather
conditions, month, day of the week, hour, social
characteristics of the driver, driving experience
(years), gender, degree of intoxication (mg/l), number
of vehicles involved in the accident, type of vehicle,
mark and model of vehicle.
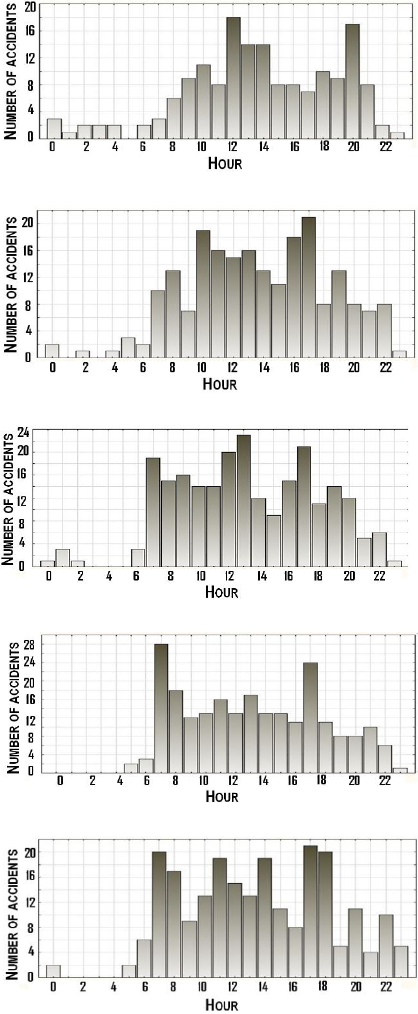
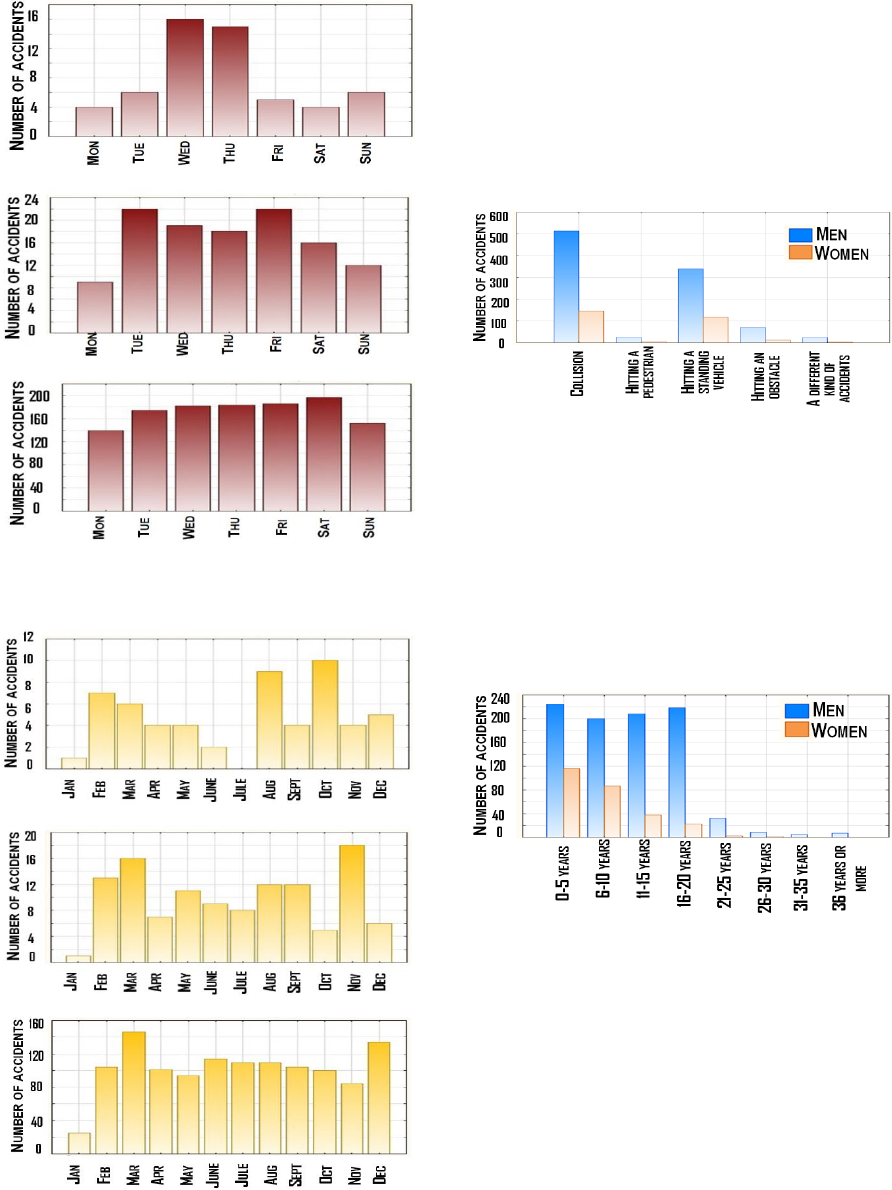
On the constructed histograms of the distribution
of the accidents’ number by the hour and by the
week’s day (Figure 1) it can be seen that on weekdays
(except Monday) and on Saturday, the greatest
number of accidents occur during the morning and
evening peak hours, as well as during the lunch break
(Figure 1B-E). On Monday and Sunday (Figure 1A,
F) the morning surge of accidents is not observed.
А) Monday
B) Tuesday
C) Wednesday
D) Thursday
E) Friday
Figure 1: Histograms of the distribution of the accidents’
number by the hour and the week’s day.
LogiTrans 4.0 2019 - Special Session on Logistics and Transport in the Industry 4.0
630
F) Saturday
G) Sunday
Figure 1: Histograms of the distribution of the accidents’
number by the hour and the week’s day (cont.).
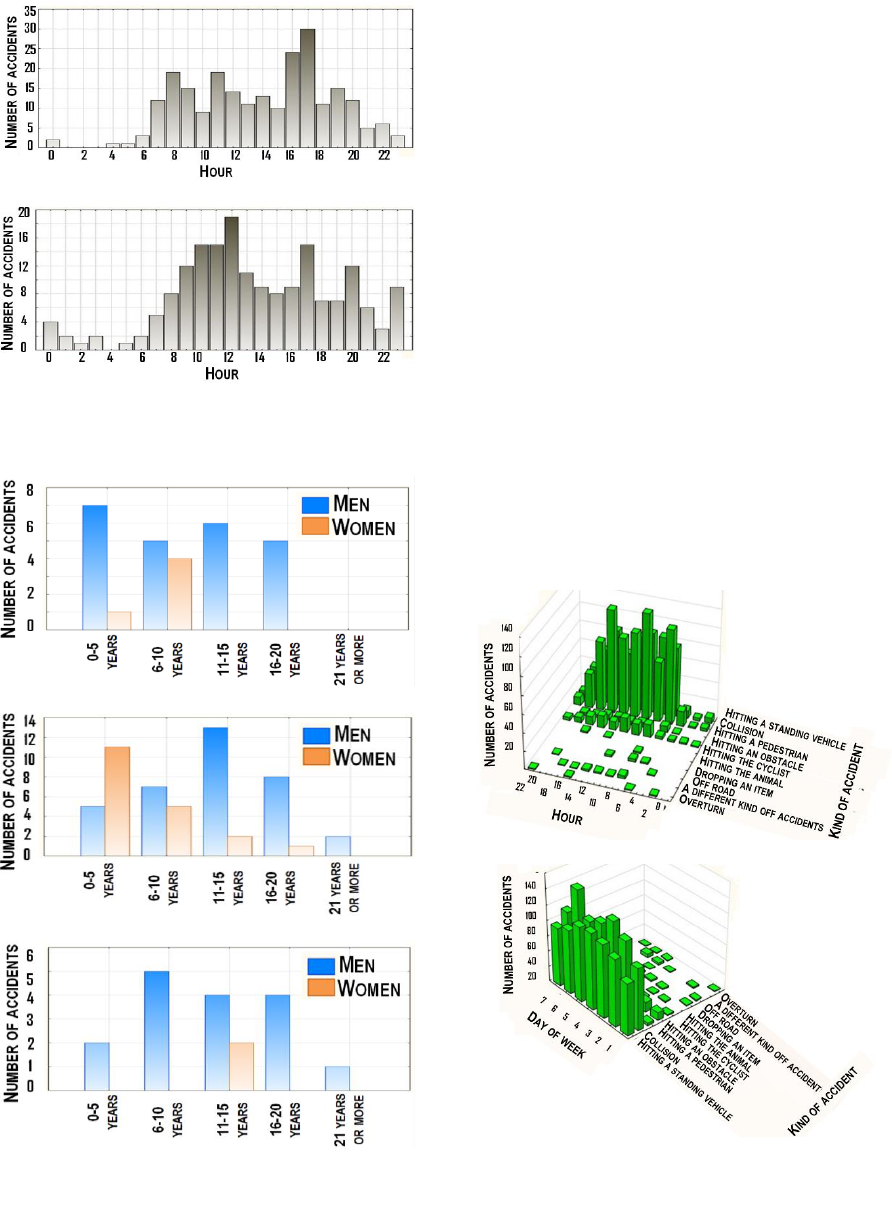
A) Thursday
B) Saturday
C) Sunday
Figure 2: Histograms of the distribution of the accidents’
number committed by male drivers during rush hours.
For further analysis, records of accidents that
occurred in the morning rush hour on Thursday, on
the evening on Saturday and on lunch on Sunday were
selected. According to the histograms of the
distribution of accidents at these intervals (Figure 2),
it is clear that men are the causers of a greater number
of accidents. Namely, in the morning rush hour on
Thursday, the maximum number of accidents is done
by male drivers with average driving experience
(Figure 2A). This circumstance can be explained by
the fact that they are in a hurry to work. Hour-peak
weekends (Figure 2 B, C) are characterized by a large
number of accidents involving male drivers with long
driving experience, perhaps - these are people in age
who go out of town on a Saturday, to a country house,
to nature, and on Sunday come back home.
As for female drivers, on Sunday there were
significantly fewer TA involving them than on
Thursday and Saturday (Figure 2A-C). This may be
due to the fact that on weekends women are busy with
household chores and do not get behind the wheel.
As can be seen from the Figure 3, the most
common types of accidents are collisions, hitting a
standing vehicle, hitting an obstacle, hitting a
pedestrian.
A) by the hours
B) by the week’s days
Figure 3: Histograms of the distribution of the accidents’
number by accident types.
Improving Road Safety by Affecting Negative Factors
631
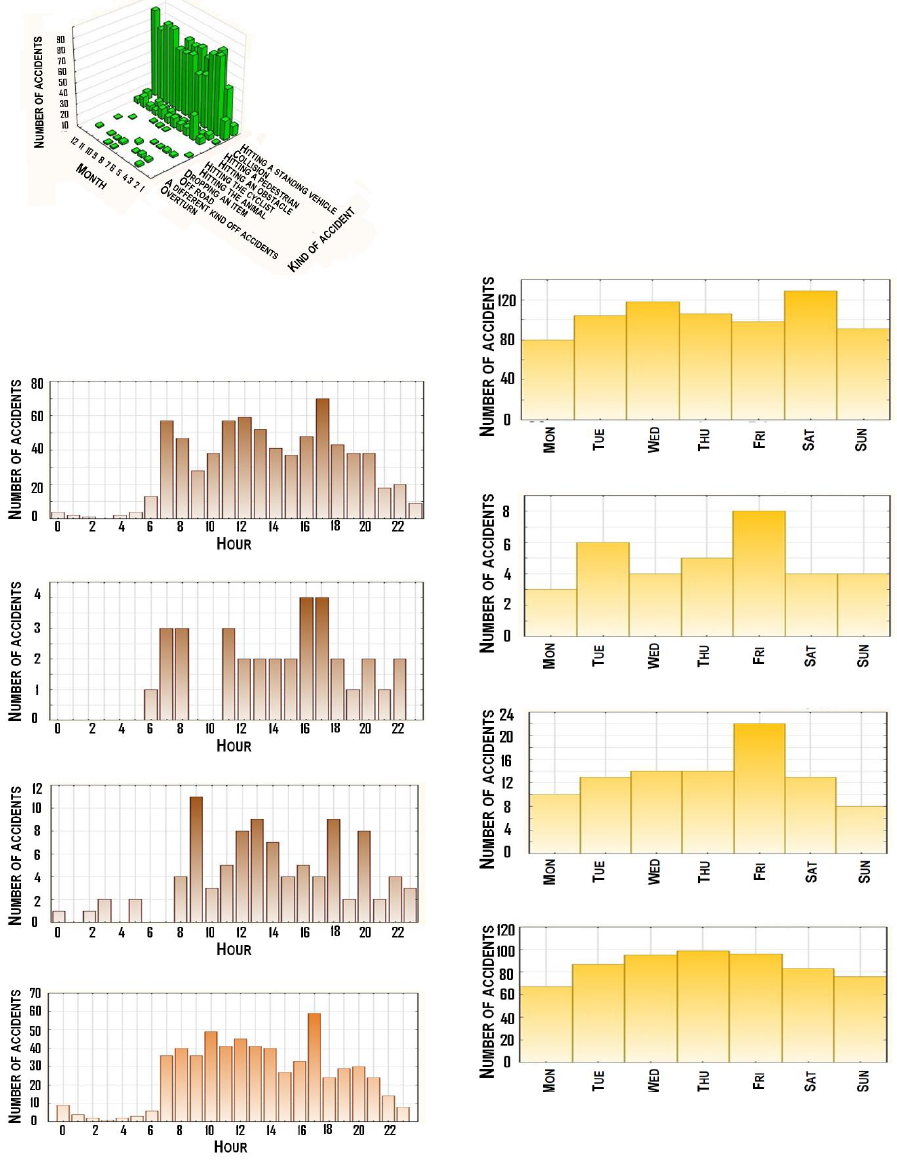
C) by the months
Figure 3: Histograms of the distribution of the accidents’
number by accident types(cont.).
A) collisions
B) hitting a pedestrian
C) hitting an obstacle
D) hitting a standing vehicle
Figure 4: Histograms of the distribution of the accidents’
number by hours and by type of accidents.
Daily analysis of accidents’ types shows that their
distribution is generally similar and also has three
bursts - in the morning, in the afternoon and in the
evening (Figure 4). It should be noted the lack of facts
of hitting a pedestrian at night (Figure 4B).
When analyzing the type of accident on week’s
days, it can be seen that the distribution of the number
of accidents during a collision and hitting a standing
vehicle is constant (Figure 5A, D). For hittings on
pedestrians and obstacles the number of accidents
increase on Friday (Figure 5B, C).
A) collisions
B) hitting a pedestrian
C) hitting an obstacle
D) hitting a standing vehicle
Figure 5: Histograms of the distribution of the accidents’
number by week’s day and by type of accidents.
Analyzing the distribution of the accidents’
number by months (Figure 6), you can see that the
most alarming months are December, February and
LogiTrans 4.0 2019 - Special Session on Logistics and Transport in the Industry 4.0
632
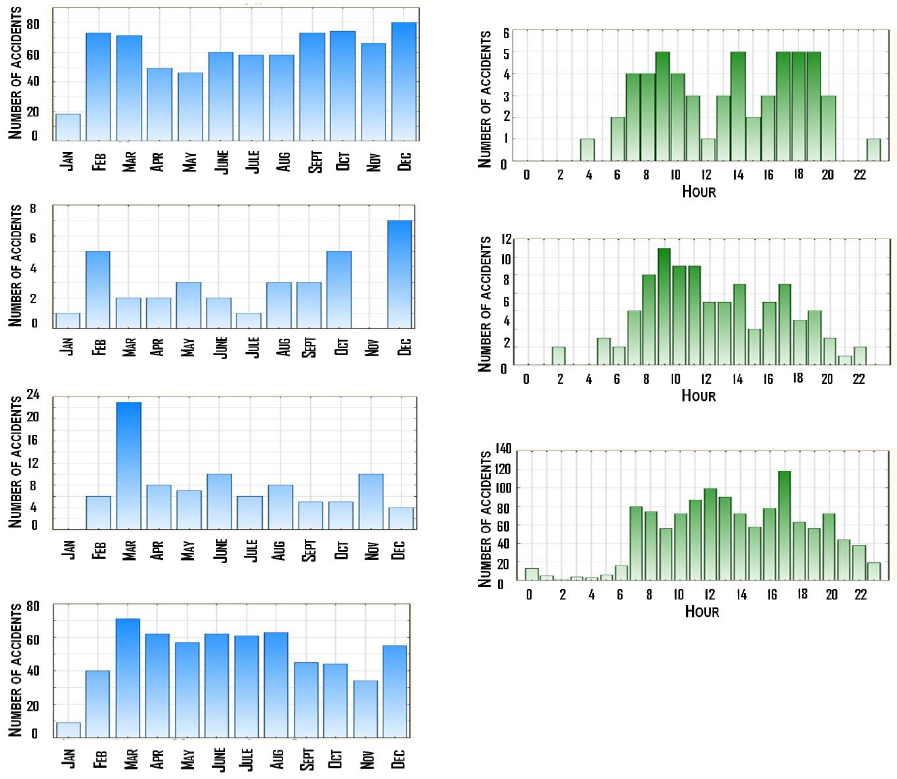
March. For the winter months, the increase in the
accidents’ number is associated with a short light day
and difficult weather and road conditions (blizzards,
drifts, reduction of the roadside’s width). For March,
average daily temperature drops, morning and
evening frosts, and as a result - deterioration of road
conditions (ice on the road) are characteristic. Also,
after the snow melted, a large number of road surface
defects appear, which are not always visible to the
driver, especially at night. In summer, the number of
accidents decreases significantly. This is the main
vacation time, so the number of official and personal
transport is reduced. Road and weather conditions at
this time of year are also quite favorable. In January,
there is the least amount of accidents, which is
obviously due to the long New Year holidays.
A) collisions
B) hitting a pedestrian
C) hitting an obstacle
D) hitting a standing vehicle
Figure 6: Histograms of the distribution of the accidents’
number by months and by type of accidents.
Considering, in particular, the histograms of the
distribution of the accidents’ number by hours and
types of participant (Figure 6A-B), we can see that the
greatest number of accidents are committed by
drivers of passenger vehicles. This pattern can be
associated with a large flow of passenger vehicles on
the roads, as well as gross violations of the driver
himself, such as speeding, violation of the rules of
overtaking, maneuvering, driving under the influence
of alcohol. Among busses, the peak of accidents
occurs in the morning and evening rush hours, for
vehicles- lunchtime is added to them (Figure 7 A, B).
For trucks, the largest number of accidents falls on the
interval between 8 and 11 am (Figure 7 B), which is
obviously related to the morning delivery and
unloading of goods to the distribution networks of
medium-tonnage trucks within the city territory.
A) busses
B) trucks
C) passenger vehicles
Figure 7: Histograms of the accidents number by the hours
and types of participants.
Most often, buses become participants in an
accident on Wednesday and Thursday (Figure 8 A),
trucks - on Tuesday and Friday (Figure 8 B). For
passenger vehicles, the distribution of accidents by
week’s days is fairly uniform (Figure 8C).
Improving Road Safety by Affecting Negative Factors
633
A) busses
B) trucks
C) passenger vehicles
Figure 8: Histograms of the distribution of the accidents’
number by days of the week and by types of participants.
A) busses
B) trucks
C) passenger vehicles
Figure 9: Histograms of the distribution of the accidents’
number by month and by types of participants.
The most dangerous months for buses are
February, March, August, October (Figure 9 A), for
trucks - February, March, November (Figure 9 B), for
passenger vehicles - March, December (Figure 9 C).
An analysis of the accident by gender showed that
the most frequent types of accidents for both men and
women were collisions and hitting a real vehicle
(Figure 10).
Figure 10: Histograms of the distribution of the accidents’
number by gender and by type of accidents.
It should be noted that for women there is a gradual
decrease in the number of accidents with increasing
driving experience, which indicates the positive role
of the accumulated driving practice. The same can’t
be said about male drivers. They are characterized by
the same high number of accidents up to 20 years of
experience (Figure 11), which may indicate a lack of
driving culture and neglect of traffic rules.
Figure 11: Histograms of the distribution of the accidents’
number by gender and by driving experience.
Taking into account this fact and the relatively large
number of male drivers, it can be explained why the
number of accidents by types does not decrease with
increasing driving experience (Figure 12).
It was found that the greatest number of accidents
with the injured fall on clear weather (Figure 13), they
occur on the roadway 60 m wide (Figure 14). In
collisions there are accidents with a large number of
injured (Figure 15).
LogiTrans 4.0 2019 - Special Session on Logistics and Transport in the Industry 4.0
634
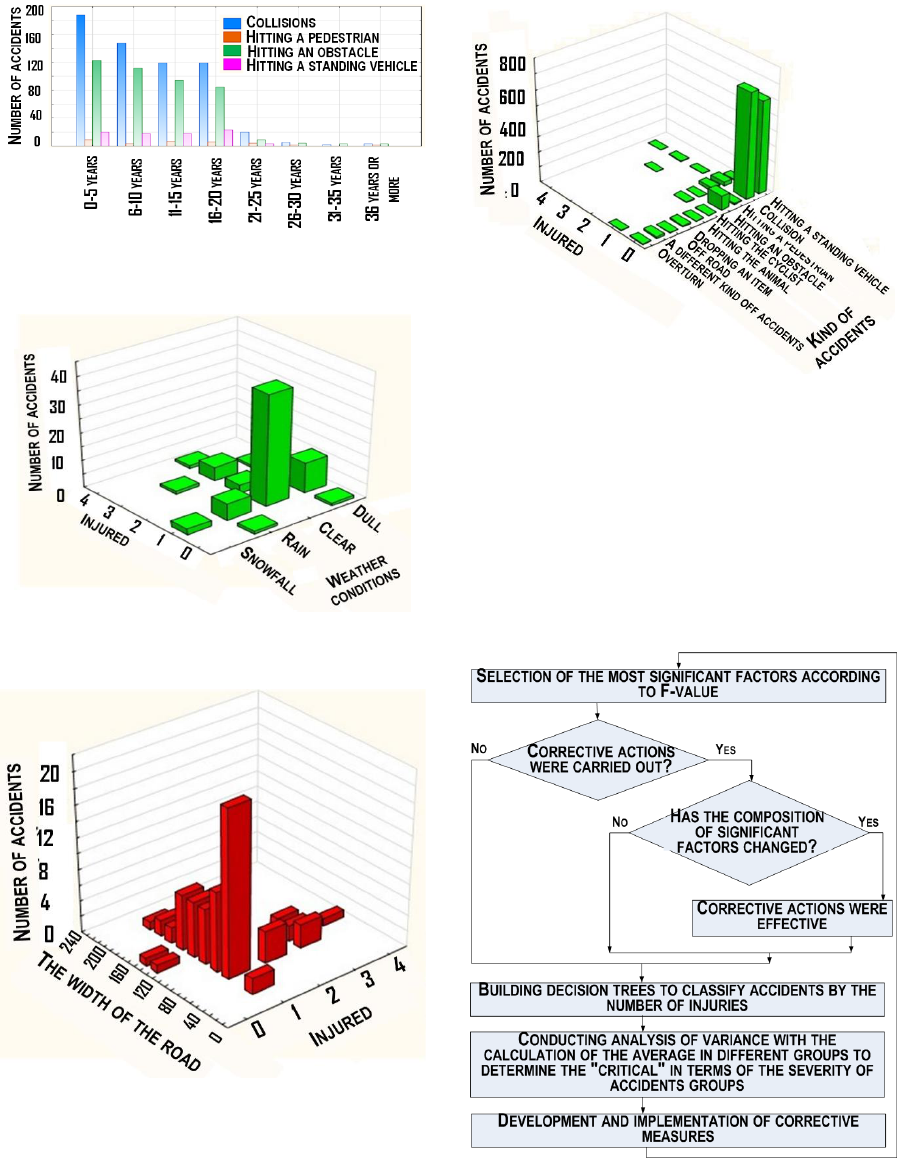
Figure 12: Histograms of the distribution of the accidents’
number by driving experience and by type of accidents.
Figure 13: Histogram of the distribution of the accidents’
number by the number of injured and weather conditions.
Figure 14: Histogram of the distribution of the accidents’
number by the number of injured and the roadway’s width.
Figure 15: Histogram of the distribution of the accidents’
number by the number of injured and by type of accidents.
4 BUILDING A PROGNOSTIC
MODEL
At the following stage the analysis of severity of road
accident according to the algorithm presented in
Figure 16 was carried out.
Figure 16: Algorithm for building a prognostic model.
Improving Road Safety by Affecting Negative Factors
635
When building a prognostic model for the
predicted variable – Number of injured– in the first
step, the most significant factors were identified.
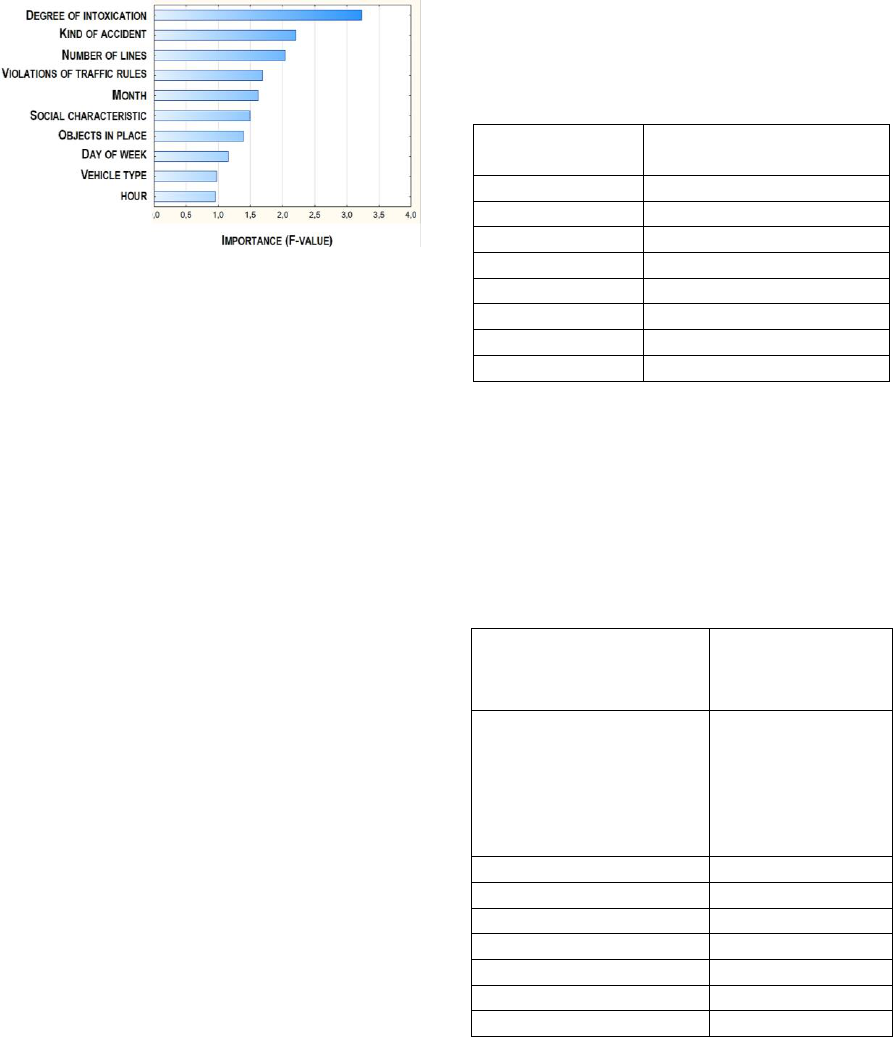
The graph shows that the most important factor
for describing the number of injured is the degree of
intoxication. Day of the week and Time of day, Type
of vehicle (bus, truck or vehicle) are the least
affecting the result variables (Figure 17).
Figure 17: Predictor Importance Graph.
The next step was to find the optimal model,
which allows to classify accidents by the number of
injured. To solve the problem, so-called growing trees
were used, as part of the algorithm, a whole system of
trees is being built, more and more reducing the
classification error. We describe the results of the
construction of some of these trees.
The type of accident occupies a consistently high
place in the list of important predictors, and the
number of injured is 1 for hitting a pedestrian, and
two or more for a collision.
According to the types of traffic violations, the
division is as follows: for accidents resulting from
violations of rules of the vehicle’s location on the
carriageway and non-observance of the travel order,
the number of injured is 2, in accidents with violation
of the pedestrian crossing driving rules, non-
observance of conditions allowing traffic to go in
reverse, violation of requirements of traffic light
signal, wrong choice of distance, departure to the
oncoming traffic, violation of the rebuilding rules -
equal to 1.
For March, April, October, the number of injured
is 2, for the remaining months - 1.
Among the objects of the RN, attention must be
paid to unregulated intersections of unequal streets
(roads), where the number of injured is 2. On the
stretches, departures from the adjacent territory,
regulated pedestrian crossings, the average number of
injured is 1.25, on regulated crossings , unregulated
pedestrian crossings, public transport stops,
unregulated intersection with a roundabout, inner
yard territory - 1.
Also, to study the factors affecting the accident
rate, the method of single-factor dispersive analysis
was used. Variables from the number of attributes
selected during screening were taken as predictors.
Result variable - Number of injured. Among the
factors that have the greatest impact on the resulting
variable, according to Fisher's criterion at a
significance level of p = 0.05, such factors as the Type
of traffic accident, the degree of intoxication (µg / l),
the type of traffic violations, Month, Hour, Number
of lanes were highlighted.
Table 1: The distribution of the average number of injured
by time of day.
Times of Day
The average number of injured
in the accident with injuries
0, 8, 9, 10, 15, 16, 18
1,000000
7, 13
1,142857
14
1,166667
12
1,250000
17, 20
1,333333
11, 22
1,500000
6
1,666667
1, 5, 21
3,000000
The algorithm gives the Social category, the type
of vehicle involved in the accident, as the least
affecting the result variables.
Also, the most critical in terms of the number of
injured hours (Table 1), as well as the concentration
of accidents with the largest number of injured were
identified (Table 2).
Table 2: The distribution of the average number of injured
by location.
Street
The average number of
injured in the accident
with injuries
Molodezhnaya st., Okruzhnoye
sh., Neftyanikov per., Chapaeva
st., Sh-2 st., Mardzhani ul,
Kazanskaya st., Proletarskaya
st., Zemlyanukhina st., Gabdully
Tukaya st., Bolgar st., Malaya
Pokrovskaya st.
1,000000
Oilmen pr-kt
1,133333
Mira pr-kt
1,125000
Moscow st.
1,250000
Builders st.
1,375000
Naberezhno-Chelninskoe sh.
2,000000
Tugarova st.
2,333333
Gassar st.
3,000000
LogiTrans 4.0 2019 - Special Session on Logistics and Transport in the Industry 4.0
636

5 CONCLUSIONS
As a result of the analysis, the following
recommendations were formulated for reducing the
number of TA on the roads of Yelabuga:
1. Organization of events to reduce traffic load
and curb traffic violations at the entrances to the city
on Saturday from 17.00 to 18.00 and Sunday from
12.00 to 13.00 by summer drivers and tourist drivers
2. Development and implementation of
propaganda and educational activities to improve the
driving culture of men with driving experience up to
20 years.
3. Development and implementation of activities
for training and consolidating driving skills among
women with driving experience up to 5 years.
4. Organization of events to reduce the number of
drivers who are driving in a state of alcohol and drug
intoxication.
According to the prognostic model built on the
basis of growing trees, an accident class with the
number of injured 2 or more people has been
allocated. The following decision rules were obtained
for him: Type of accident - collisions resulting from
violations of the rules of the vehicle’s location on the
carriageway and non-observance of the travel order;
place of the accident - unregulated intersections of
unequal streets (roads); Month - March, April,
October; The time of the accident - 1.00, 5.00, 21.00.
It is necessary to analyze the impact of the
measures taken for the reconstruction of road
infrastructure, preventive or regulatory measures, and
the modernization of vehicle design on road safety.
At the same time, the evaluation of the effectiveness
of decisions should be made on the basis of feedback.
For this, it is necessary to select among the whole set
of factors those that most strongly influence the
severity of accidents, and then re-calculate
quantitative criteria for assessing the severity of
accidents in the next period. In this case, the adoption
and evaluation of the effectiveness of measures
affecting the selected factors will reduce human
losses.
ACKNOWLEDGEMENTS
Research is partially funded by national grant No.
BR05236644.
REFERENCES
Hu, S., Ivan, J. N., Raishanker, N., Mooradian, J., 2013.
Temporal modeling of highway crash counts for senior
and non-senior drivers. Accid. Anal. Prev. 50, 1003–
1013.
Huang, H., Chin, H. C., Haque, M., 2009. Empirical
evaluation of alternative approaches in identifying
crash hot spots: naive ranking, empirical bayes, and full
bayes methods. Transp. Res. Rec. 2103, 32–41.
Jiang, X., Abdel-Aty, M., Alamili, S., 2014. Application of
Poisson random effect models for highway network
screening. Accid. Anal. Prev. 63, 74–82.
On approval of the Road Safety Strategy, 2019. Retrieved
January 22, 2019, from hxxp://government.ru/docs/
31102/.
Park, P. Y., Sahaji, R., 2013. Safety network screening for
municipalities with incomplete traffic volume data.
Accid. Anal. Prev. 50, 1062–1072.
Road Safety Indicators, 2019. Official website of road
police. Retrieved January 22, 2019, from hxxp://stat.
gibdd.ru.
Serhiyenko, V., Mamun, S. A., Ivan, J. N., Ravishanker, N.,
2016. Fast Bayesian inference for modeling multivariate
crash counts. Anal. Methods Accid. Res. 9, 44–53.
Srinivasan, R., Bauer, K., 2013. Safety Performance
Function Development Guide: Developing Jurisdiction-
Specific SPFs, Final Report. Report No. FSWA-SA-14-
005. Federal Highway Administration September.
Stipancic J., Miranda-Moreno L., SaunierТ.,Labbe А.,
2018. Surrogate safety and network screening:
Modelling crash frequency using GPS travel data and
latent Gaussian Spatial Models. Accid. Anal. Prev. 120,
174–187.
Yannis, G., Dragomanovits, A., Laiou, A., Richter, T.,
Ruhl, S., La Torre, F., Domenichini, L., Graham, D.,
Karathodorou, N., Li, H., 2016. Use of Prediction
model in road safety management – an international
inquiry. Transportation Research Proc. 14, 4257–4266.
Yannis, G., Dragomanovits, A., Laiou, A., La Torre, F.,
Domenichini, L., Richter, T., Ruhl, S., Graham, D.,
Karathodorou, N., 2017. Road traffic accident prediction
modelling: a literature review. In: Proceedings of the
Institution of Civil Engineers – Transport, 170 (5), 245–
254.
Improving Road Safety by Affecting Negative Factors
637
