
Numerical Modelling of the Pollution Distribution from the
Underwater Discharge of the Wastewater Treatment Plant near the
Heraclean Peninsula of the Crimea under Different Wind Directions
Evgeniya Korshenko
1a
, Nikolay Diansky
1,2,3 b
, Vladimir Fomin
1c
and Irina Panasenkova
1d
1
Department of Numerical Modelling of Hydrophysical Processes, Zubov State Oceanographic Institute, Moscow, Russia
2
Faculty of Physics, M.V. Lomonosov Moscow State University, Moscow, Russia
3
Institute of Numerical Mathematics of the Russian Academy of Sciences, Moscow, Russia
Keywords: Black Sea, Numerical Modelling, Pollution Distribution, Upwelling.
Abstract: The present paper is focused on the numerical modelling of the pollution distribution in the coastal waters of
the Crimean Peninsula from the underwater discharge of the biggest wastewater treatment plant in this area.
Calculations are performed using three-dimensional σ-model of marine circulation INMOM (Institute of
Numerical Mathematics Ocean Model) with high spatial resolution near the Crimean Peninsula for a one-year
period, using WRF (Weather Research and Forecasting model) atmospheric forcing. Simulations are carried
out according to the two experimental scenarios that differ in the presence of the leakage place in the pipeline
and its absence. Simulation results are used to study temporal and spatial structure of the pollution distribution,
taking into account hydrometeorological conditions and their seasonal and synoptic variation.
1 INTRODUCTION
In the case of the Crimean Peninsula, one of the
largest sources of marine coastal waters’ pollution is
connected to the discharge from numerous
wastewater treatment plants (WWTPs). The majority
of these plants was constructed in the 1970’s. Due to
physical and technological wear, they now only
produce mechanical treatment or generally untreated
sewage. The current condition of these plants can
significantly reduce water quality. Numerical
modelling of pollution distribution from the discharge
of the WWTPs makes it possible to estimate the
dynamics of this distribution and its impact on coastal
waters.
This paper presents simulation results of the
pollution distribution from the underwater discharge
of the largest WWTP on the Crimean Peninsula,
which are obtained with INMOM (Institute of
Numerical Mathematics Ocean Model) three-
dimensional σ-model of marine circulation.
a
https://orcid.org/0000-0003-2310-9730
b
https://orcid.org/0000-0002-6785-1956
c
https://orcid.org/0000-0001-8857-1518
d
https://orcid.org/0000-0002-8338-4825
2 MODEL AND DATA
Three-dimensional σ-model of marine circulation
INMOM has been developed at the INM RAS
(Institute of Numerical Mathematics of the Russian
Academy of Sciences) (Diansky, 2013) and based on
the primitive equations of ocean
hydrothermodynamics with the Boussinesq and
hydrostatic approximations. A regional version of
INMOM for the Black Sea (BS) with nonuniform grid
near the Crimean Peninsula was developed for this
study. To achieve higher horizontal spatial resolution
over a specific region of interest, a spherical
coordinate system with the location of one of the
poles at a point with geographic coordinates 33.96⁰E
and 44.74⁰N was used. As a result, horizontal spatial
resolution varies from 200 m near the new pole to 6-
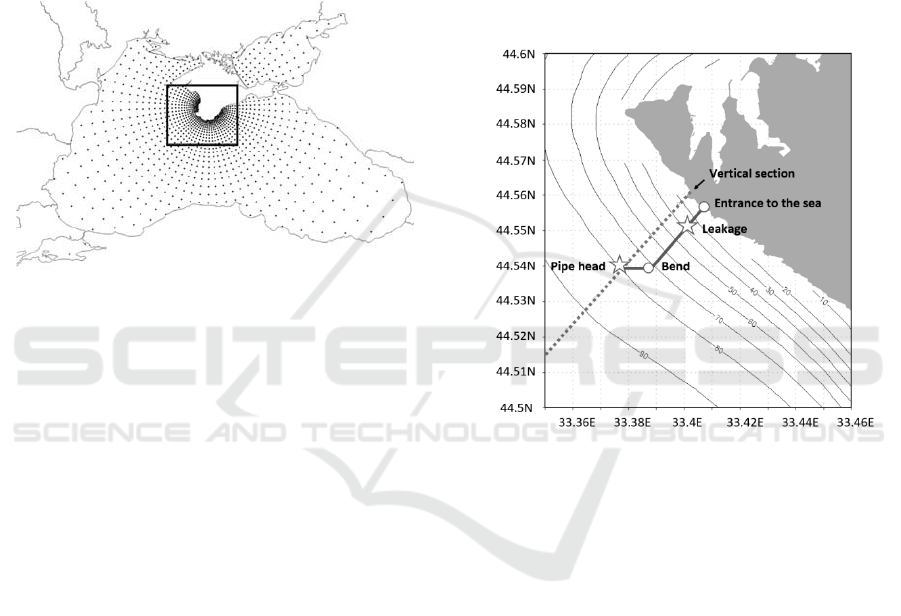
8 km on the periphery of the BS (Figure 1). The grid
domain in the horizontal plane contained 889×488
points along the model longitude and latitude,
respectively. The vertical coordinate was represented
by twenty nonuniformly distributed σ-levels to provi-
Korshenko, E., Diansky, N., Fomin, V. and Panasenkova, I.
Numerical Modelling of the Pollution Distribution from the Underwater Discharge of the Wastewater Treatment Plant near the Heraclean Peninsula of the Crimea under Different Wind
Directions.
DOI: 10.5220/0007835803730377
In Proceedings of the 5th International Conference on Geographical Information Systems Theory, Applications and Management (GISTAM 2019), pages 373-377
ISBN: 978-989-758-371-1
Copyright
c
2019 by SCITEPRESS – Science and Technology Publications, Lda. All rights reserved
373
de higher resolution near the surface.
Model depths were specified by using the
GEBCO data on the Earth's topography with a high
spatial resolution of 30’’ available to download from
www.gebco.net. However, the initial high-resolution
data were smoothed several times and limited by a
minimum depth of 4 m. This is a necessary procedure
for σ-models because the transformation of the
vertical coordinate is used and the function describing
undisturbed sea depth should be nonzero and
sufficiently smooth (Diansky, 2013).
Figure 1: Grid domain of the σ-model of marine circulation
INMOM with nonuniform grid near the Crimean Peninsula.
The initial conditions of temperature and salinity
were constructed using three-dimensional monthly
mean climatic fields of the Azov and the BS. The data
from the Atlas were taken as climatic fields of
temperature and salinity of the Azov Sea. In the case
of the BS, the data were provided by the Marine
Hydrophysical Institute of the Russian Academy of
Sciences (INM RAS) with a horizontal resolution of
0.1°x0.0625° and with 36 vertical levels, from 0 to
2150 m (Ivanov et al., 2011). All described data were
interpolated to the model grid domain.
The calculation of atmospheric forcing for a
numerical modelling period of 2011 year was
performed using the bulk formulas (Gill, 1986) based
on characteristics that were obtained by non-
hydrostatic atmosphere model WRF (Weather
Research and Forecasting model) with a spatial
resolution of 10 km and with a time resolution of 1
hour.
The discharge of the most significant rivers
flowing into the BS was specified according to the
climatological runoff data (Jaoshvili, 2002).
3 RESULTS AND DISCUSSION
The regional version of INMOM with high spatial re-
solution near the Crimean Peninsula described above
was used to calculate the distribution of pollution
from the underwater discharge of the WWTP KOS-1
“Yuzhnye” near the Heraclean Peninsula according to
two experimental scenarios. In the first scenario (I),
the entire sewage discharge occurred through the pipe
head at a depth of 80 m. The length of the pipeline
itself was considered to be 3.300 m. In the second
scenario (II), we assumed the presence of a leakage in
the pipeline at a distance of 500 m from the entrance
of the pipeline into the sea and at a depth of 33-35 m,
through which half of all sewage was discharged
(Figure 2).
Figure 2: The location of the pipeline is indicated by a solid
line. The location of the pipe head and leakage are marked
with stars. The entrance of the pipeline into the sea and the
location of its bend are indicated by circles. The vertical
cross-section to the coast is marked by a dotted line.
The pollution distribution in the case of both
experiments was calculated for a period of one year –
2011 – and the annual discharge volume of sewage of
38.300 thousand cubic meters was taken into account.
To perform the calculations, the volume
concentration of the conditional pollutant in the
sewage was assumed to be completely polluted and
equal to 1. It was taken into account that sewage
affected the distribution of salinity. Therefore, at each
model time step, the flow of pollutants into the
nearest model cells was calculated according to the
volumetric flows of pipes received for this model
step, multiplied by the corresponding concentration,
and instantaneous dilution of pollutants in the
volumes of the corresponding cells. A similar method
of calculating the pollution distribution was
previously used for the coastal waters of Big Sochi
and described in Diansky et al., 2013.
ONM-CozD 2019 - Special Session on Observations and Numerical Modeling of the Coastal Ocean Zone Dynamics
374
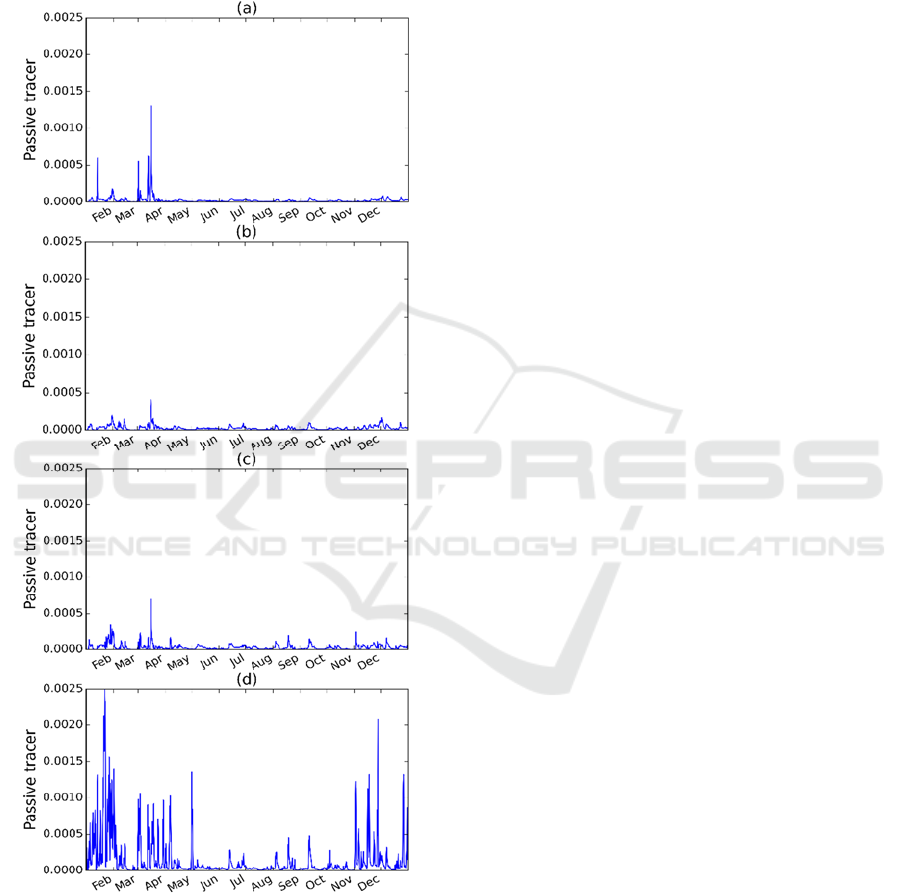
Graphs representing change in the volume
concentration of conditional pollutant on the sea
surface were drawn at points corresponding to the
pipe head location and the location of the leakage
place for both experiments and the entire 2011-year
calculation period.
Figure 3: Volume concentration of the conditional pollutant
on the sea surface for 2011 year at the points corresponding
to the location of the pipe head (a, c) and leakage place (b,
d) for two experiments: in the case of the entire sewage
discharge through the pipe head (I) (a, b) and the sewage
discharge through the pipe head and through the leakage
place in equal proportions (II) (c, d). The concentration
scale of conditional pollutant is presented in dimensionless
units and marked along the y axis.
Based on the results presented in Figure 3 (a-d),
the most adverse period of the pollution spread from
deeper layers to the surface occurred during the cold
autumn-winter and subsequent spring seasons, when
the BS vertical water exchange increased and when
vertical stratification was weakened due to
convective cooling and turbulent mixing (the last one
also occurred due to the increased intensity of winds
during these seasons). Due to the upper layers
warming, as well as the wind speed decrease after the
beginning of the summer season, a density jump layer
was formed, which usually prevented the release of
pollution from deeper layers to the sea surface.
However, in the case of the upwelling, which is
found to be a rather common phenomenon in the
coastal area of the Crimean Peninsula in the summer
season, the polluted water from deeper layers can
reach the surface. For the entire period of performed
calculations, several similar situations were
identified. We conducted an analysis of one of them,
dated 18.08.2011, and present it below (Figure 4).
Figure 4 (a, b) shows the pollution concentration
on the sea surface on 18.08.2011 under two scenarios
(I, II). These maps were reconstructed in a geographic
coordinate system by interpolating numerical
modelling results on the uniform 1 km grid area. The
scale of volume concentrations is presented in
dimensionless units, as in Figure 3. The results of
numerical modelling confirmed that, depending on
the experimental conditions, the most significant
differences in the pollution concentration were
observed at the sea surface. According to the graphs
(Figure 3), the highest concentration of the pollution
was noted in the experiment with the sewage
discharge through the pipe head and through the
leakage place in equal proportions. This was quite
predictable because of the closer location of the
leakage to the surface (~33-35 m) than the pipe head
itself (~80 m).
Figure 4 (c, d) shows pollution concentration
maps on the vertical cross-section to the shore (shown
in Figure 2) on 18.08.2011, also for both scenarios (I,
II). The map data was based on the calculation results,
transformed into a geographic coordinate system by
interpolating model data on the uniform 1-km grid
area, followed by interpolation on 36 vertical levels
from 0 to 2150 m and on the vertical cross-section
itself. Therefore, vertical coordinates are measured in
meters. The scale of volume concentrations, as in the
case of the pollution concentration on the surface, is
presented in dimensionless units.
Numerical Modelling of the Pollution Distribution from the Underwater Discharge of the Wastewater Treatment Plant near the Heraclean
Peninsula of the Crimea under Different Wind Directions
375
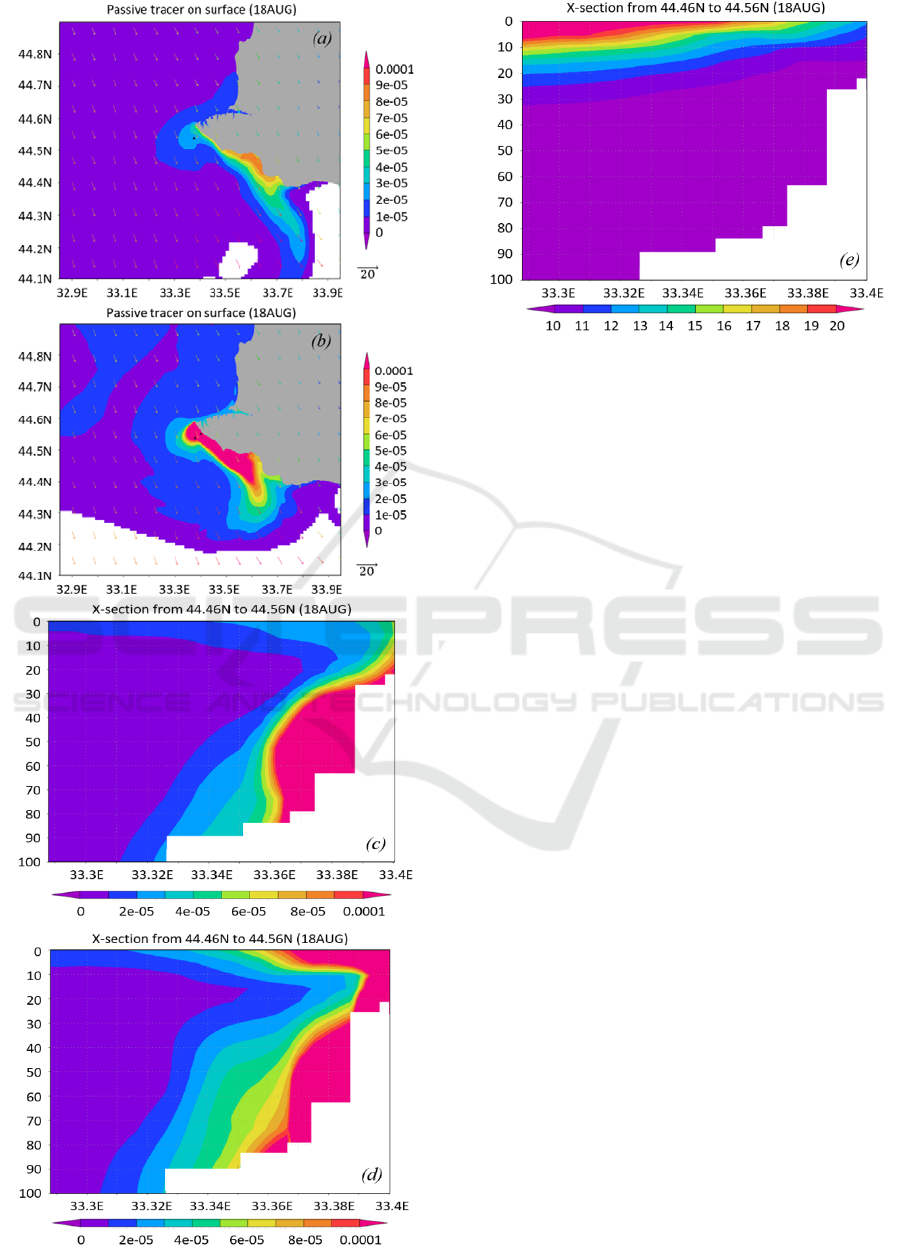
Figure 4: Volume concentration of the conditional pollutant
on the sea surface on 18.08.2011 in the case of the entire
sewage discharge through the pipe head (I, a) and the
sewage discharge through the pipe head and through the
leakage place in equal proportions (II, b). The concentration
scale of conditional pollutant is presented in dimensionless
units and shown on the right. The vectors of wind velocity
near the sea surface with the scale of arrows in cm/s are also
indicated on the right of the figures and are additionally
marked on the maps. The volume concentration on the
vertical section, the position of which is shown in Figure 2
on 18.08.2011 in the case of two different scenarios: (I, c);
(II, d). The concentration scales in dimensionless units are
shown below. (II, e) - temperature distribution on the
vertical cross-section to the shore on 18.08.2011. The scale
in °C is shown below. Vertical coordinates are measured in
meters.
Using the presented pictures and considering the
temperature distribution on the vertical cross-section
in Figure 4 (e), it can be concluded that on 18.08.2011
there was an upwelling caused by the north-east wind
when the coast was to the left of the wind direction.
According to existing studies, this situation is found
to be quite common in the coastal area of the BS
(Silvestrova et al., 2017). At the same time, the
integral Ekman transfer in the upper quasi-
homogeneous layer was directed from the coast,
which lead to a compensatory rise of the underlying,
colder waters, which sometimes come to the sea
surface (Silvestrova et al., 2017).
Figure 5 shows wind velocity and its direction in
August 2011 at the closest point to the pipe head and
the leakage place location, according to the WRF data
on the wind speed at 10 m height. The time scale
along the x axis is represented by the number of the
day in a year. Respectively, the date of 18.08.2011 is
equivalent to 230 days. According to the analyzed
graph, several days before the date of interest, the
wind strengthened and the north-west wind along the
coastline prevailed.
ONM-CozD 2019 - Special Session on Observations and Numerical Modeling of the Coastal Ocean Zone Dynamics
376
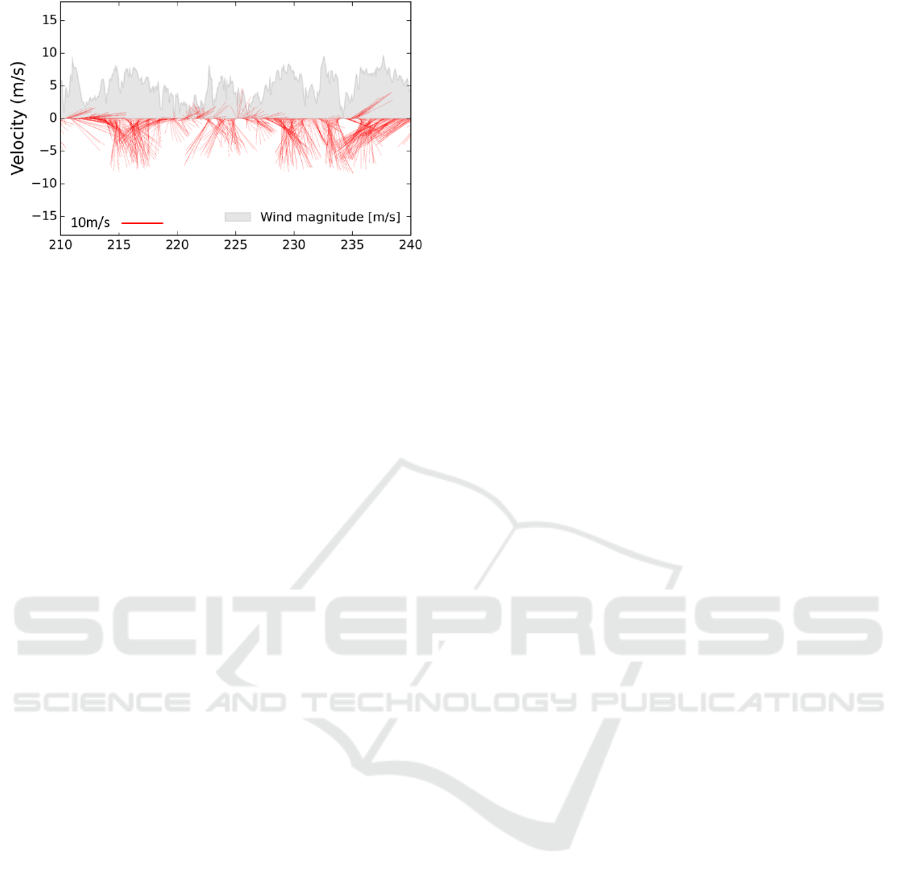
Figure 5: The wind velocity (m/s) and direction for August
2011 at the point closest to the pipe head and to the leakage
place according to the WRF data. The velocity of the wind
is represented by a shaded gray graph; wind direction
corresponds to red vectors, measured from the north
azimuth. The scale of the vectors in m/s is placed at the
bottom of the picture. The timeline is represented by the
numbers of days in a year.
It additionally confirmed the presence of the
upwelling phenomenon and it can be concluded that
because of the integral Ekman transfer arising due to
the intensification of northwestern and western
winds, polluted water raised from the deeper layers
and reached the sea surface at the sites of sewage
discharges, especially in the case of the leakage,
which can seriously affect the state of the marine
environment of the considered coastal area.
4 CONCLUSIONS
As part of the presented study, we developed a
regional version of the INMOM for the BS with the
nonuniform grid, horizontal spatial resolution of
which is increasing from 200 m near the Crimean
Peninsula to 6-8 km on the periphery of the BS. It
allowed us to calculate the pollution distribution from
the underwater discharge of the WWTP with the high
spatial resolution and gave us an opportunity to study
the temporal and spatial structure of the pollution
distribution, taking into account hydrometeorological
conditions and their seasonal and synoptic variability.
It was shown that the most adverse period of the
pollution transport from deeper layers to the sea
surface was occurring during the cold autumn-winter
and subsequent spring seasons, because of the
increasing vertical water exchange and weakening of
vertical stratification. However, even after the
beginning of the summer season, when a density jump
layer is usually formed in the BS, due to the
upwelling, the polluted water from deeper layers can
reach the surface.
The analysis of the numerical modelling results
from the experiments with two different scenarios
showed that in the presence of a leakage place in the
pipeline the release of pollution to the sea surface
occurred more intensively than in the case of its
absence. Therefore, the state of the pipeline also
requires further research to take all necessary
measures to reduce the anthropogenic load on the
ecological state of the coastal area. It is also noted that
the pollution distribution beyond the sea surface
horizon should be researched further.
ACKNOWLEDGEMENTS
The presented study was funded by Russian
Foundation for Basic Research according to the
research projects № 18-35-00512, № 17-05-41101.
REFERENCES
Diansky, N.A., 2013. Modelling of the ocean circulation
and study of its response to short-term and long-term
atmospheric forcing. 1
st
ed. Physmatlit, Moscow. (in
Russian)
Diansky, N.A., Fomin, V.V, Zhokhova, N.V., Korshenko,
A.N., 2013. Simulations of Currents and Pollution
Transport in the Coastal Waters of Big Sochi.
Atmospheric and Oceanic Physics, 49(6): 611–621.
Gill, A., 1986. Atmosphere and ocean dynamics. Vol. 1.
Moscow, Mir, 396 p. (in Russian).
Ivanov, V.A., Belokopytov, V.N, 2011. Oceanography of
the Black Sea. NAS of Ukraine, Marine Hydrophysical
Institute, Sevastopol. (In Russian)
Jaoshvili, S, 2002. The rivers of the Black Sea. European
Environmental Agency, eds. I. Chomeriki, G.
Gigineishvili, and A. Kordzadze, Technical Report No.
71.
Silvestrova, K.P., Zatsepin, A.G., Myslenkov, S.A., 2017.
Coastal upwelling in the Gelendzhik area of the Black
Sea: Effect of wind and dynamics. Oceanology, 57(4):
469-477.
Numerical Modelling of the Pollution Distribution from the Underwater Discharge of the Wastewater Treatment Plant near the Heraclean
Peninsula of the Crimea under Different Wind Directions
377
