
Test Input Partitioning for Automated Testing
of Satellite On-board Image Processing Algorithms
Ulrike Witteck
1
, Denis Grießbach
1
and Paula Herber
2
1
Institute of Optical Sensor Systems, German Aerospace Center (DLR), Berlin-Adlershof, Germany
2
Embedded Systems Group, University of M
¨
unster, Germany
Keywords:
Image Processing, Software Testing, Input Partitioning, Satellite Systems.
Abstract:
On-board image processing technologies in the satellite domain are subject to extremely strict requirements
with respect to reliability and accuracy in hard real-time. Due to their large input domain, it is infeasible to
execute all possible test cases. To overcome this problem, we define a novel test approach that efficiently and
systematically captures the input domain of satellite on-board image processing applications. To achieve this,
we first present a dedicated partitioning into equivalence classes for each input parameter. Then, we define
multidimensional coverage criteria to assess a given test suite for its coverage on the complete input domain.
Finally, we present a test generation algorithm that automatically inserts missing test cases into a given test
suite based on our multidimensional coverage criteria. This results in a reasonably small test suite that covers
the whole input domain of satellite on-board image processing applications. We demonstrate the effectiveness
of our approach with experimental results from the ESA medium-class mission PLATO.
1 INTRODUCTION
Various on-board image processing applications are
subject to strict requirements with respect to reliabil-
ity and accuracy in hard real-time. Due to the large
input domain of such applications, testing the systems
manually is error-prone and time-consuming. Hence,
a test approach is needed that automatically and sys-
tematically generates test cases for testing such appli-
cations. However, the automated test generation for
on-board image processing applications poses a ma-
jor challenge: The large amount of input parameters
and their possible combinations leads to a high num-
ber of test cases. Hence, the systematic and efficient
coverage of the whole input domain is expensive.
In existing work (Bringmann and Kr
¨
amer, 2006;
Huang and Peleska, 2016), automated test approaches
for various domains, for example, for automotive
and railway applications, are presented. The authors
investigate huge input domains and complex func-
tional behavior. However, their focus is on event-
driven reactive real-time systems, and none of these
approaches is tailored to the domain of satellite on-
board image processing applications, where the com-
plexity is in the huge amount of possible input images.
In this paper, we present a novel test approach for
the domain of satellite on-board image processing ap-
plications. It is based on the (unpublished) master the-
sis of the first author (Witteck, 2018). The objective
of our approach is to achieve a high coverage of the
input domain while at the same time using reason-
ably small test suites. For our proposed approach, we
adopt the equivalence class partition testing method.
In general, this method partitions a given input or out-
put domain into disjoint sub-domains called equiva-
lence classes (Varshney and Mehrotra, 2014). The use
of some test values as representatives of each class
reduces the number of required test cases (Bhat and
Quadri, 2015), while still systematically covering the
respective domains. In our test approach, we spec-
ify a dedicated partitioning for each input parameter
of satellite on-board image processing applications.
Moreover, we define multidimensional coverage cri-
teria for our application domain, which combines the
individual coverage criteria for each input parameter
and enables us to assess a given test suite for its cov-
erage on the complete input domain. Our test gener-
ation approach uses our multidimensional criteria to
automatically assess given test suites with respect to
their coverage of input combinations and automati-
cally generates missing combinations. Thus, our test
approach enables efficient test case generation.
In order to investigate the efficiency of our pro-
posed test approach, we use the Fine Guidance Sys-
Witteck, U., Grießbach, D. and Herber, P.
Test Input Partitioning for Automated Testing of Satellite On-board Image Processing Algorithms.
DOI: 10.5220/0007807400150026
In Proceedings of the 14th International Conference on Software Technologies (ICSOFT 2019), pages 15-26
ISBN: 978-989-758-379-7
Copyright
c
2019 by SCITEPRESS – Science and Technology Publications, Lda. All rights reserved
15

tem (FGS) algorithm of the ESA (European Space
Agency) mission PLATO (PLAnetary Transits and
Oscillation of stars) as a case study. It is a satellite
on-board image processing algorithm to calculate the
high-precision attitude of the spacecraft by comparing
tracked star positions with known star positions from
a star catalog. The experimental results demonstrate
the effectiveness of our partitioning approach in terms
of an increased error detection capability.
This paper is structured as follows: In Section 2,
we give a brief overview of equivalence class parti-
tion testing and introduce the PLATO mission as well
as the FGS algorithm. In Section 3, we outline re-
lated work. In Section 4, we present our equivalence
class partitioning approach for on-board satellite im-
age processing applications. In Section 5, we present
experimental results, and we conclude in Section 6.
2 PRELIMINARIES
In this section, we introduce the necessary preliminar-
ies to understand the remainder of this paper.
2.1 Equivalence Class Partition Testing
To make testing more efficient and less time consum-
ing, it is preferable to examine few test cases that
cover a large part of the system under test. Equiva-
lence class partition testing offers a possible solution
to this problem. It is a commonly used approach in
practice. The technique partitions a given input do-
main or output domain into disjoint sub-domains, the
equivalence classes. The method partitions the do-
main in such a way, that all elements in an equivalence
class are expected to provoke the same system behav-
ior according to a specification. The partitioning is
based on one or multiple input parameters specified in
the requirements. Equivalence classes represent sub-
sets of parameter values that completely cover the in-
put or output domain. For the purpose of software
testing, it is therefore sufficient to test some represen-
tative values of each equivalence class.
The selection of test cases from equivalence
classes can be made according to various criteria: us-
ing border values, testing special values or randomly
selecting test cases (Bhat and Quadri, 2015; Huang
and Peleska, 2016; Peter Liggesmeyer, 2009). The
approach removes redundant test cases but retains the
completeness of the tests. Hence, the approach re-
duces the test effort compared to exhaustive testing
(Bhat and Quadri, 2015).
2.2 Context: PLATO Mission
PLATO is an ESA mission in the long-term space sci-
entific program “Cosmic Vision” (ESA, 2012). The
German Aerospace Center (DLR) manages the inter-
national consortium for developing the payload and
scientific operation of the project (DLR, 2017).
The main goal of the PLATO mission is the de-
tection and characterization of Earth-like exoplanets
orbiting in the habitable zone of solar-type stars. It
achieves its scientific objectives by long uninterrupted
ultra-high precision photometric monitoring of large
samples of bright stars. This requires a very large
Field of View (FOV) as well as a low noise level.
To achieve a high pupil size and the required FOV
the instrument contains 26 telescopes for star obser-
vation. 24 normal cameras monitor stars fainter than
magnitude 8 at a cycle of 25 s. Two fast cameras
observe stars brighter than magnitude 8 at a cycle
of 2.5 s. The size of the FOV of a fast camera is
38.7
◦
×38.7
◦
. The cameras are equipped with four
Charge Coupled Devices (CCD) in the focal plane,
each with 4510 ×4510 pixels.
Each fast camera comes with a data processing
unit running the FGS algorithm. It calculates attitude
data with an accuracy of milliarcseconds from the im-
age data. This data is supplied to the attitude and or-
bit control system. The FGS is regarded as being a
mission-critical component which implies a extensive
test procedure.
Fine Guidance System Algorithm. Many space-
craft missions use a FGS to obtain accurate mea-
surements of the spacecraft orientation. We use the
PLATO FGS algorithm as a case study to investigate
the efficiency of our test approach.
The attitude calculation of a telescope is based on
measured star positions on the CCD compared to their
reference directions in a star catalog. Figure 1 gives
an overview of the FGS algorithm (Grießbach, 2018).
The autonomous attitude tracking is initialized
with an initial attitude given by the space craft. For
each pre-selected guide star an initial sub-window po-
sition is calculated by means of the camera model,
which transforms from sky coordinates to pixel coor-
dinates and vice versa (Grießbach, 2018). Guide stars
are predefined stars in a star catalog that satisfy given
criteria. For example, the star magnitude is within
a certain range, the star has very low contamination,
etc. (Grießbach, 2018). The FGS algorithm calculates
centroids after reading 7 ×7 pixel sub-window every
2.5 s from the full CCD image.
A linear center of mass calculation estimates the
initial centroid position. To get a more precise solu-
ICSOFT 2019 - 14th International Conference on Software Technologies
16
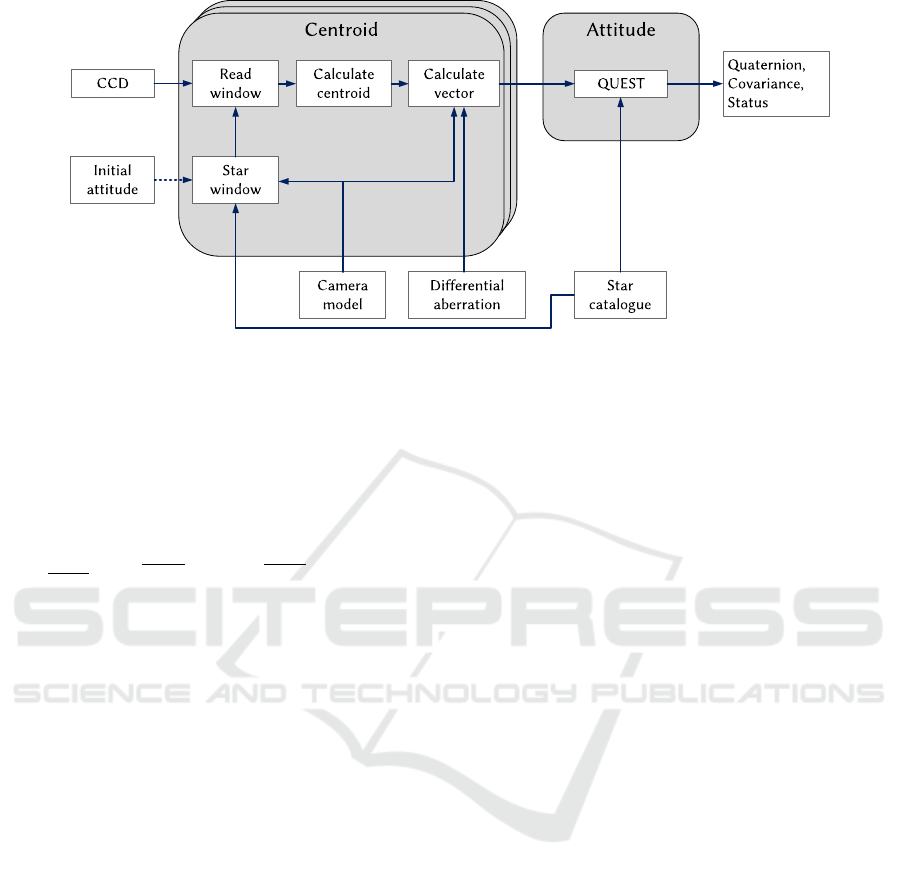
Figure 1: Overview of the FGS algorithm Grießbach (2018).
tion, the algorithm separately estimates each centroid
using a Gaussian point spread function (PSF) obser-
vation model. The PSF describes the distribution of
the star light over the CCD pixels. Equation (1) shows
the Gaussian PSF observation model h(i, j) of a single
pixel (Grießbach, 2018).
h =
I
m
2πσ
2
i+1
Z
i
e
−
(u−u
c
)
2
2σ
2
du
j+1
Z
j
e
−
(v−v
c
)
2
2σ
2
dv+D+ξ (1)
The FGS algorithm uses the measured pixel intensi-
ties to determine the centroid position (u
c
,v
c
)
T
, in-
tensity I
m
, image background D and PSF width σ. A
non-linear least square fitting method iteratively re-
fines the parameters of the PSF model. The FGS al-
gorithm calculates the correction by means of the QR-
decomposition (Grießbach, 2018). In the next step,
the pixel coordinates of the calculated centroid posi-
tion are transformed into star direction vectors in the
camera boresight reference frame. The x- and y-axis
of the detector and the optical axis of the camera de-
scribe the boresight reference frame.
In the last step, the FGS algorithm calculates an
attitude from at least two star directions in the bore-
sight reference frame and the corresponding reference
vectors from a star catalog. In addition, it delivers an
attitude covariance matrix.
3 RELATED WORK
Equivalence class partition testing “is probably the
most widely described, and one of the most widely
practiced, software testing techniques” (Kaner, 2004).
In this section, we present a selection of published
work on equivalence class partition testing.
3.1 Equivalence Class Partition Testing
Various studies investigated equivalence class parti-
tion testing strategies for different domains: railway,
automotive, avionics, etc. (Huang and Peleska, 2016).
In the automotive domain, DaimlerChrysler Re-
search developed a test approach, called Time Par-
tition Testing (TPT), to test the continuous behavior
of control systems. Bringmann and Kr
¨
amer (2006)
explained the principle of the TPT approach using
an exterior headlight controller as an example. In
most cases, automotive embedded control systems are
based on complex functional behavior and a large in-
put domain. To increase the test efficiency the TPT
approach systematically selects test cases revealing
redundant or missing test scenarios. Using a graph-
ical state machine notation, the TPT approach parti-
tions a test scenario into stream-processing compo-
nents. Each component defines the behavior of output
variables depending on the behavior of input variables
up to a certain point in time, specified by a temporal
predicate. Test cases define variations in the state ma-
chine to test various functional aspects of the system
under test.
The study shows that state machines are suitable
to partition the temporal behavior of input and output
variables in order to model, compare and select test
cases. The modeled test cases test the complex func-
tional requirements of control systems. A huge in-
put domain and complex functional behavior are also
characteristics of the system class we investigate in
this paper. However, the behavior of systems from
this class is not dependent on the arrival time of the
input values. Hence, the TPT approach is not applica-
ble to the system class that we consider.
In (Huang and Peleska, 2016), the authors pre-
sented a model-based black-box equivalence class
Test Input Partitioning for Automated Testing of Satellite On-board Image Processing Algorithms
17

partition testing strategy used in the railway domain.
The approach automatically generates finite and com-
plete test suites for safety-critical reactive systems in
relation to fault models. Huang and Peleska investi-
gated the approach using the Ceiling Speed Monitor
of the European Train Control System as an exam-
ple for systems with potentially infinite input domain
but finite output domain and internal variables. Their
approach models the reactive behavior of such sys-
tems by means of deterministic state transition sys-
tems. Moreover, it partitions the state space into a fi-
nite number of equivalence classes such that all states
in a class provide the same output traces for the same
non-empty input trace. Based on these classes, they
generates a complete test suite in the following sense:
First, at least one test in this suite fails when testing
an application that violates a given specification. Sec-
ond, each test in the suite passes for all applications
that satisfy the specification. Huang and Peleska in-
vestigated models whose behavior can be represented
by state transition systems. However, we have no state
transition system description of our considered satel-
lite application. Hence, we present an approach that
does not need such a description.
4 MULTIDIMENSIONAL
COVERAGE CRITERIA FOR
AUTOMATED TESTING
Many image processing applications require various
input parameters such as position of an object in the
image, magnitude of an object, position of an object
in a pixel, a pattern to distinguish different objects,
etc. This leads to a huge input domain, which makes
testing expensive. Testing such applications manually
is error-prone and time-consuming. Therefore, auto-
mated test systems are needed. However, automated
test generation for satellite on-board image process-
ing applications poses a challenge: The number of
possible input parameter combinations in the test im-
age are very large. That means an enormous amount
of test cases is possible. This makes it hard to effi-
ciently capture the huge input domain.
To overcome that problem, we define a partition-
ing approach that systematically selects test cases
from the huge input domain of satellite on-board im-
age processing applications. Our approach can be
used to assess and to enhance a given test suite. To
evaluate the efficiency of our test approach, we in-
vestigate a case study, namely the PLATO FGS al-
gorithm as described in Section 2.2. Satellite on-
board image processing algorithms especially require
extensive testing because such algorithms are subject
to strict requirements with respect to reliability and
mathematical accuracy.
Figure 2 depicts an overview of our proposed par-
titioning approach. The key idea is to define equiv-
alence classes on input parameters that are typically
used by satellite on-board image processing applica-
tions, namely position, magnitude, sub-pixel position,
and distribution model. Our main contributions are
threefold: First, we present novel concepts to partition
the individual input parameters of satellite image pro-
cessing algorithms into equivalence classes. Second,
we define multidimensional coverage criteria based
on a combination of the individual criteria for each
input parameter to efficiently cover the whole input
domain. Third, we define a test generation algorithm
that automatically selects test cases that completely
cover the whole input domain according to our multi-
dimensional coverage criteria.
The goal of the test is to automatically detect
errors in the on-board image processing application
code. To achieve this, our test generation algorithm
selects for each equivalence class combination a test
case from a given test suite as representatives. Thus,
our approach reduces the number of redundant test
cases. Furthermore, our algorithm generates new test
cases for missing combinations to reach complete
coverage of the input domain. The result is a rea-
sonably small test suite that covers the whole input
domain of the image processing application. The se-
lected test cases serve as input for our automated test-
ing framework. Moreover, we insert requirements for
the automated evaluation of the image processing ap-
plication results. If they do not meet the requirements,
the test detects an error.
The following sections describe the mentioned
steps of the partitioning approach in more detail us-
ing the PLATO FGS algorithm as a case study.
4.1 Assumptions and Limitations
In the following, we consider systems with objects in
an image as inputs. In the case study, the observed
objects are stars with magnitudes between 5.5 to 7.0,
uniformly distributed in the image (Grießbach, 2018).
We consider four parameters that affect the math-
ematical accuracy of the FGS algorithm: the guide
star position, magnitude, sub-pixel position, and PSF
shape. The test evaluation is based on the centroid po-
sition calculated by the centroid algorithm of the FGS.
The input of the centroid calculation is a single star.
We define a test star as a test case for the automated
test generation.
ICSOFT 2019 - 14th International Conference on Software Technologies
18
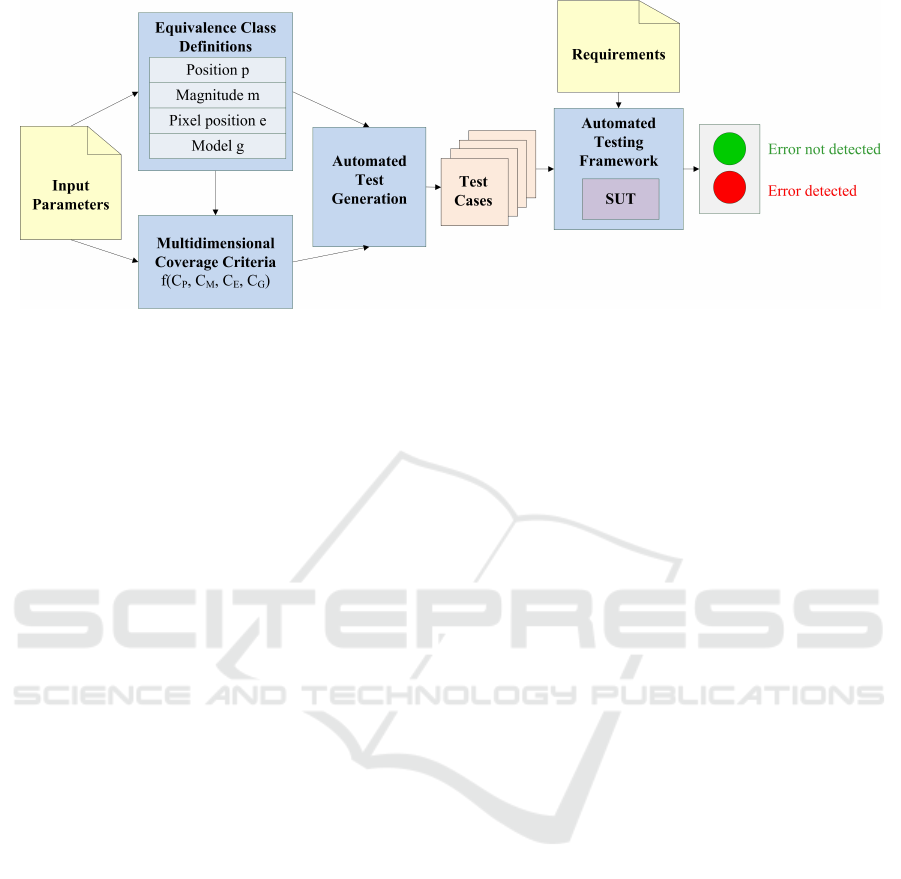
Figure 2: Overview of the partitioning approach.
4.2 Running Example: Input
Parameters
One of the main contributions of this paper is our def-
inition of multidimensional coverage criteria on the
input domain of satellite on-board image processing
applications. These criteria are based on the combi-
nation of equivalence classes of the FGS input star pa-
rameters given in Section 4.1. The mathematical ac-
curacy of the centroid estimation depends on the com-
bination of these input parameters. In this section, we
describe how the parameters affect the quality of the
centroid calculation.
The star signal is spread over all pixels in the sub-
image. Hence, each pixel includes information about
the star. However, 90 % of the energy is within 2 ×2
pixel around the centroid. Each pixel also contains
noise. We call the information usable if the star sig-
nal is little interfered by noise and the Signal-to-Noise
Ratio (SNR) is high. If the SNR in the pixel is suf-
ficient, a linear independent equation exists for this
pixel. The centroid calculation needs at least 5 lin-
ear independent equations to estimate the 5 unknown
parameters of the pixel observation (cf. Equation (1)).
The distribution of the star signal depends on the
star position on the Focal Plane Assembly (FPA) and
the sub-pixel position. Due to optical aberrations of
the telescope, the PSF shape of the star is wider in
the FPA corner than close to the center. Assume the
other input parameters contain reasonably good, con-
stant values. Then a small PSF leads to a low number
of pixels with a high SNR and a low number of lin-
ear independent equations. In case of a wide PSF the
SNR is low but many linear independent equations
exist. Both cases can be sufficient for an accurate pa-
rameter estimation (Grießbach, 2018).
The SNR in a pixel also depends on the centroid
sub-pixel position. Suppose the other parameters have
adequate, constant values. If the centroid is posi-
tioned in the pixel center, most star flux is accumu-
lated in a few pixels. Then these pixels have a high
SNR compared to the neighboring pixel. In contrast,
more pixels have a sufficient SNR if the centroid is on
the pixel border or corner. In this case, the star infor-
mation is distributed more evenly over several pixels.
The other pixels have a low SNR. Due to movement,
the centroid may move to neighbor pixels. This leads
to variations in the pixel illumination and the apparent
centroid position (Grießbach, 2018).
The star magnitude affects the measured flux
(photoelectrons per second) of the star. The accumu-
lated number of photoelectrons per pixel denotes the
illumination of a pixel. Equation (2) shows the rela-
tion between the magnitude m and the corresponding
flux F
m
in e
−
/s.
F
m
= F
0
T QA ∗10
−0.4∗m
(2)
with magnitude m, reference flux F
0
of a star with
m = 0, transmission efficiency T of the optical sys-
tem, quantum efficiency Q of the detector, and effec-
tive light-collecting area A. As the equation shows,
the star flux is non-linear to the magnitude of the star.
A low magnitude corresponds to a high number of
photoelectrons, corresponding to a higher SNR per
pixel. More information is usable than in case of a
high magnitude.
In addition, the accuracy of the centroid calcula-
tion depends on the PSF shape. In the best case sce-
nario, the shape is a symmetric Gaussian-PSF. Then,
the observation model perfectly fits the star. There-
fore, the accuracy of the centroid calculation is high.
But in reality, the PSF shape is non-Gaussian. In that
case, the observation model is less accurate. Besides,
movements lead to stronger variations in the expected
centroid positions (Grießbach, 2018).
While individual parameter values might provide
a good centroid estimation, a combination of param-
Test Input Partitioning for Automated Testing of Satellite On-board Image Processing Algorithms
19
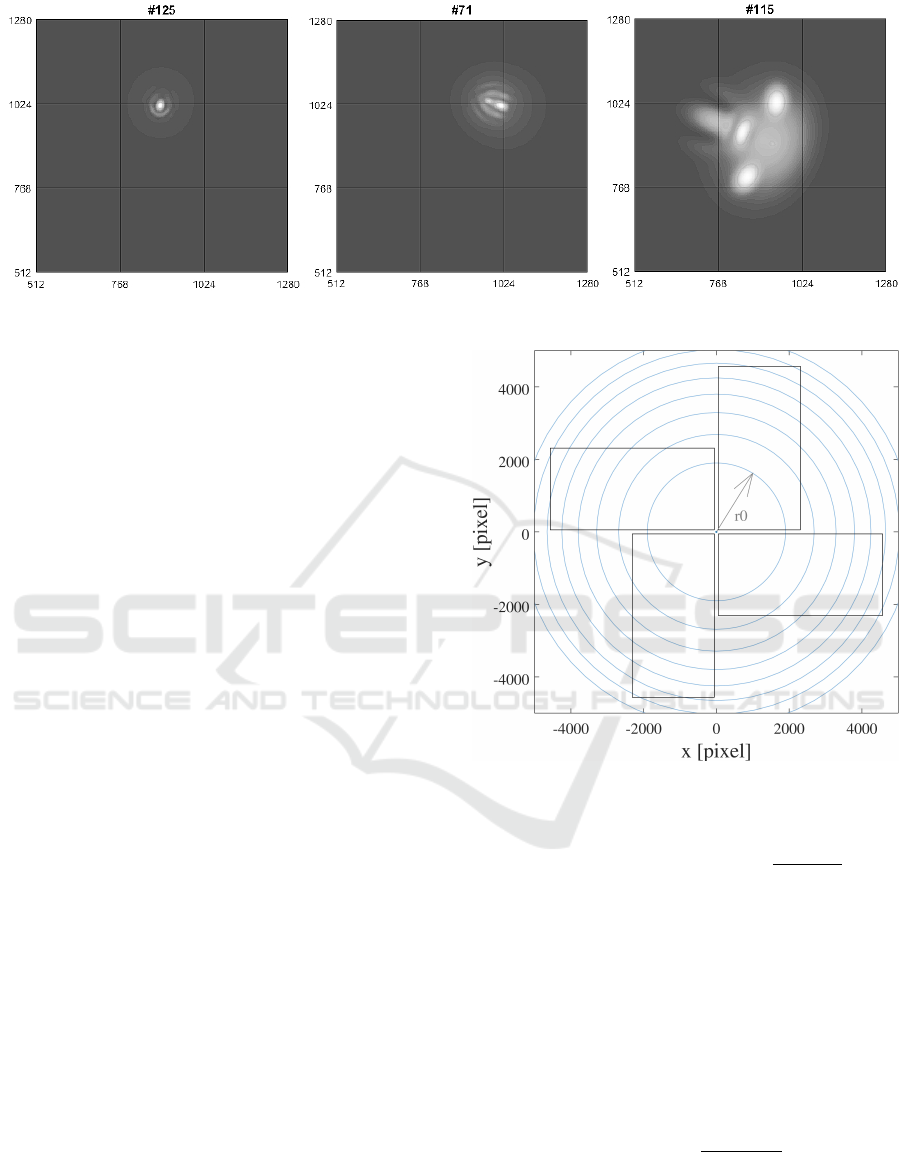
Figure 3: Examples of different low quality stars (Grießbach, 2018).
eters may change the quality of the results. For illus-
tration, Figure 3 shows some example stars with non-
Gaussian-PSF shape that are less suitable as guide
stars. They all lead to inaccurate estimation results.
What the three stars have in common is that their
intensity is concentrated on a pixel edge. For all stars,
the magnitude and FPA position are sufficiently good.
However, a small variation due to movement leads to
big changes of the illumination. Since the Gaussian-
PSF observation model does not fit the star PSF shape
perfectly, the centroid estimation is less accurate and
the FGS assumes a big movement of the star.
4.3 Equivalence Class Definitions
The quality of the centroid calculation of the FGS al-
gorithm depends on various parameters. Thus, we de-
fine the input domain as a set of input parameters I.
The set includes the position on the FPA P , the mag-
nitude M , the sub-pixel position E and the PSF shape
G. To keep the approach more flexible the tester sets
the borders of equivalence classes. Thus parameters
can also be excluded from the analysis. In this sec-
tion, we present our concepts for partitioning the input
parameters P, M , E and G into equivalence classes.
Star Position on the FPA. Section 4.2 clarifies that
size and shape of the PSF depend on the star position
on the FPA. Since the PSF changes with the distance
to the FPA center, our idea is to partition the FPA into
equally sized, circular areas as seen in Figure 4. The
tester specifies the initial radius r
0
. The rectangles
represent the image area of the fast camera CCDs.
We partition parameter P into equivalence classes
P
r
n
. Each class P
r
n
corresponds to a circular FPA area
with inner radius r
n−1
and outer radius r
n
.
P = P
r
1
∪P
r
2
∪...∪P
r
n
∪...∪P
r
I
P
with 1 ≤n ≤I
P
(3)
Let S denote the set of available stars. A star s ∈ S
lies in an equivalence class P
r
n
if following condition
Figure 4: Example of cyclic borders of FPA equivalence
classes.
holds:
r
n−1
≤ p(s) < r
n
, with p(s) =
p
x
s
2
+ y
s
2
(4)
where (x
s
,y
s
) is the position of star s on the FPA and
p(s) is the distance of the star s to the FPA center.
Star Magnitude. A useful partitioning of magni-
tude values into equivalence classes is not obvious.
Our idea is to partition the star flux, which is non-
linear to the magnitude, range into I
M
∈N equidistant
parts that represent the equivalence classes. We define
Equation (5) to obtain the upper limit of a sub-range.
F
m
j
= F
7.0
+ j
F
5.5
−F
7.0
I
M
(5)
F
m
j
is the flux of magnitude m
j
and j = 1...I
M
repre-
sents the j-th equivalence class of parameter M . F
5.5
and F
7.0
are the numbers of photons for magnitude 5.5
ICSOFT 2019 - 14th International Conference on Software Technologies
20
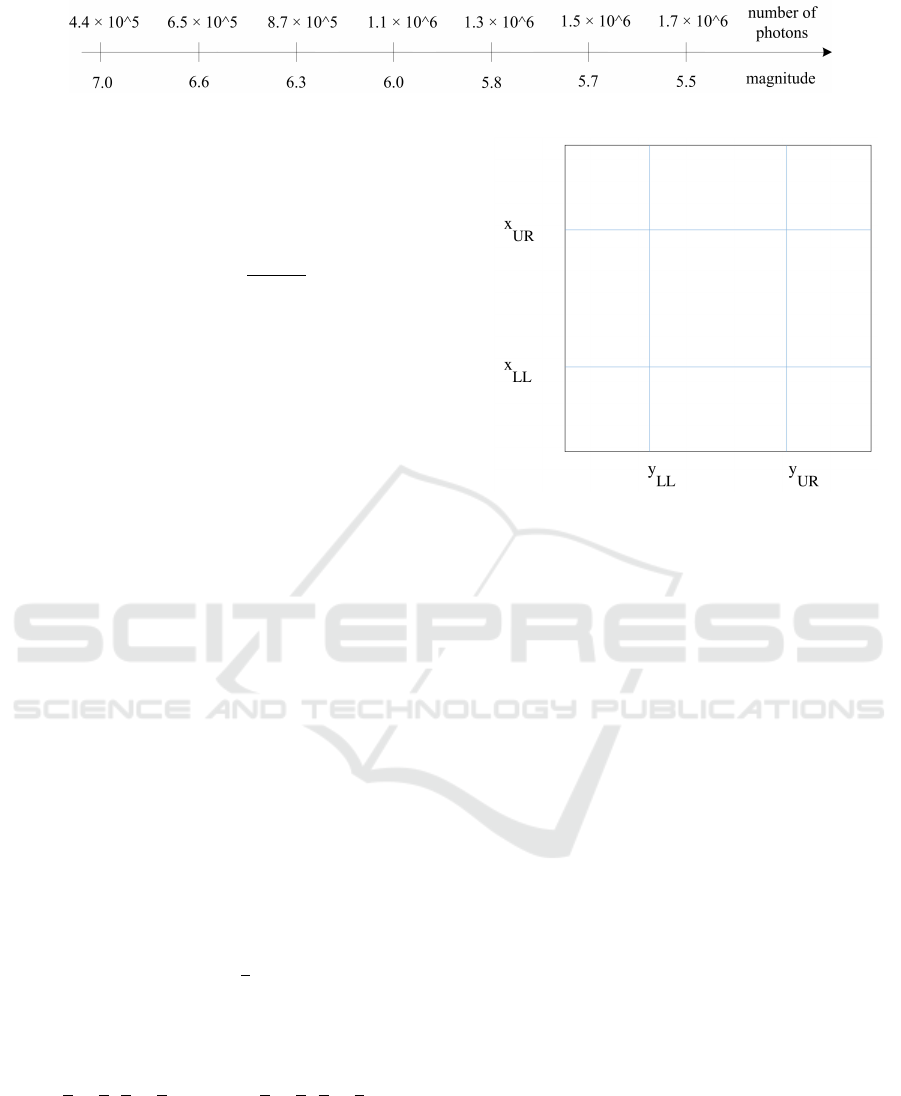
Figure 5: Example partitioning of magnitude range.
and 7.0. We calculate the flux values F
5.5
and F
7.0
by
using Equation (2). Furthermore, we use Equation (6)
to recalculate the magnitude m
j
from the calculated
flux limit F
m
j
of the flux sub-range.
m = −2.5 ∗log
F
m
F
0
T QA
(6)
From a formal point of view, we partition the param-
eter M into equivalence classes M
l
.
M = M
7.0
∪... ∪M
l
j
∪... ∪M
5.5
(7)
with l
j
∈ R and 5.5 ≤ l
j
≤ 7.0. Each equivalence
class M
l
j
is a magnitude sub-range with upper limit
l
j
. Each available star s lies in equivalence M
l
j
if it
satisfies the condition in Equation (8).
l
j−1
≤ m(s) < l
j
(8)
where m(s) denotes the observed magnitude of star s
and l
j
with j = 1...I
M
is the upper limit of the j-th
magnitude sub-range. The tester specifies the num-
ber of equivalence classes I
M
∈ N of the parameter
M . Figure 5 illustrates an example partitioning of the
magnitude range.
Star Sub-pixel Position. The quality of the cen-
troid estimation of stars close to a pixel border is as
sensitive to movements as the estimation of stars with
centroids on a pixel corner and vice versa. For this
reason, we divide the pixel area into different sub-
areas as shown in Figure 6.
The tester specifies the ratio r of the central area
of the pixel to the pixel area, for example, 1/2, 3/5,
etc. If a is the pixel size, then the length of the edge
of the central area results from Equation (9).
b = a
√
r (9)
With that, we obtain the lower left corner l and the
upper right corner u of the central pixel area, with
l = (
a
2
−
b
2
,
a
2
−
b
2
) and u = (
a
2
+
b
2
,
a
2
+
b
2
) (10)
Based on these corners, we partition parameter E into
equivalence classes E
i
with i = 0...8. The equivalence
class E
i
is the i-th pixel sub-area. A star s lies in an
equivalence class if it satisfies the corresponding con-
dition.
E = E
0
∪E
1
∪... ∪E
8
(11)
Figure 6: Example borders of pixel equivalence classes.
E
0
: 0 ≤ e
x
(s) < x
l
∧ 0 ≤ e
y
(s) < y
l
E
1
: 0 ≤ e
x
(s) < x
l
∧ y
l
≤ e
y
(s) < y
u
E
2
: 0 ≤ e
x
(s) < x
l
∧ y
u
≤ e
y
(s) < a
E
3
: x
l
≤ e
x
(s) < x
u
∧ 0 ≤ e
y
(s) < y
l
E
4
: x
l
≤ e
x
(s) < x
u
∧ y
l
≤ e
y
(s) < y
u
E
5
: x
l
≤ e
x
(s) < x
u
∧ y
u
≤ e
y
(s) < a
E
6
: x
u
≤ e
x
(s) < a ∧ 0 ≤ e
y
(s) < y
l
E
7
: x
u
≤ e
x
(s) < a ∧ y
l
≤ e
y
(s) < y
u
E
8
: x
u
≤ e
x
(s) < a ∧ y
u
≤ e
y
(s) < a
(12)
e
x
(s) and e
y
(s) return the x-coordinate and y-
coordinate of s in the pixel respectively.
Star PSF Shape. We partition the parameters G in
two equivalence classes G
G
and G
NG
since two PSF
shapes are distinctive (see Section 4.2). If a star has a
Gaussian-PSF shape it is in class G
G
otherwise it is in
class G
NG
.
4.4 Multidimensional Coverage Criteria
We define multidimensional coverage criteria on the
input domain of satellite on-board image processing
applications to measure the coverage of a test suite
with respect to input parameter combinations. If the
measured coverage of a test suite is not complete, our
automated test generation algorithm automatically in-
serts test cases for missing combinations. This section
Test Input Partitioning for Automated Testing of Satellite On-board Image Processing Algorithms
21

presents our definitions of multidimensional coverage
criteria on the input domain I = {P ,M , E,G}.
The individual coverage of an input parameter de-
notes the ratio of equivalence classes that are covered
by at least one test case from a given test suite to the
number of equivalence classes of this input parame-
ter. Equations (13) to (16) show this definition for the
input parameters P , M , E and G.
C
P
=
# covered elements o f P
|P |
(13)
C
M
=
# covered elements o f M
|M |
(14)
C
E
=
# covered elements o f E
|E|
(15)
C
G
=
# covered elements o f G
|G|
(16)
The coverage domain for our multidimensional
coverage criteria is the Cartesian product of equiva-
lence classes of the input parameters P , M , E and G.
Therefore, an input combination is a tuple of equiv-
alence classes (P
i
,M
j
,E
k
,G
l
), where P
i
∈ P , M
j
∈
M , E
k
∈ E and G
l
∈ G. Furthermore, a test case
is a star represented by a tuple of parameter values
(p,m,e,g) ∈ (P
i
,M
j
,E
k
,G
l
). The following example
test cases clarify these definitions.
Example 1:
(930.4,6.5,(0.4,0.1),G) ∈ (P
2000
×M
6.6
×E
3
×G
G
)
The test star position is in the FPA area with radius
2000. The star belongs to equivalence class M
6.6
be-
cause its magnitude value is between 6.3 and 6.6.
The star center is located in the middle-left pixel sub-
area. That corresponds to equivalence class E
3
. The
star is part of equivalence class G
G
, because it has a
Gaussian-PSF shape.
Example 2:
(579.1,6.5,(0.9,0.2),G) ∈ (P
2000
×M
6.6
×E
6
×G
G
)
The test star is similar to the star in the first example,
but it belongs to equivalence class E
6
, which means
that the center of the star is positioned nearby the up-
per left pixel border.
Our multidimensional coverage criterion is fully
satisfied if the test cases in a test suite cover all possi-
ble input combinations at least once. The number of
required covered input combinations for a complete
coverage is |P ×M ×E ×G|. In the remaining sec-
tions, we denote a test suite that completely covers
the input domain with respect to our multidimensional
coverage criteria as a complete test suite. The multi-
dimensional coverage C results from the ratio of the
amount of input combinations covered by at least one
test case to the total number of input combinations.
C =
# covered input combinations
|P ×M ×E ×G|
(17)
Our test approach calculates the individual and multi-
dimensional coverage of a given test suite using Algo-
rithm 1. The input parameters P , M , E, and G con-
tain I
P
, I
M
, I
E
, I
G
equivalence classes respectively.
Input: Test suite T S
Output: Multidimensional coverage Cov of
T S
1 C
P
= C
M
= C
E
= C
G
= C =
/
0;
2 foreach tc with (p, m, e, g) ∈ TS do
3 i
P
= getPosECId(p);
4 C
P
←C
P
∪i
P
;
5 i
M
= getMagECId(m);
6 C
M
←C
M
∪i
M
;
7 i
E
= getPixECId(e);
8 C
E
←C
E
∪i
E
;
9 i
G
= getModECId(g);
10 C
G
←C
G
∪i
G
;
11 C ←C ∪(i
P
,i
M
,i
E
,i
G
);
12 end
13 Cov
G
= |C
P
|/I
P
;
14 Cov
M
= |C
M
|/I
M
;
15 Cov
E
= |C
E
|/I
E
;
16 Cov
G
= |C
G
|/I
G
;
17 Cov = |C|/(I
P
·I
M
·I
E
·I
G
)
Algorithm 1: Coverage calculation.
For each test case in the given test suite, the al-
gorithm computes for each input parameter the index
i
P
,i
M
,i
E
,i
G
of the corresponding equivalence class
from P , M , E and G. The algorithm adds the indices
to the sets C
P
, C
M
, C
E
and C
G
respectively. More-
over, it inserts the tuple (i
P
,i
M
,i
E
,i
G
) into the set C
that contains all covered input combinations. As the
algorithm uses the union operator to add the tuples to
the set, each tuple is included in the set only once.
The algorithm applies Equations (13) to (17) to com-
pute the individual and multidimensional coverage.
Our partitioning approach can be used to assess
the quality of test suites with respect to their cover-
age on the input space of a satellite on-board image
processing application with respect to individual and
multidimensional coverage criteria.
ICSOFT 2019 - 14th International Conference on Software Technologies
22

4.5 Automated Test Generation
In order to systematically generate a test suite that
completely covers the input domain according to our
multidimensional coverage criteria, we propose Algo-
rithm 2. The complete test generation algorithm uses
1 to assess a given test suite and then systematically
generates missing test cases.
Input: Input combination universe U , covered
input combination set C, test suite T S
Output: Complete test suite T S
1 Cov = computeMultidimCoverage(TS);
2 if Cov < 1 then
3 W ←U \C;
4 foreach w ∈W do
5 tc = generateTC(w);
6 T S ← T S ∪tc;
7 end
8 end
Algorithm 2: Generate complete test suite.
The algorithm generates set W that contains all
input combinations not covered by the given test
suite. For each input combination in W , the algorithm
uses procedure generateTC that generates a test case
by randomly selecting values from the equivalence
classes of the missing combinations. The algorithm
adds the newly generated test case to the test suite. In
this way, it efficiently inserts missing but relevant test
cases into the test suite. This increases the multidi-
mensional coverage and therefore the error detection
capability of the given test suite. The result of our
automated test generation is a complete test suite.
If the set of covered input combinations C is
empty, then the set of uncovered input combinations
W is equal to the universe of possible input combi-
nations U . Hence, Algorithm 2 can also be used to
generate a new test suite that completely satisfies the
multidimensional coverage criteria. Our automated
testing framework only selects one test case per input
combination. This efficiently reduces the number of
redundant test cases for the test execution.
5 EVALUATION
To evaluate our approach, we have implemented the
proposed partitioning and test generation algorithm.
We have evaluated its applicability and error detec-
tion capability for satellite on-board image processing
applications using the FGS algorithm of the PLATO
mission with various test suites.
5.1 Implementation
Figure 7 shows the block diagram of our test setup.
As the figure depicts, our test environment runs on a
Windows system. We have implemented the environ-
ment in C++ based on the model-view-controller pat-
tern. We allow the tester to specify input parameters
with or without graphical user interface (GUI).
Our automated test generation algorithm returns
a star catalog to simulate star data for missing in-
put combinations. The catalog is a text file that in-
cludes right ascension, declination, and magnitude of
stars that should be simulated. We manually insert the
catalog into the PLATO simulator PlatoSim (Marcos-
Arenal et al., 2014). PlatoSim writes the simulated
star data to a HDF5 file (The HDF Group, 2018).
Each file contains an image sequence of several time
steps of a star in a hierarchical file format. Since
PlatoSim is not developed for Windows systems, the
simulator runs in a Linux virtual machine.
As shown in Figure 7, we connect the Win-
dows system via a SpaceWire USB brick to a GR-
XC6S FPGA development board (PENDER ELEC-
TRONIC DESIGN GmbH, 2011) running at 50 MHz.
SpaceWire is a data-handling network for spacecraft
defined in (ECSS Executive Secretariat, 2008). For
that, our test environment uses the C SpaceWire USB
API Library for the SpaceWire USB brick. A proto-
type of the FGS algorithm, written in C, runs on the
evaluation board. We load the software with the Leon
debug monitor GRMON onto this board. Via a UART
interface we receive debug information in a terminal.
For example, stack size, hardware information, etc.
Our objective is to evaluate our approach for the
development and test of the FGS algorithm imple-
mentation. Moreover, our goal is to test execution
time and mathematical accuracy of the FGS algorithm
under realistic conditions. For example, a calculation
on the development board is slower than the same cal-
culation on a Windows system. Therefore, we run the
application under test on the target hardware and keep
the test system in the software development cycle.
5.2 Experimental Results
In this section, we present the experimental results for
generating a test suite using our partitioning approach
for testing the PLATO FGS algorithm.
Since no investigations of the class boundaries
have yet been carried out, we have started by estimat-
ing the following parameters for the experiments:
- Initial radius r
0
of FPA partitioning: 1900 pixel
- Number of magnitude sub-ranges: 6
- Ratio r of central sub-area to pixel area: 0.2
Test Input Partitioning for Automated Testing of Satellite On-board Image Processing Algorithms
23
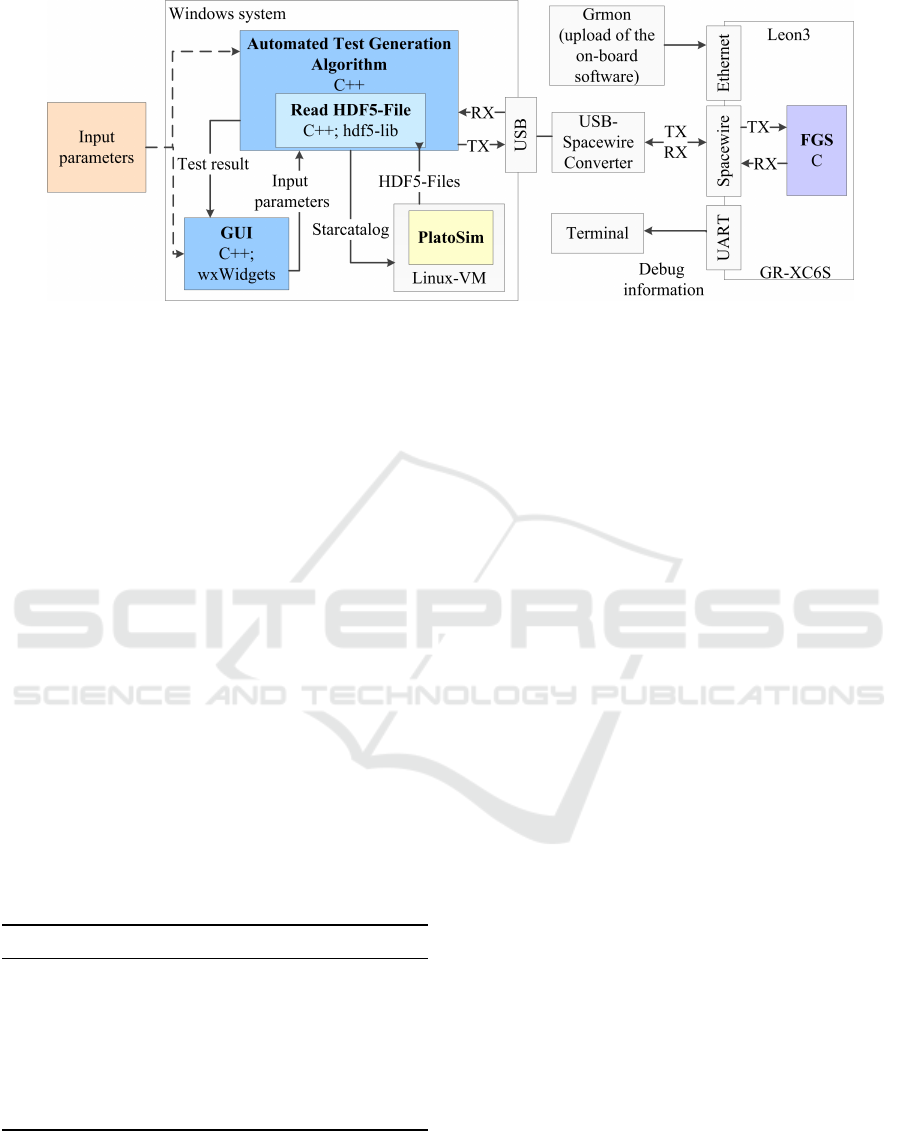
Figure 7: Block diagram of test setup.
Using the parameters leads to 8 equivalence
classes of input parameter P, 6 equivalence classes of
parameter M and 9 equivalence classes of E. Input
parameter G consists of two equivalence classes (G
G
and G
NG
). Thus, our automated testing framework
needs 864 test cases to completely cover the whole
input domain of the FGS algorithm.
To evaluate the approach, we have investigated
the quality of two different test suites with respect to
their multidimensional coverage on the input domain.
One test suite contains 82 randomly generated stars.
Our automated test generation algorithm identifies 10
stars in the suite as redundant. The test suite achieves
8.3 % coverage of the input domain with respect to
our multidimensional coverage criteria. Algorithm 2
from Section 4.5 enhances the suite to achieve com-
plete coverage on the input domain. In the following,
we call it complete test suite. The other test suite con-
tains 902 randomly generated but evenly distributed
stars. We call it random test suite and did not improve
it. Table 1 shows the coverage of the test suites for
each input parameter as well as the achieved multidi-
mensional coverage.
Table 1: Coverage values of the test suites.
random complete
Test stars 902 874
Covered input combinations 112 864
C
P
[%] 87.5 100.0
C
M
[%] 16.7 100.0
C
E
[%] 100.0 100.0
C
G
[%] 100.0 100.0
Multidim. coverage [%] 13.0 100.0
Table 1 shows that the utilization of the equiva-
lence class partitioning method reduces the random
test suite by hundreds of redundant test cases. Since
there are no unnecessary executions of redundant test
cases, this saves test time. Thus, the method increases
the efficiency of the test process. The random test
suite achieves a high individual coverage of three in-
put parameters. However, due to the low individual
coverage of input parameter M , the multidimensional
coverage of the test suite is low. Furthermore, Table 1
exhibits that the complete test suite covers the whole
input domain of the FGS algorithm.
To assess the partitioning approach, we have au-
tomatically inserted some faults into the code of the
centroid calculation of the PLATO FGS algorithm.
These injected faults belong to three classes: missing
assignment, wrong assignment and wrong condition.
For each test execution, we have injected a single er-
ror at a different position in the code. Our objective
is to check if the complete test suite achieves a higher
error detection capability than the random test suite.
In each experiment, our test application sent 1000
packets per selected test star, with one exposure each,
to the evaluation board running the FGS algorithm.
Our test application averages the resulting centroid
positions over all exposures and compares it with the
position in the star catalog. If the deviation of the po-
sitions is greater than a predefined value, the test de-
tects the error. Table 2 shows the output for one test
case that detects a missing assignment error. The high
deviation of the calculated position from the given po-
sition reveals an error in the centroid calculation.
During the experiments, we have injected three
missing assignment errors, three wrong assignment
errors, and three wrong condition errors. Table 3 sum-
marizes the experimental results for both test suites.
The table shows long execution times for the tests.
The reason is that the evaluation board only receives
20 packets per second. Moreover, Table 3 shows that
both test suites do not reveal all injected errors with
respect to the given test criterion. The random test
suite, as well as the complete test suite, detects one
missing assignment error. In addition, 6 test cases
from the complete test suite reveal one wrong assign-
ICSOFT 2019 - 14th International Conference on Software Technologies
24

Table 2: Output for a sample test case.
i
G
i
P
i
M
i
E
Star-Id x [pixel] y [pixel] deviation [pixel] result
1 1 0 8 28 2.96 ×10
19
2.38 ×10
19
3.80 ×10
19
error detected
Table 3: Test suites evaluation results.
random complete
Test cases 112 864
Execution time [h] 1.5 11.8
Detected errors 1 3
Undetected errors 9 7
Error detection ability [%] 10.0 30.0
ment error and 1 test case detects one wrong condition
error. During the test development, we detected an er-
ror in the FGS algorithm code that we did not inject.
But using the specified test criterion, both test suites
do not detect the error. Moreover, the tests do not de-
tect three of the injected assignment errors because
the deviation only changes slightly in case of these
errors. In addition, for some test cases, the deviation
increases and in others decreases in such a way that
the specified deviation value is not reached. The tests
also do not detect the other injected errors and the
unintended error because these errors affect other pa-
rameters estimated by the centroid calculation. There-
fore, the deviation for all test cases is smaller than the
predefined value in the test criterion. However, the
error detection capability of the complete test suite is
with respect to the specified test criterion three times
higher than the error detection capability of the ran-
dom test suite. Nevertheless, for both test suites, the
error detection capability is low because not all in-
jected errors affect the results in such a way that the
deviation increases. Therefore, our specified test cri-
terion is not suitable to detect all injected errors. This
shows, that the specified test criterion plays an impor-
tant role in the success of the tests.
We have specified another test criterion: the test
passes if the distance between the centroid position
calculated by an erroneous calculation and the cen-
troid position resulting from an assumed error-free
calculation exceeds a predefined value. In this case,
not all test cases of the test suites detect the errors.
This means special input combinations are more ca-
pable to detect errors than others. In case of the wrong
condition errors and the unintended error, the percent-
age of error detecting test cases from the random test
suite is up to one third compared to the percentage of
error detecting test cases of the complete test suite.
Therefore, using the complete test suite increases the
confidence to find an error with the test. In the other
cases, the percentage of error detecting test cases is
approximately 99 % for both test suites. However, for
this test criterion, the complete test suite has a higher
error detection capability than the random test suite.
Our partitioning approach reduces the number of
relevant test cases. Therefore, applying the approach
increases the test efficiency. The results show that the
error detection capability of the test suite that com-
pletely satisfies our multidimensional coverage crite-
ria is significantly higher than the capability of the
random test suite. The success of our approach de-
pends on the specified test criterion as well as on the
definition of the equivalence classes.
6 CONCLUSION
Due to the large input domain of on-board image
processing applications, an enormous amount of test
cases is possible. This makes it infeasible to capture
the whole input domain and execute the test cases ex-
haustively. In this paper, we have presented a test par-
titioning approach that systematically generates a rea-
sonably small test suite with complete coverage on the
input domain of satellite on-board image processing
applications. To achieve this, we have defined a dedi-
cated partitioning for each input parameter of a satel-
lite on-board image processing application, and we
have defined coverage criteria with respect to the pro-
posed equivalence classes. Based on these individual
coverage criteria, we have furthermore defined mul-
tidimensional coverage criteria, which can be used
to assess a given test suite with respect to its cover-
age on the complete input domain. Finally, we have
presented an automated test generation algorithm that
systematically generates missing test cases according
to our multidimensional coverage criteria. As a result,
our approach is able to fully automatically generate
test suites that are complete with respect to our mul-
tidimensional coverage criteria. The tester specifies
the size of our equivalence classes. This makes our
approach adjustable to available test times and also to
other image processing applications.
We have investigated the effectiveness of our pro-
posed test approach on the FGS algorithm as an ap-
plication with high criticality for the PLATO mission.
In the experiments, our automated test generation al-
gorithm generates a test suite that is complete with
respect to our multidimensional coverage criteria. To
demonstrate the effectiveness of our test approach, we
have compared the error detection capability of a ran-
Test Input Partitioning for Automated Testing of Satellite On-board Image Processing Algorithms
25

domly generated test suite and the generated complete
test suite. The use of our equivalence classes of the in-
put parameters reduces the number of redundant test
cases in the randomly generated test suite by 87.6 %.
During the experiments, we have successively in-
jected 9 errors in the FGS algorithm code to investi-
gate the error detection capability of both test suites.
We have used two different test criteria: First, a test
case detects an error if the distance between the cal-
culated centroid position and a given position is larger
than a predefined value. Second, a test case detects an
error if the distance of the erroneous calculated po-
sition and an assumed error-free calculated position
exceeds a specified value. We have observed that dif-
ferent test criteria lead to different test results. For the
first test criterion, the complete test suite detects 3 in-
jected errors while the randomly generated test suite
detects 1 injected error. The error detection capability
of the complete test suite is about 3 times higher than
the capability of the randomly generated test suite.
But both test suites do not detect all errors. In another
experiment, we have used the second test criterion.
In this case, not all test cases in the test suites detect
all errors. In the case of 3 injected errors and an un-
intended error, the percentage of error detecting test
cases in the complete test suite is again about 3 times
higher than for the randomly generated test suite. For
the other 6 injected errors, the percentage of error de-
tecting test cases is for both test suites about 99 %.
The experiments showed that a systematic test us-
ing our proposed partitioning approach increases the
error detection capability of a given test suite. This
makes the partitioning approach efficient and effec-
tive. In addition, it facilitates the automated genera-
tion, the execution, and the evaluation of test cases.
So far, we have injected errors in the application
code. But in space, many missions suffer from cos-
mic radiation that flips bits in binary code or cause
hot pixels in input images. We plan to investigate the
efficiency of our approach by injecting errors in input
data or in the binary code of the application in future
work. Finally, we have evaluated our approach with
a single application. Later on, we plan to investigate
the flexibility of our approach for other applications,
for example, blob feature extraction in the robotics
domain (Bruce et al., 2000; Merino et al., 2006).
REFERENCES
Bhat, A. and Quadri, S. (2015). Equivalence class par-
titioning and boundary value analysis-a review. In
Intl. Conf. on Computing for Sustainable Global De-
velopment (INDIACom), pages 1557–1562. IEEE.
Bringmann, E. and Kr
¨
amer, A. (2006). Systematic testing
of the continuous behavior of automotive systems. In
International Workshop on Software Engineering for
Automotive Systems, pages 13–20. ACM.
Bruce, J., Balch, T., and Veloso, M. (2000). Fast and
inexpensive color image segmentation for interactive
robots. In IEEE/RSJ Intl. Conf. on Intelligent Robots
and Systems, volume 3, pages 2061–2066. IEEE.
DLR (2017). Gr
¨
unes Licht f
¨
ur europ
¨
aisches Weltraumte-
leskop PLATO. http://www.dlr.de/dlr/desktopdefault.
aspx/tabid-10081/151 read-22858/#/gallery/27241.
ECSS Executive Secretariat (2008). Space engineering.
SpaceWire – Links, nodes, routers and networks.
ESA (2012). ESA’s ’Cosmic Vision’. http://www.esa.int/
Our Activities/Space Science/ESA s Cosmic Vision.
Grießbach, D. (2018). Fine Guidance System Performance
Report. DLR, Berlin.
Huang, W.-l. and Peleska, J. (2016). Complete model-based
equivalence class testing. Intl. Journal on Software
Tools for Technology Transfer, 18(3):265–283.
Kaner, C. (2004). Teaching domain testing: A status re-
port. In Conference on Software Engineering Educa-
tion and Training, pages 112–117. IEEE.
Marcos-Arenal, P., Zima, W., De Ridder, J., Aerts, C., Huy-
gen, R., Samadi, R., Green, J., Piotto, G., Salmon,
S., Catala, C., et al. (2014). The PLATO Simula-
tor: modelling of high-precision high-cadence space-
based imaging. Astronomy & Astrophysics, 566:A92.
Merino, L., Wiklund, J., Caballero, F., Moe, A., De Dios,
J. R. M., Forssen, P.-E., Nordberg, K., and Ollero, A.
(2006). Vision-based multi-UAV position estimation.
IEEE robotics & automation magazine, 13(3):53–62.
PENDER ELECTRONIC DESIGN GmbH (2011). Gr-
xc6s-product sheet.
Peter Liggesmeyer (2009). Software-Qualit
¨
at: Testen,
Analysieren und Verifizieren von Software. Spektrum
Akademischer Verlag, 2 edition.
The HDF Group (April 05, 2018). Hdf5. https://portal.
hdfgroup.org/display/HDF5/HDF5.
Varshney, S. and Mehrotra, M. (2014). Automated software
test data generation for data flow dependencies using
genetic algorithm. International Journal, 4(2).
Witteck, U. (2018). Automated test generation for satellite
on-board image processing. Master thesis, TU Berlin.
ICSOFT 2019 - 14th International Conference on Software Technologies
26
