
PPG and EMG Based Emotion Recognition using Convolutional Neural
Network
Min Seop Lee
1
, Ye Ri Cho
1
, Yun Kyu Lee
1
, Dong Sung Pae
1
, Myo Taeg Lim
1
and Tae Koo Kang
2a
1
School of Electrical Engineering, Korea University, Seoul, Republic of Korea
2
Department of Human Intelligence and Robot Engineering, Sangmyung University, Cheonan, Republic of Korea
Keywords:
Valence, Arousal, Convolutional Neural Network, Physiological Signal, PPG, EMG.
Abstract:
Emotion recognition is an essential part of human computer interaction and there are many sources for emotion
recognition. In this study, physiological signals, especially electromyogram (EMG) and photoplethysmogram
(PPG) are used to detect the emotion. To classify emotions in more detail, the existing method of modeling
emotion which represents the emotion as valence and arousal is subdivided by four levels. Convolutional
Neural network (CNN) is adopted for feature extraction and emotion classification. We measure the EMG and
PPG signals from 30 subjects using selected 32 videos. Our method is evaluated by what we acquired from
participants.
1 INTRODUCTION
Emotion based research has affected many fields in
modern society (Hudlicka, 2003). Many recent stud-
ies have considered human conditions, such as hu-
man emotions (Cowie et al., 2001). Emotions can
be recognized in various ways, including facial ex-
pressions, voice, and physiological signals. Emotion
which is represented by facial expressions can be hid-
den through the poker-face (Anagnostopoulos et al.,
2015; Kim, 2017). Recent advances in emotional
recognition technology used a number of physiolog-
ical sensors to measure feelings (Yin et al., 2017).
Biometric signal based emotional awareness has been
applied to systems, therefore, the current thesis also
adopted biometric based emotion recognition meth-
ods.
Physiological signals for recognizing emotions
typically include electroencephalography (EEG), res-
piration (RSP), electromyography (EMG), photo-
plethysmography (PPG), and galvanic skin response
(GSR) sensors. EEG measures the voltage fluctua-
tions in the brain and RSP is the signal about breath-
ing. EMG measures the muscle tension of its activ-
ity or stress, and PPG measures the amount of blood
flowing through vessels (Lee et al., 2011). GSR is the
property of the human body that causes continuous
a
Corresponding author: Tae Koo Kang (Tel:+82-41-
550-5355, E-mail: tkkang@smu.ac.kr
variation in the electrical characteristics of the skin
(Wu et al., 2010).
EEG signals have been used by many recent stud-
ies of emotion recognition. To extract features, hand-
crafted features which are composed of statistical fea-
tures were selected in the initial research (Alarcao and
Fonseca, 2017). After Deep learning method evolv-
ing, machine learning and deep learning algorithm
are used in various research (Tabar and Halici, 2016;
Zhang et al., 2017). However, it is not efficient to use
EEG signal because it needs 32 channels for emotion
classification which means we have to obtain 32 kinds
of physiological signals. Therefore, we selected EMG
and PPG signal for emotion recognition and acquired
these signals for 30 subjects.
Current emotion awareness is based on two emo-
tional models which are the method of modeling emo-
tions. The first method is based the six basic feel-
ings of happiness, sadness, surprise, fear, anger, and
disgust (An et al., 2017). The second method is
based on two parameters of arousal and valence (Peng
et al., 2018). Rather than classifying six emotions, the
arousal and valence model is more frequently used
and we selected this method. Previous studies have
been used two level classification of arousal and va-
lence which means valence values can be classified
as high valence or low valence. However, this two
level classification is simple, and we proposed 4 level
classification from PPG and EMG signals using CNN
model.
Lee, M., Cho, Y., Lee, Y., Pae, D., Lim, M. and Kang, T.
PPG and EMG Based Emotion Recognition using Convolutional Neural Network.
DOI: 10.5220/0007797005950600
In Proceedings of the 16th International Conference on Informatics in Control, Automation and Robotics (ICINCO 2019), pages 595-600
ISBN: 978-989-758-380-3
Copyright
c
2019 by SCITEPRESS – Science and Technology Publications, Lda. All rights reserved
595

Figure 1: Arousal and valence model.
We recorded PPG and EMG signal from 32 par-
ticipants using video clips depending on the emo-
tion. Videos were selected through the survey about
whether it stimulates emotions. Then, PPG and EMG
signal were preprocessed and segmented for making
input data. Feature extraction and classification was
conducted using the CNN approach.
The rest of paper is organized as follows. Section
2 provides fundamental theories related the arousal
and valence model. Section 3 proposes the method
of data collection and feature extraction method us-
ing CNN model. Section 4 describes the experiment
of 4 level classification with obtained signals. Finally,
conclusion is explained in section 5.
2 AROUSAL AND VALENCE
MODEL
As mentioned before, multiple parameters are used to
label emotions. The most representative parameters
are arousal and valence which are based on Russel’s
circumplex theory (Russell, 1980). Arousal repre-
sents activation level and valence expresses the degree
of pleasantness. As Figure 1, emotions can be repre-
sented in two-dimensional space and each parameters
has a value between 1 and 9. For example, joy has
high valence and high arousal, whereas sad has low
valence and low arousal. Through these parameters,
it is possible to express the stage of emotion.
Typically, emotion classification is conducted by
binary-classification of valence and arousal value. In
this case, emotion can be divided by threshold value
of 5. Therefore, we proposed the 4 level classifica-
tion of arousal and valence to express more detailed
emotion.
3 EMOTION RECOGNITION
SYSTEM
In this section, we introduce the total system of emo-
tion recognition. The overall architecture is shown in
Figure 2. First, we collected physiological signal us-
ing video clips. After that, we preprocessed to use
the signal as an input of deep learning. Finally, we
classified emotion by training CNN model.
In section 3.1, data collection method with video
stimuli is explained. Subdivision emotion model is
mentioned in section 3.2. After that, preprocessing
method is in section 3.3 and feature extraction and
classification model with CNN is covered in section
3.4.
3.1 Data Collection
We used the EMG and PPG signal for emotion recog-
nition. To collect these signal, we utilized the physio-
logic recorder (P400, PhysioLab Inc.) to record EMG
and PPG signals (phy, ). The P400 measures various
signals, including bioelectrical and physiological sig-
nals. It can measure six measurement modules simul-
taneously from four channels. We used the base mod-
ule to connect physiological sensors. Table 1 shows
the P400 base module characteristics and specifica-
tions. Additional sensors can be connected to the
module to acquire other biological signals. A finger-
tip pulse oximeter sensor is connected for recording
PPG signal and it illuminates the skin and measures
the blood changing in the finger. Electrode patch is
attached in the back of both shoulders for EMG sig-
nal. Figure 3 shows recorded signals.
Data collecting participants are composed of 30
people with different ages between 20 and 30. Each
participants watched 16 videos which were prese-
lected for visual stimuli. One emotion elicitation
video was shown to a subject on a single day in the
quite room. For minimizing the noise, subjects re-
mained motionless when recording the signal.
For emotion detection, emotion stimulus is re-
quired to trigger emotions. Previous studies have se-
lected various stimuli, including photos, videos, and
music. Videos were used for stimuli in DECAF stud-
Figure 2: Emotion recognition architecture.
ICINCO 2019 - 16th International Conference on Informatics in Control, Automation and Robotics
596
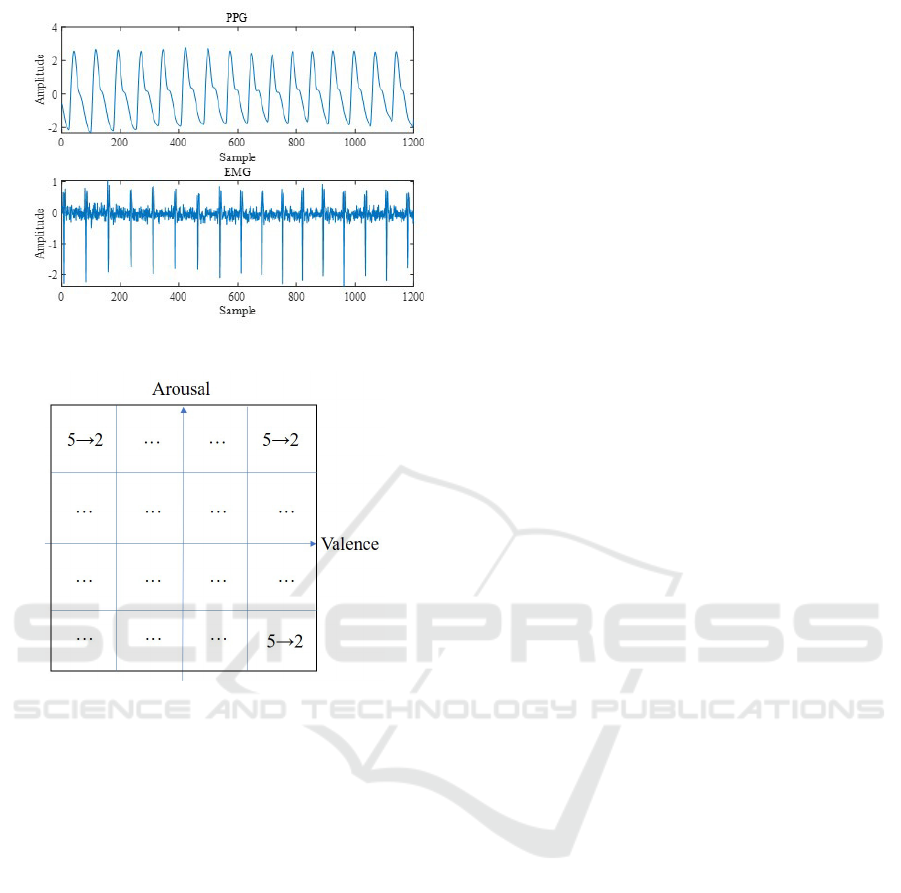
Figure 3: PPG and EMG signals.
Figure 4: The total video number after video selection.
ies (Donahue et al., 2014). Music and photography
can evoke emotions through sight and hearing, re-
spectively (Wang and Huang, 2014). Triggering emo-
tion from images without sounds or images is not as
efficient as using both simultaneously which means
we chose the video for emotion stimulus.
We selected video to use hearing and seeing as
a stimulus for recording physiological signal. The
video was selected from subject as a survey on the age
between 20 to 30. A total of 30 people were surveyed
and participated in an experiment. We prepared the
total 80 videos which means 5 videos for each section
(4 level of arousal and valence) as shown in Figure
4. After viewing 80 5-minute videos, participants se-
lected the suitable 2 videos for each section. As a
result, we selected a total of 32 videos based on the
highest scoring of surveying. Physiological signals
were measured for the selected videos.
3.2 Subdivision Emotion Model
We propose a 4 level emotional classification based
on the arousal-valence emotion model described in
the prior section. Russell’s emotion model expressed
emotion using the arousal and valence variates, which
can be divided into four quadrants. Most of research
conducted binary classification of arousal and va-
lence, for example, high valence or low valence. This
method cannot accurately represent the emotion, so
we divided the arousal and valence as 4 levels (very
high, high, low, very low). Figure 5 describes the 4
levels of arousal and valence. Arousal and valence are
divided by 4 classes according to the threshold values
(3, 5, and 7).
3.3 Preprocessing
To induce emotion, videos are used for the stimuli in
this research. We obtained EMG and PPG signals for
30 subjects. There were 32 videos for participants and
each video was 5 minutes long. Sampling rate was
128Hz and signals were passed through a high-pass
filter to eliminate the noise.
For making dataset, we segmented the EMG and
PPG signals as Figure 6. We found the peak point
of PPG signal and made an input data with a length
of 1000 samples. Based on first PPG peak point,
we found the nearest peak of EMG signal which is
marked as yellow circle in Figure 6. As a result, red
line implies the PPG input and the green line means
the EMG input for neural network. Another peak
point of PPG signal after 1000 samples is the next
input’s peak point.
To use these signals at the same time, we concate-
nated these two signals. PPG signals are attached first
and EMG signals are attached later with totally 2000
samples. As green line of EMG signal was not longer
than 1000 samples, the blank parts are filled with ze-
ros.
3.4 Four-level Classification with CNN
CNN model can be designed depending on the appli-
cation. The proposed emotion recognition model uses
the CNN architecture to extract features represent-
ing emotional characteristics. Previous studies have
highlighted that at least two CNN layers are required
to reliably extract physiological signal characteristics.
Therefore, we applied only two convolutional layers
since the input length is not long.
Figure 7 shows the detail of CNN model architec-
ture. Input for the CNN is created by concatenating
PPG and EMG signal. CNN parameters including the
number of convolution filters, their size, and the stride
size are important for the great performance. Larger
number of filters will enable more diverse character-
istics to be learned. Therefore, we employed 32 filters
PPG and EMG Based Emotion Recognition using Convolutional Neural Network
597
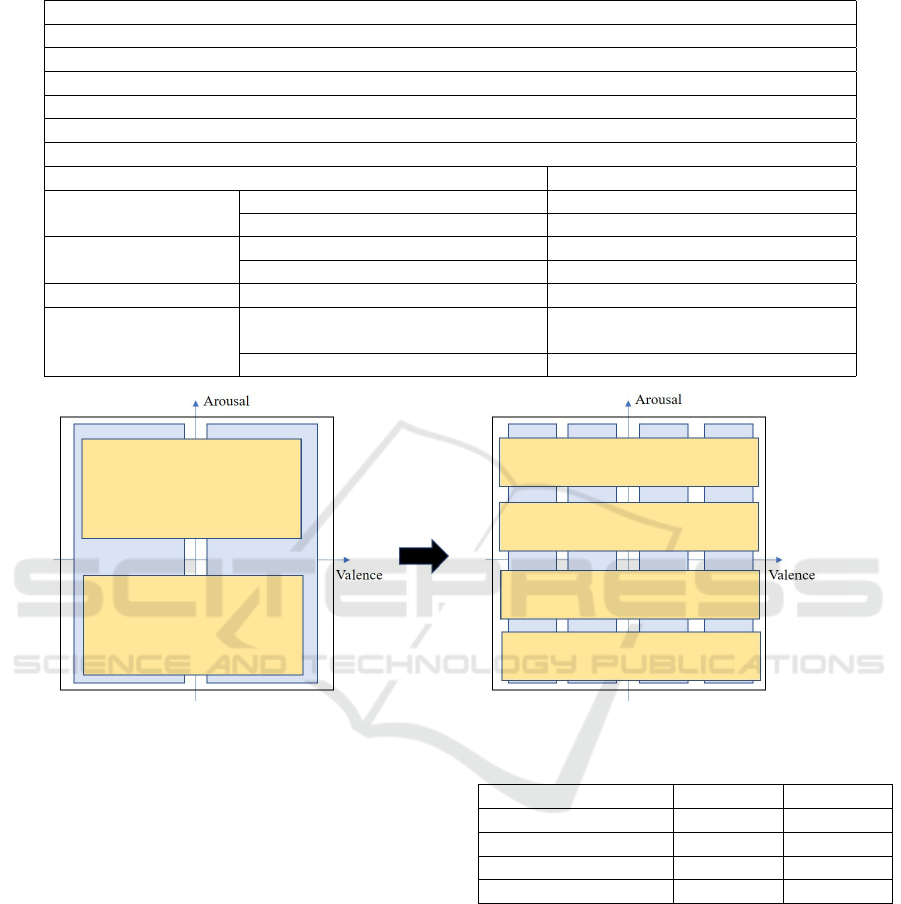
Table 1: P400 base module characteristics and specifications.
Characteristics
4-Channel physiological input (Bio, ECG, PPG, Bridge)
Up to 2000 sample rate for each channel
12bit resolution
Four physiologic measurement modules for configuration
Plug-in connector
Direct PC connection to monitoring the analysis
Category Specification
Number of input channels 4- Channel
Input signal Input voltage range Module: 2.5V; input signal: 5V
Sampling rate Maximum 2000 SPS
Output signal ADC resolution 12 bit
Communication Communication method USB 1.1 (12 Mbps)
Power supply
Input:80–240V AC; Output:12V
DC
Voltage / Current 12V / 2A
Figure 5: Four-level arousal and valence model.
for the first convolution layer and 64 for the second.
Filter size was 3 × 1 for all layers and stride was set
to 1. Relu layers were used for non-linearity with two
subsequent max-pooling layers. After extracting fea-
tures, we used the softmax function for classification.
As mentioned before, classes are composed of 4 level
for valence and arousal.
4 EXPERIMENTAL RESULT
4.1 Experimental Environment
We measured signals from sensors directly for each
participant, and created the required dataset. The
number of total dataset for each class is 7200 and we
used 80% dataset for training data and 20% dataset
for test data. Table 2 represents the dataset.
Convolution and max-pooling filter sizes were set
to the optimum value from training, assessed by com-
Table 2: Training and test dataset.
Training Test
Arousal 1 / Valence 1 5760 1440
Arousal 2 / Valence 2 5760 1440
Arousal 3 / Valence 3 5760 1440
Arousal 4 / Valence 4 5760 1440
paring performance. It is critical to avoid overwriting
when training the model. We used a dropout layer
with dropout rate = 0.5 that learned through neural
networks which omits some neurons for training. For
training, we set max epochs = 100, initial learning rate
= 0.001, and mini batch size = 64, and used relu as the
activation function.
4.2 Result for Accuracy
This section describes experimental results using the
obtained dataset. We used a CNN model to clas-
sify the four-level emotions of valence and arousal,
ICINCO 2019 - 16th International Conference on Informatics in Control, Automation and Robotics
598
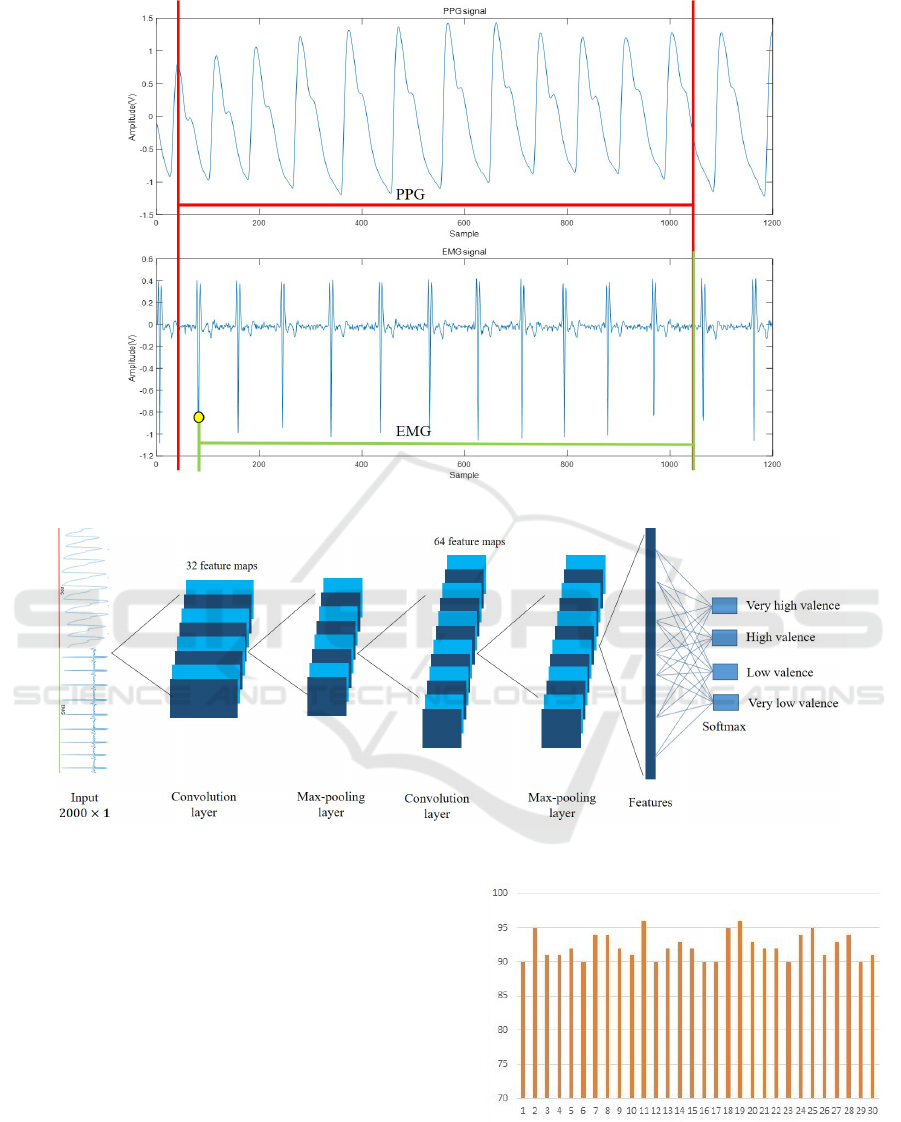
Figure 6: The segmentation of PPG and EMG signal.
Figure 7: The CNN architecture.
whereas conventional arousal-valence models catego-
rize two stage arousal-Valence model. It implies that
we can detect 16 emotions by mixing 4 levels of va-
lence and arousal. Figure 8 shows the accuracy of
experiment. Individual accuracy ranged from 90 to
96% and the overall accuracy is 83%. Individual re-
sult was conducted by training individual dataset and
overall accuracy was performed by training overall
dataset. We compare our method with artificial neural
network (ANN). ANN method used a neural network
with hand-crafted features (Yoo et al., 2018). They
extracted hand-crafted features from 5 physiological
signals based on statistical approaches. We applied
it to our dataset. The ANN method had 75.3% accu-
racies which implied our algorithm had better perfor-
mance than comparative method.
Figure 8: The individual result.
PPG and EMG Based Emotion Recognition using Convolutional Neural Network
599

5 CONCLUSIONS
This paper introduced an emotion recognition method
by using PPG and EMG signals. In order to classify
the detailed emotion, we subdivided the valence and
arousal as 4 levels, whereas the existing method of
dividing emotion was 2 levels. For the experiment,
we obtained own dataset by extracting from 30 sub-
jects using video clips. We adopted CNN architecture
for extracting features of signals and classifying the
valence and arousal. To use the PPG and EMG sig-
nal as an input of deep learning, we segmented and
concatenated them. The proposed method identified
individual and overall result with 90 to 96% and 83%
accuracies respectively.
REFERENCES
www.physiolab.co.kr.
Ahonen, T., Hadid, A., and Pietikainen, M. (2006). Face
description with local binary patterns: Application to
face recognition. IEEE Transactions on Pattern Anal-
ysis & Machine Intelligence, (12):2037–2041.
Alarcao, S. M. and Fonseca, M. J. (2017). Emotions recog-
nition using eeg signals: A survey. IEEE Transactions
on Affective Computing.
An, S., Ji, L.-J., Marks, M., and Zhang, Z. (2017). Two sides
of emotion: exploring positivity and negativity in six
basic emotions across cultures. Frontiers in psychol-
ogy, 8:610.
Anagnostopoulos, C.-N., Iliou, T., and Giannoukos, I.
(2015). Features and classifiers for emotion recog-
nition from speech: a survey from 2000 to 2011. Ar-
tificial Intelligence Review, 43(2):155–177.
Cowie, R., Douglas-Cowie, E., Tsapatsoulis, N., Votsis,
G., Kollias, S., Fellenz, W., and Taylor, J. G. (2001).
Emotion recognition in human-computer interaction.
IEEE Signal processing magazine, 18(1):32–80.
Donahue, J., Jia, Y., Vinyals, O., Hoffman, J., Zhang, N.,
Tzeng, E., and Darrell, T. (2014). Decaf: A deep con-
volutional activation feature for generic visual recog-
nition. In International conference on machine learn-
ing, pages 647–655.
Hudlicka, E. (2003). To feel or not to feel: The role of affect
in human–computer interaction. International journal
of human-computer studies, 59(1-2):1–32.
Kim, W.-G. (2017). Emotional speaker recognition us-
ing emotional adaptation. CHONGI HAKHOE NON-
MUNJI, 66(7):1105–1110.
Lee, Y.-K., Kwon, O.-W., Shin, H. S., Jo, J., and Lee, Y.
(2011). Noise reduction of ppg signals using a par-
ticle filter for robust emotion recognition. In Con-
sumer Electronics-Berlin (ICCE-Berlin), 2011 IEEE
International Conference on, pages 202–205. IEEE.
Peng, S., Zhang, L., Ban, Y., Fang, M., and Winkler, S.
(2018). A deep network for arousal-valence emotion
prediction with acoustic-visual cues. arXiv preprint
arXiv:1805.00638.
Russell, J. A. (1980). A circumplex model of affect. Journal
of personality and social psychology, 39(6):1161.
Seyeditabari, A., Tabari, N., and Zadrozny, W. (2018).
Emotion detection in text: a review. arXiv preprint
arXiv:1806.00674.
Tabar, Y. R. and Halici, U. (2016). A novel deep learning
approach for classification of eeg motor imagery sig-
nals. Journal of neural engineering, 14(1):016003.
Wang, H.-M. and Huang, S.-C. (2014). Musical rhythms af-
fect heart rate variability: Algorithm and models. Ad-
vances in Electrical Engineering, 2014.
Wu, G., Liu, G., and Hao, M. (2010). The analysis of
emotion recognition from gsr based on pso. In Intel-
ligence Information Processing and Trusted Comput-
ing (IPTC), 2010 International Symposium on, pages
360–363. IEEE.
Yin, Z., Zhao, M., Wang, Y., Yang, J., and Zhang, J.
(2017). Recognition of emotions using multimodal
physiological signals and an ensemble deep learn-
ing model. Computer methods and programs in
biomedicine, 140:93–110.
Yoo, G., Seo, S., Hong, S., and Kim, H. (2018). Emo-
tion extraction based on multi bio-signal using back-
propagation neural network. Multimedia Tools and
Applications, 77(4):4925–4937.
Zhang, D., Yao, L., Zhang, X., Wang, S., Chen, W.,
and Boots, R. (2017). Eeg-based intention recogni-
tion from spatio-temporal representations via cascade
and parallel convolutional recurrent neural networks.
arXiv preprint arXiv:1708.06578.
ICINCO 2019 - 16th International Conference on Informatics in Control, Automation and Robotics
600
