
Bus Regularity Evaluation using the Gini Index and the Lorenz
Curve: A Case Study of New Delhi Bus Network
Amine Melakhsou
1
and Neila Bhouri
2
1
University of Le Havre, 25 Rue Philippe Lebon, 76600 Le Havre, France
2
Université Paris-Est, IFSTTAR/COSYS/GRETTIA, F-77447 Marne la Vallée, Cedex 2, France
Keywords: Gini Index, Headway Regularity, Travel Time Regularity, Correlation Coefficient, Data Reconstitution.
Abstract: The ability of a public transport system to provide regular services is the main attraction for the system
users. Assessing the regularity of the provided services from the user’s perspective is thus crucial for
stakeholders in order to establish actions for maintaining or improving their system reliability level and
therefore increasing the number of the public transport users. The purpose of this paper is to reveal the
pertinence of the Gini Index based on the Lorenz curve as headway and travel time regularity indicator and
to carry out a case study of the reliability of a bus operator of the city of New Delhi. We began by
reconstituting the missed data in the provided automatic vehicle location data using an approximate
approach and then, using correlation coefficients, we studied the linear relationships, before and after data
reconstruction, between Gini Index and some of the most used regularity measures; headway regularity,
headway adherence, standard deviation and travel time variability. Results show that headway adherence
and standard deviation are the two indicators that have the higher correlations with the Gini index and that
Gini index is less influenced by missing data and errors.
1 INTRODUCTION
The literature is rich with indicators for public
transport reliability measurement but most of the
highly used ones are usually unsatisfactory for
service regularity measures of high-frequency buses
and are not immediately understandable for
inexperienced stakeholders (Bhouri, 2016) and do
not permit the comprehension of the entire issue.
Moreover, the existing indicators cannot be used to
compare between different routes, which is
important for the stakeholders in order to perceive
the ones in which more investments could be made.
This paper aims to study the relevance of the
Gini index (GI) as both headway regularity and
travel time regularity measures respecting both
user’s and operator’s perspectives. For the headway
regularity, we used GI based on the ratio between
actual and scheduled headways in order to evaluate
the adherence to the scheduled timetables. Unlike
the previously reported measures, GI can be used to
compare different routes in term of regularity and
the associated Lorenz curve, which is the graphical
representation of the distribution of the chosen
criterion of GI, is a handy tool for revealing more
information about the causes of irregularity that a
numerical value cannot provide.
For this purpose, a correlation study is
investigated between GI and previously reported
indicators including headway regularity (HR),
headway adherence (HA), standard deviation (STD)
and travel time variability (TTV). A bus system of
the city of New Delhi as a case study is selected to
evaluate correlations and to study related reliability
level of the operation. However, the provided
Automatic vehicle location (AVL) data presents
missing data which can lead to wrong conclusions.
To overcome this issue, an approximate data
reconstitution had been realized.
Finally, the correlation results are encouraging
for the use of GI as a versatile reliability measure
and helped to show that it is less affected by the
missing data and errors.
The paper is structured as follows; section 2
gives a literature review of the transport regularity
indicators with a spotlight on papers proposing new
ones, and a literature review of the use of the Gini
index in the transport domain. In section 3 we define
the used methods. In section 4 we analyze
correlation results and study the reliability of the bus
system of New Delhi and lastly, section 5 provides
conclusions and perspectives.
Melakhsou, A. and Bhouri, N.
Bus Regularity Evaluation using the Gini Index and the Lorenz Curve: A Case Study of New Delhi Bus Network.
DOI: 10.5220/0007795705690577
In Proceedings of the 5th International Conference on Vehicle Technology and Intelligent Transport Systems (VEHITS 2019), pages 569-577
ISBN: 978-989-758-374-2
Copyright
c
2019 by SCITEPRESS – Science and Technology Publications, Lda. All rights reserved
569

2 LITERATURE REVIEW
2.1 Literature Review on Transport
Indicators
There are a considerable number of researches
dealing with indicators that are used in the public
transport regularity. (Gittens, 2015) give definitions
and brief evaluations of 20 indicators sorted by their
function (Travel time indicators, schedule adherence
indicators, headway regularity indicators and wait
time indicators). The paper takes interest in whether
an indicator is “traveler-oriented” or not. According
to (Gittens, 2015) the preferred indicators to use by
bus operators are the percentage of buses running on
time and excess waiting time. The authors also
proposed a new composite indicator named Journey
Time Buffer Indicator “JTBI”. (Currie, 2012) review
nine reliability indicators and give a comparison
between them in terms of ease of understanding,
accuracy measure, agency comparability and cost-
efficiency, and give an overall rank for each one of
them. (Trompet, 2011) benchmark 12 international
bus benchmarking group (IBBG) bus operators with
four regularity indicators and list the advantages and
disadvantages of each one of the indicators
regarding the ease of communication, objectivity,
customer representation and the nature of inputs.
(Eboli, 2011) develop a methodology that
implements the objective (quantitative) and
subjective (results of surveys) aspects of an indicator
by implementing them to a single composite one.
The final indicator is obtained by solving an
optimization problem. The methodology has been
tested in a case study for several types of indicators,
among others, timetable adherence indicators. (De
Ona, 2016) suggest a remodeling of this
methodology by improving the optimization
formulation and by the use of cluster analyses (CA)
for the surveys.
(Jensen, 2014) review six types of timetable
reliability indicators used in railways and compare
them in terms of the information provided, the
applicability domain (lines, stations, aggregated) and
the necessary inputs for each one. In order to
evaluate indicators robustness, a comparison
between results of microscopic simulation and the
ones of the indicators has been carried out in this
study. (Fan, 2016) propose an indicator named The
Reported Waiting Time which predicts the waiting
time sensed by a traveler, this indicator allows bus
operators to better understand the concept of waiting
time from the customer’s point of view.
(Teng, 2015) propose a new formulation of bus
running indicator (BRI) based on bus planning travel
time (BPTT) which is also proposed by authors.
The existing indicators are however
unsatisfactory for high-frequency bus services
(Bhouri, 2016) and can’t answer the questions that a
transit manager would ask, such as: how regular a
bus route is? Among different routes, which one is
the most regular? What are the causes of
irregularity? The answers to these questions can be
given by the GI which gives an easy-understanding
and interpretable value even for inexperienced
stakeholders, and since it is a normalized measure it
can be used to compare different routes. In addition,
the associated Lorenz curve helps to extract more
information of the causes of irregularity.
2.2 Background on the Gini Index in
the Transport Field
The Gini index (also called the Gini ratio or the Gini
coefficient) is a measure of statistical distribution
introduced by the Italian statistician and sociologist
Gini Corridor; it is used to represent the income
distribution of a country’s residents.
Although it is used originally in economics, Gini
index had been used in other fields to measure
inequality; In the transport sector, we find a good
number of papers using GI; (Delbosc, 2011) adapted
the Gini index and Lorenz curve to assess public
transport horizontal equity (Horizontal equity means
that all population must have equal transit service
regardless to the variability of transit needs within
population groups.) for Australian city Melbourne.
Departing from this study (Delbosc, 2011) use
also the index to measure horizontal equity for
another Australian city and compares the results
with ones obtained from Melbourne, (Ricciardi,
2015) also compares the public transport vertical
equity, using Gini index, between 3 vulnerable
groups: elderly residents, no-income households,
and no-car households. (Delbosc, 2011) state that the
existing measures of transit equity may be complex
and not expressed by a single value; the use of GI in
this subject is thus interesting because it yields an
easy-understanding single value. GI has been largely
used in the evaluation of public transport equity, in
addition to these articles readers are referred to
(Jang, 2017) and (Pavkova, 2015).
To the best of our knowledge, there are only three
articles that use the GI for regularity evaluation:
(Lee, 2017) propose the use of GI as an evaluation
of travel time in order to assess its evenness among
road users. GI is calculated in a case study of roads
VEHITS 2019 - 5th International Conference on Vehicle Technology and Intelligent Transport Systems
570
in Korea and is compared with standard deviation,
speed, buffer time and buffer index to evaluate the
significance of this measure; results show that the
Buffer index has the higher positive correlation with
the GI in this study.
(Henderson, 1991) assess headway regularity
using GI. Along with wait time indicator, headway
regularity based on GI was applied for several bus
routes of New York City and Manhattan before
being tested on a huge number of sets of random
headways in order to study their behaviors and rate
of change. (Bhouri, 2016) evaluate the adherence of
actual headways to the scheduled headways by
applying GI on the distribution of the ratio actual
headway to scheduled headway. Regularity is one of
the most important and relevant measures of public
transport reliability, regularity consists in that
successive vehicles depart, pass and arrive at a
predefined point with predefined time intervals and
with equal headways (Rudnicki, 1997). Regularity
accordingly means, in a perfect case, delivering a
service with equal waiting times and travel times for
all the riders.
3 METHOD
3.1 Formulation of the Gini Index as
Headway and Travel Time
Regularity Indicator
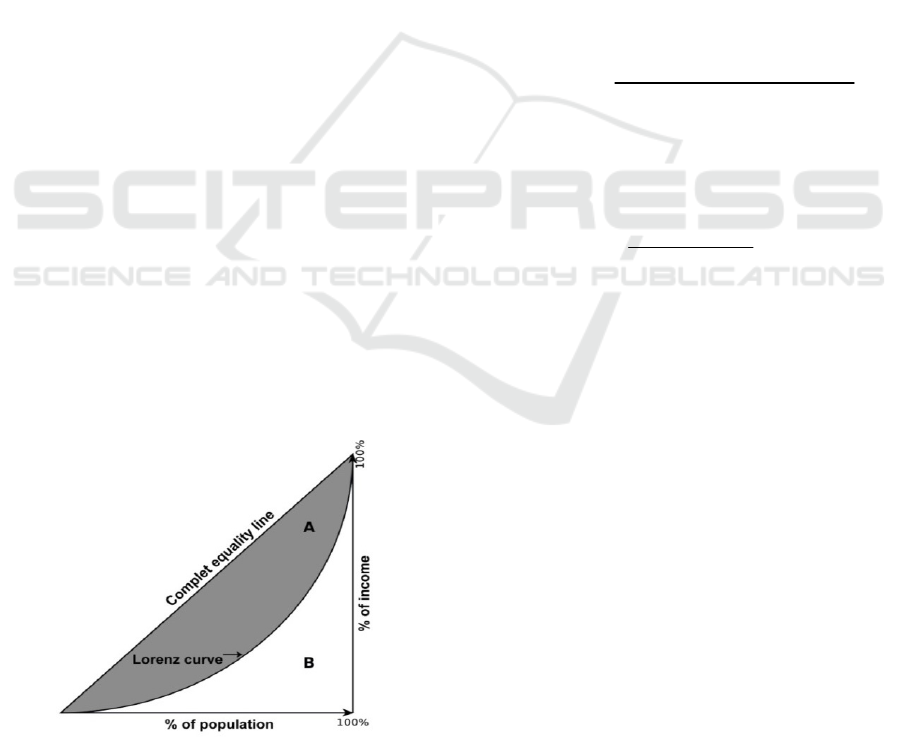
GI is based on the Lorenz curve (figure 1), it varies
from 0 to 1 with 0 indicating absolute equality and 1
indicating complete non-equality. The GI value
corresponds to the area of the shaded surface on the
Lorenz illustration.
Figure 1: The Lorenz curve.
In our study we calculate the Gini value using
trapezoids formula given by (1):
()()
11
1
1
k
n
k
kkk
YGXIXY
−
=
−
−=− −
(1)
Where n is the number of observations, X
k
is the
k
th
percentile of the cumulative proportion of the
population and Y
k
is the k
th
percentile of the
cumulative proportion of the income. The population
in our case is the number of the trips, and the
incomes are either the cumulative ratios actual to
scheduled headways when dealing with headway
regularity, or the cumulative travel times when
dealing with travel time regularity. The Gini index is
already a normalized measure but since we apply it
for a ratio between two variables (when dealing with
headway regularity), each ratio must be
renormalized in order to compare between different
bus routes as given by the formula:
()
()
-
_1
actual headway scheduled headway
New Rat i o a
scheduled headway
=+
(2)
With this modification, a same delay (say 5
minutes) has the same effect on the ratio (thus on the
Gini index) for lines with different frequencies.
*
*
=
Nmin Rline
Nline Rmin
α
(3)
Where Nline is the number of intervals for the
studied line, Rline is the timetable range of the
studied line Nmin and Rmin refer to the number of
intervals and the timetable range of the line “min”
such that Nmin /Rmin is the minimum of the
quantities Nline/Rline, whatever the line (this
implies α ≤1 ).
This leads to a new Gini index (related to α)
named N_GI
3.2 Correlation Coefficient
The correlation coefficient between two measures is
a dimensionless value which varies from -1 to 1; it
determines the degree and the direction of the linear
relationship between their movements. 1 indicates
total positive correlation while -1 indicates total
negative correlation, a correlation coefficient equal
to 0 means that the two measures are not linearly
related. The more it approaches 1 or -1 the stronger
the measures are related. We use the correlation
coefficient to compare the relations between the Gini
index and each of the presented indicators and see
Bus Regularity Evaluation using the Gini Index and the Lorenz Curve: A Case Study of New Delhi Bus Network
571
how they change in order to better understand the
behaviors of the Gini index.
3.3 Regularity Indicators
We present in what follows the highly used
indicators that will be adopted for our study.
3.3.1 Standard Deviation
The standard deviation is a statistical measure of the
dispersion of a dataset from its average.
3.3.2 Headways Adherence
HA is defined as the standard deviation of the
observed headways from the scheduled ones divided
by the average scheduled headways as given by the
formula:
()
2
1
1
1
n
i
N
i
AH M
N
SH
H
N
A
−
=
(4)
Where AH is the actual headway, SH is the
scheduled headway and M is the mean actual
headways.
3.3.3 Headway Regularity
HR has been used by the New York transit authority
(Cramer, 2009), it provides the percentage of trips
having acceptable headways.
Since we will be using GI based on the ratio
R=(Actual Headway)/(Scheduled Headway), we
adapted HR to compute the number of trips with
acceptable ratios.
Moreover, we don’t know whether a ratio is
acceptable or not, we propose then another
formulation of HR using a confidence interval which
is given by:
Number of trips having a ratio CI
100
Number of all trips
HR ×=
∈
(5)
Where CI is the confidence interval with a length
of 6 sigmas:
];3[3
nn
CI x x
σσ
−× ×=+
(6)
Where
is the ideal case, i.e. when the actual
headway is equal to the scheduled one, which yields
to
=R
ideal
=1. When a ratio R
i
belongs to the CI, the
trip i is considered as having an acceptable ratio. is
the standard deviation of the ratios of a given set and
n is the number of the trips.
3.3.4 Travel Time Variability
Also known as buffer index, it is defined as the extra
time a traveler should add to arrive on time 95% of
the time.
95TT MTT
M
TT
TTV
−
=
(7)
Where TT
95
is the 95
th
percentile of the travel
time and MTT is the mean travel time.
3.4 AVL and Missed Data
Reconstitution Methodology
The main problem with the provided data is that we
do not have the time of a bus passage at all the stops;
these lost data cause discords between actual and
scheduled headways which lead to distorted
headways ratios. To overcome this issue and make
reliable conclusions, we added the missing data with
an approximate reconstitution method which utilizes
the distance between stops and the speed of the bus;
the approach consists, for a given missing, in adding
the amount of time T
i
=Distance
i
/Speed
i
to the
previous detected time, if it exists, if there is no
previous detected time we subtract the amount from
the posterior detected time and then from the added
time and so on until refilling all gaps. It is important
to mention that we might get some incoherencies
due to using the mean speed in the absence of
information on the real speed of a bus; in this case,
the reconstituted time is deleted to avoid
reproducing false data.
Our study is limited to 8 routes of the New Delhi
bus operator consisting of 4 high-frequency and 4
low-frequency routes, within the 30 days of
September 2016.
As mentioned, due to the number of missed data
that would distort the results, the reconstitution
model is applied to provide more accurate reliability
measurement.
We acquired 30 files of AVL data (each one
corresponding to a bus line for a day of September
2016) for all the routes stops that include actual and
scheduled times along with actual and scheduled
speed. We also got provided with a file that contains
data for only the departure stop and the terminus for
all the routes. These data are used to give a first
VEHITS 2019 - 5th International Conference on Vehicle Technology and Intelligent Transport Systems
572
overview of correlations between GI and the other
indicators and also is used for the comparison
between the routes. Information on bus routes is
given in table 1.
Table 1: Information on the bus lines.
Length
(frequency)
Route N° Average
Scheduled
Headway
(minute)
Average
Observed
Headway
(minute)
Short
(Low)
403CLUP 23.3 31.05
403CLDOWN 24.46 33.28
Long
(Low)
185UP 32.75 51.67
185DOWN 32.94 44.34
Short
(High)
507CLUP 18.51 24.03
507CLDOWN 18.3 22.82
Long
(High)
165UP 11.67 15.44
165DOWN 11.75 16.91
4 RESULTS
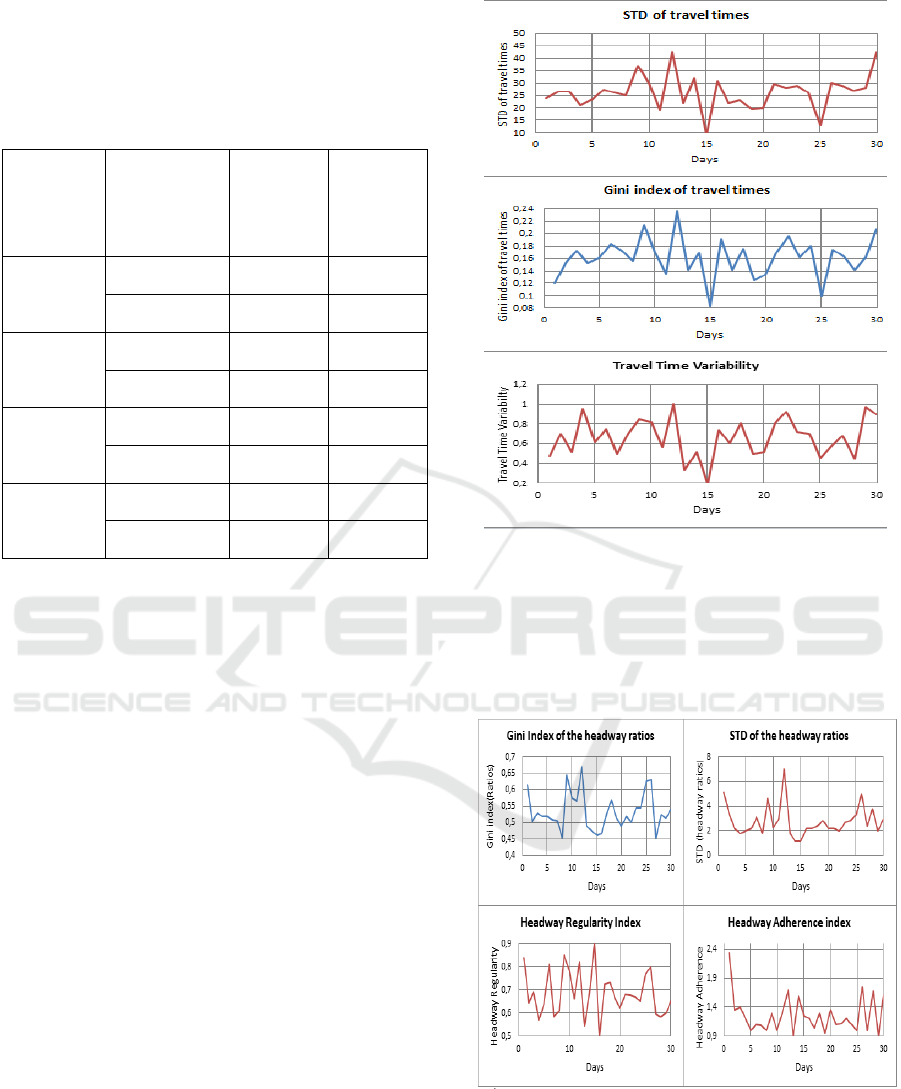
In this section, we show the graphs of the different
indicators drawn for the route N° 403CLUP before
presenting and discussing the correlations results
between GI and the other measures.
At the end of the section, we study the reliability
of the bus services of the city.
4.1 A Visual Comparison between Gini
and the Regularity Indicators
To have a first look on the behaviors of the
indicators, we draw their charts for the bus route N°
403CLUP within the 30 days, figure 2 shows the
graph of GI as a travel time indicator with the graphs
of STD of travel times and TTV while figure 3
shows the graph of GI for the headway ratios along
with the other headway regularity indicators.
We can notice from a first sight that GI concurs
more with the indicators of travel times and that it
has higher similarity with STD of travel times than
with the STD of headway ratios which demonstrates
already that resemblance between two given
indicators is not always the same.
Figure 2: Graphs of travel time regularity indicators for
the bus route 403CLUP within 30 days.
To better understand the relationships between
GI and the other measures; we use the correlation
coefficient because it is more efficient and faster
than the visual inspection of the charts.
Figure 3: Graphs of headway regularity indicators for the
bus route 403CLUP within the 30 days.
Bus Regularity Evaluation using the Gini Index and the Lorenz Curve: A Case Study of New Delhi Bus Network
573
4.2 Correlation Coefficients between
Gini and the Other Regularity
Indicators
Table 2 show the correlation coefficients obtained
for all the bus routes between GI and the used
indicators.
One can notice from table 2 that STD has the
higher correlation coefficients with GI; this is
expected since GI is based on STD, we also notice
that GI presents a good correlation with TTV and
HR which is encouraging for using the indicator for
both headway and travel time regularity but, it is
important to mention that these correlation results
would variate according to the nature of the data; in
fact, in a set of data which contains values that are
largely deviated from the mean, STD and TTV are
highly influenced by these values (LEE, 2017),
especially TTV because it takes into account only
the deviance of the 95
th
percentile from the mean ,
hence it shows larger deviations, while GI would
assess the reliability from the perspective of
evenness and may not show the same behavior as
STD and TTV, correlation would be less good in
this case while it would be excellent in the opposite
case.
In order to show the influence of data
characteristics on correlation, we compare the
correlation coefficient between GI and STD before
and after the data reconstitution for the bus route N°
165DOWN, figure 4 gives the correlation coefficient
values and the charts of GI and STD for day 1 before
and after.
We notice that correlations have increased from
0.84831 before reconstitution to 0.95621 after; this
is due to the fact that when adding the missing data
for this day we actually decreased the relative ‘huge
variations’ as figure 4 shows; before reconstitution
(the left side of the figure) there are a considerable
number of values that have large deflections from
the average which influenced the correlation
coefficient negatively, after the reconstitution the
data show fewer variations which clarify the
increment of correlation between GI and STD.
We also catch from figure 4 that GI is able to
detect huge variations but without amplifying them
unlike STD and TTV (TTV amplifies the variations
more since it computes the deviation between the
95
th
percentile and the mean, while STD computes
the average deviation from the mean.) which leads to
conclude that GI is less influenced by variations
caused by the errors and misses in data, in fact, the
correlation coefficient between STD before and after
is 0.3536 whilst the correlation coefficient between
GI before and after is 0.6379.
Table 2: correlation coefficients between GI and the other
indicators for all the bus lines.
Gini (Ratios) STD HR HA
Low-frequency routes
403CLUP 0.8076 0.6083
0.4251
403CLDOWN 0.7624 0.5368
0.6157
185UP 0.7240 0.5873
0.4049
185DOWN 0.7626 0.6448
0.5593
High-frequency routes
507CLUP 0.7730 0.6511
0.2909
507CLDOWN 0.7115 0.6860
0.3826
165UP 0.8188 0.6962
0.4617
165DOWN
0.7179 0.6454
0.5182
Gini
(Travel times)
STD
(Travel
times)
TTV
Low-frequency routes
403CLUP 0.9017 0.7322
403CLDOWN 0.9070 0.7825
185UP 0.9364 0.7617
185DOWN 0.9126 0.6221
High-frequency routes
507CLUP 0.9550 0.7445
507CLDOWN 0.9375 0.6179
165UP 0.9425 0.6259
165DOWN 0.9679 0.5932
If we draw the GINI index for all the buses at
once, before and after data reestablishment, we
would notice that GI values do not stir much, as
figure 5 shows.
Although for day 1, 526 missed data is
reconstituted (21.11% of the data) and 312 for day
26 (12.53 %), the curves before and after are not
very different and the Gini values are barely
changing, we noticed also that when drawing the
Lorenz curve for each stop separately the Gini
values still change slightly which enhances the
hypothesis of the ability of GI to provide a reliable
measurement, despite the data errors and misses.
VEHITS 2019 - 5th International Conference on Vehicle Technology and Intelligent Transport Systems
574
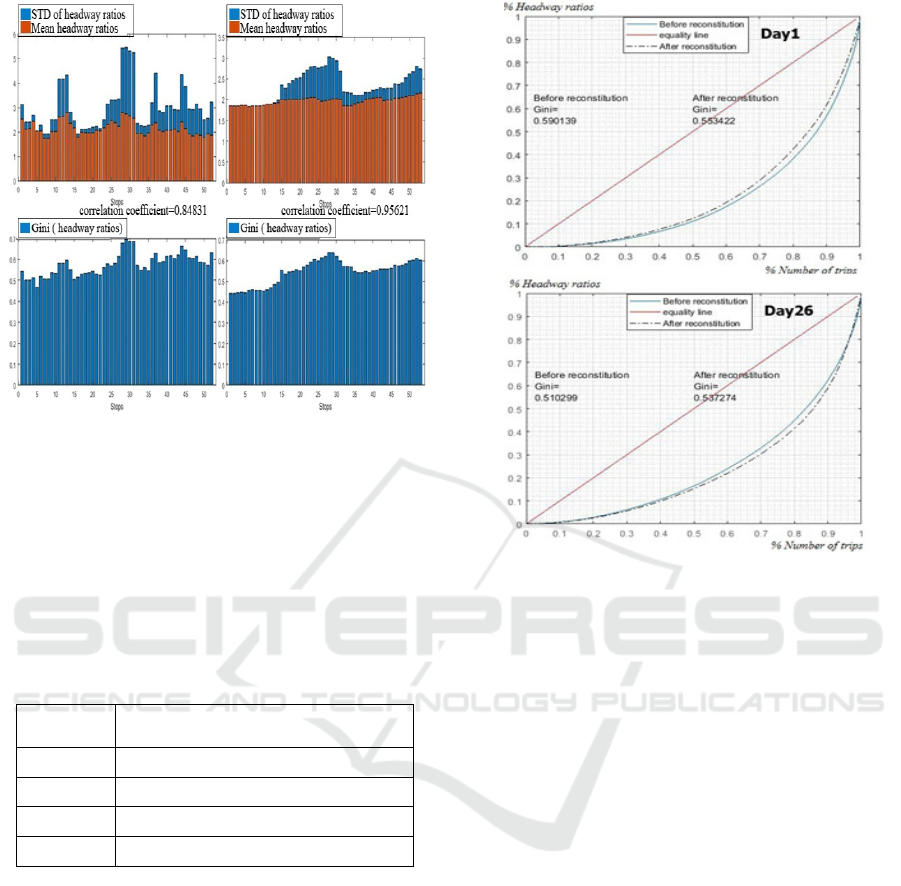
Figure 4: Correlation before (left) and after data
reconstitution.
After the data reconstitution, GI shows really
excellent correlations with HA, which means that
using GI based on the ratio actual to scheduled
headways is capable of assessing the adherence to
the planned timetable; table 3 shows the results for
data for several days.
Table 3: Correlation between GI and HA after data
reconstitution.
Day Correlation coefficient (GI, HA)
2 0.9514
5 0.9566
11 0.9767
26 0.8848
The poor correlations which were obtained
before reconstitution are surely caused by the
incoherence in the initial data. As to correlations
between GI and Headway Regularity, the observed
criterion that influences the correlation is the length
of the confidence interval, for some datasets; giving
a larger CI leads to better correlations. (The data is
not normally distributed thus, the characteristics of
CI are not the ones defined for the normal
distributions).
Finally, like any other indicator, GI has its
unique vision of regularity which is the evenness of
the distribution of the chosen criterion, it offers a
new point of view of the reliability of the public
transport. As the correlation study outcomes show,
GI agrees with the other indicators under some
Figure 5: Lorenz curve for all the stops before and after
data reconstitution.
conditions, outside these conditions it behaves
differently, this is not to be seen as a failure, on the
contrary, it shows another perspective from which a
bus operator can see the reliability.
In the next section, we discuss the results of the
case study of the reliability of the bus operator of
New Delhi and show the utility of the Lorenz
illustration.
4.3 Reliability of the Bus Services of
New Delhi
As a reminder, GI is a value between 0 and 1, the
value 0 indicates perfect equality while 1 indicates the
non-equality of the distribution. In what follows we
show and discuss results for the bus line 165DOWN
using the new data. Figure 6 shows the Lorenz curves
drawn for the ratio actual to scheduled headways for
the 1
st
and the 26
th
September. For the first day, GI
values show that the first 14 stops are more regular
than the rest, that’s why we see their curves approach-
ing more to the perfect equality line, in the rest of the
stops there are more bus bunches (the left side of the
curves are more parallel to the horizontal axe) and
more buses with headways that largely deviate from
the scheduled ones, shown by the higher discards of
the curves from the equality line at the right side.
Bus Regularity Evaluation using the Gini Index and the Lorenz Curve: A Case Study of New Delhi Bus Network
575
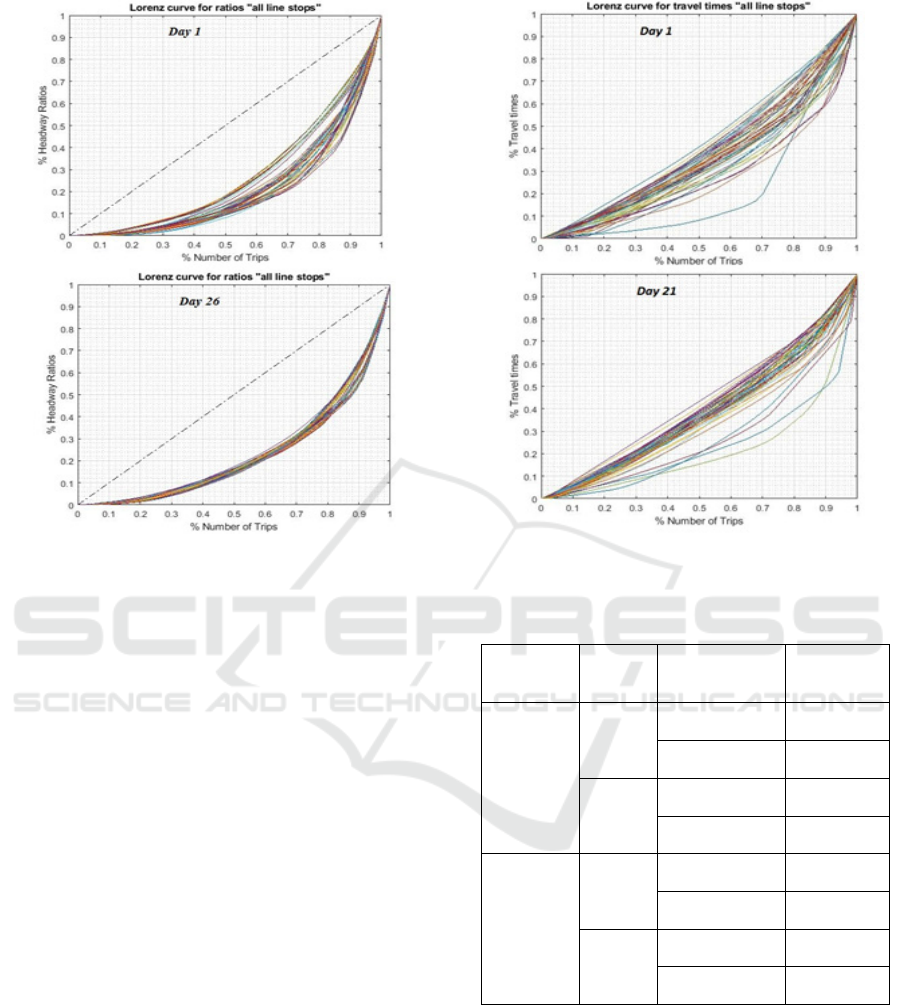
Figure 6: Lorenz curves for all 53 stops separately
(headway ratios).
For the day 26, the stops are showing
approximately the same behavior, the mean GI and
HA of this day are 0.5345 and 1.5175 which reveals
the irregularity of the service due to bus bunching
and disrespect to the scheduled timetable.
As an overall conclusion, the bus service for this
route within the month of September is not so decent
and suffers from bus bunching, which also leads to
the appearance of large intervals, and deviations
from the scheduled timetable, in addition, we
noticed that the number of performed trips varies
remarkably from a day to another which also is a
real cause of unreliability.
In terms of travel time regularity, the bus
operator seems to provide a correct service as can be
seen in figure 7, we can see that most of the curves
are near the equality line, but one particular curve
deviates highly for all the days, it is the road
between the stops “Libas pur GT ROAD “and
“Sanjay Ghandi Transport Nagar”, which is, in fact,
a highway highly influenced by traffic, otherwise for
the rest of the trips, most of the users are provided
with approximately equal travel times. In order to
compare the bus routes in term of headway
adherence, we apply the N_GI that was defined in
the methodology section by equation (2). Table 4
gives the mean N_GI values for all the studied bus
routes of the city of New Delhi.
Figure 7: Lorenz curves drawn for travel times for day 1
and day 21.
Table 4: Normalized Gini values for all bus routes.
Frequency Length Routes
Mean
N_GI
Low
Short 403CLUP 0.4752
403CLDOWN 0.4713
Long 185UP 0.4927
185DOWN 0.5103
High
Short 507CLUP 0.4841
507CLDOWN 0.5146
Long 165UP 0.5226
165DOWN 0.5215
The values of the N_GI on table 4 show that
most of the low-frequency routes are the more
regular, which is normal as the high-frequency
routes are harder to manage, also we notice that the
short length routes are more reliable comparing the
high length routes, in addition, the GI values are all
near 0.5 which indicates a mediocre service for all
the routes in terms of headway adherence.
VEHITS 2019 - 5th International Conference on Vehicle Technology and Intelligent Transport Systems
576

5 CONCLUSION
For the public transportation, regularity of the travel
times and the respect to the scheduled timetables are
the essential qualities that appeal the users,
nevertheless, deviating from the planned program
and from the expected travel time are inevitable.
Assessing the irregularities from the user’s
perspective is necessary for stakeholders in order to
establish actions for maintaining or improving their
system reliability level and to attract more users. In
this paper, we highlighted the relevance of the Gini
index based on the Lorenz curve as an indicator of
the adherence of actual headways to the pre-
established ones and as a travel time regularity
indicator, by showing its relationship with some of
the most used indicators: headways adherence,
headway regularity, standard deviation and travel
time variability.
Results show that headway adherence and
standard deviation are the two indicators that have
the higher correlations with the Gini index. We
noticed also that GI remains approximately stable
before and after data reconstitution and do not show
huge differences unlike the other used indicators,
which permitted to judge this indicator as less
affected by errors and misses in data. After revealing
the effectiveness of the presented measure, we
studied and discussed the reliability of the bus
services of the city using GI and the Lorenz curve.
The results of this study show that the services are
irregular in terms of headway adherence but on the
other hand, the users are provided by regular trips in
terms of travel time. An extension of our study
would be to develop a better data reconstitution
method, compare the Gini index with other
indicators and using other methods of comparison to
emphasize the relevance of the Gini index.
REFERENCES
Bhouri, Neila, Aron, Maurice, et Scemama, Gérard. Gini
Index for Evaluating Bus Reliability Performances for
Operators and Riders. In: Transportation Research
Board. 2016. p. 13p.
Gittens, Antonio et Shalaby, Amer. Evaluation of bus
reliability measures and development of a new
composite indicator. Transportation Research Record:
Journal of the Transportation Research Board, 2015,
no 2533, p. 91-99.
Currie, Graham, Douglas, N. J., et Kearns, Ian. An
assessment of alternative bus reliability indicators. In
Australasian Transport Research Forum. 2012.
Trompet, Mark, Liu, Xiang, et Graham, Daniel.
Development of key performance indicator to compare
regularity of service between urban bus operators.
Transportation Research Record: Journal of the
Transportation Research Board, 2011, no 2216, p. 33-
41.
Eboli, Laura et Mazzulla, Gabriella. A methodology for
evaluating transit service quality based on subjective
and objective measures from the passenger’s point of
view. Transport Policy, 2011, vol. 18, no 1, p.172-
181.
De Ona, Juan, De Oña, Rocio, Diez-Mesa, Francisco, et al.
A composite index for evaluating transit service
quality across different user profiles. Journal of Public
Transportation, 2016, vol. 19, no 2, p. 8.
Jensen, Lars Wittrup, Landex, Alex, et Nielsen, Otto
Anker. Evaluation of robustness indicators using
railway operation simulation. Computers in Railways
XIV: Railway Engineering Design and Optimization,
2014, vol. 135, p. 329.
Fan, Yingling, Guthrie, Andrew, et Levinson, David.
Waiting time perceptions at transit stops and stations:
Effects of basic amenities, gender, and security.
Transportation Research Part A: Policy and Practice,
2016, vol. 88, p. 251-264.
Teng, Jing et Lai, Xiong-Fei. A calculation method for bus
running index. In: Proceedings of the transportation
research board annual meeting, Washington, DC.
2015. p. 11-15.
Delbosc, Alexa et Currie, Graham. Using Lorenz curves to
assess public transport equity. Journal of Transport
Geography, 2011, vol. 19, no 6, p. 1252-1259.
Ricciardi, Anthony Michael, Xia, Jianhong Cecilia, et
Currie, Graham. Exploring public transport equity
between separate disadvantaged cohorts: a case study
in Perth, Australia. Journal of transport geography,
2015, vol. 43, p. 111-122.
Jang, Seongman, An, Youngsoo, Yi, Changhyo, et al.
Assessing the spatial equity of Seoul’s public
transportation using the Gini coefficient based on its
accessibility. International Journal of Urban Sciences,
2017, vol. 21, no 1, p. 91-107.
Pavkova, Katerina, Currie, Graham, Delbosc, Alexa, et al.
A New Approach to Exploring the Operational
Performance of Public Transport Links, the case of
Melbourne, Australia.
Lee, Soong-Bong, Lee, Seongkwan Mark, et Lee, Ki-
Young. A Gini coefficient based evaluation on the
reliability of travel time forecasting. Journal of King
Saud University-Engineering Sciences, 2017.
Henderson, Gary, Kwong, Philip, et Adkins, Heba.
Regularity indices for evaluating transit performance.
Transportation Research Record, 1991, vol.1297, p.3-9.
Rudnicki, Andrzej. Measures of regularity and punctuality
in public transport operation. IFAC Proceedings
Volumes, 1997, vol. 30, no 8, p. 661-666.
Cramer, A., Cucarese, J., Tran, M., Lu, A., Reddy, A.
(2009) Performance measurements on mass transit:
Case study of New York City Transit Authority.
Transportation Research Record: Journal of the
Transportation Research Board 2111, 125-138.
Bus Regularity Evaluation using the Gini Index and the Lorenz Curve: A Case Study of New Delhi Bus Network
577
