
Automated Attribute Inference for IoT Data Visualization Service
Orathai Sangpetch
1,2
, Akkarit Sangpetch
1,2
, Jittinat Nartnorakij
1,2
and Narawan Vejprasitthikul
1
1
Department of Computer Engineering, Faculty of Engineering, King Mongkut’s Institute of Technology Ladkrabang,
1 Soi Chalongkrung, Ladkrabang, Bangkok, Thailand
2
CMKL University, 1 Soi Chalongkrung, Ladkrabang, Bangkok, Thailand
Keywords: Data Exchange, API, Interoperability, Machine Learning, Visualization.
Abstract: As data becomes vital to urban development of modern cities, Thailand has initiated a smart city project on
pilot cities around the country. We have implemented an interoperable data platform for smart city to enable
Internet of Things (IoT) data exchanges among organizations through APIs. One of the key success is that
people can access and visual the data. However, data can have various attributes since standard has not
completely established and adopted. Therefore, it is difficult to automate the process to achieve
comprehensive visualization. Traditionally, we require developers to manually examine data streams to
determine which data attribute should be presented. This process can be very time consuming. The
visualization system must be manually updated whenever a source stream modifies its data attributes. This
problem becomes an impediment to implement a scalable cloud-based visualization service. To mitigate this
challenge, we propose an automated attribute inference approach to automatically select key visualizable
attribute from heterogeneous streams of data sources. We have experimented with different data attribute
selection algorithms, namely an empirical rule-based system and the chosen machine learning algorithms. We
implement and evaluate the proposed selection algorithms through our 3D visualization program in order to
get the feedback from users.
1 INTRODUCTION
In the last decade, development of embedded system
and sensors has thrived in an unimaginable pace due
to the growing demand of Internet-of-Things (IoT)
market around the world. According to the Forbes
prediction (Columbus, 2018), IoT market will reach
about $520B in 2021, more than double the $235B
spent in 2017 with influence of cloud service
providers offering IoT services. Given the fast-
growing demand, IoT devices and sensors become
smaller in size and much cheaper, making more
attractive to general consumers and even
organizations to adopt.
For example, organizations and individuals start
embrace various sensors in their surrounding
environment for 24/7 monitoring, providing to real-
time feedback to adjust resource usage ubiquitously,
e.g. AC/heat control and electricity consumption.
Several Thai government agencies have utilized
sensors and embedded system to perform real-time
monitoring and managing public resources; for
example, sensors to measure water level, water
quality and air quality have been deployed throughout
the country, especially in pilot cities.
With strong IoT demand, many sensor
frameworks and platforms have emerged, although
they might not be fully compatible due to lack of
standard. This can lead to difficulty in data exchange
from different systems for cross-data-analytics. To
mitigate such difficulty, we have created a data
exchange platform for smart city
(https://developers.smartcity.kmitl.io/) to facilitate
data exchange between different systems, including
data visualization. The data exchange platform was
designed with micro-service architecture and the
graph-based access control management to achieve
scalability (Sangpetch, 2017). Data can come from
legacy systems, which rely on file transfer, to
proprietary systems, which may or may not have data
APIs. Even worse, when users need to browse
through different available data sources in order to
select data streams to use or verify the continuity of
data, it is very challenging to access data in the
original formats. To alleviate such challenge, we
present a data visualization service in order to easily
comprehend data in demand.
Sangpetch, O., Sangpetch, A., Nartnorakij, J. and Vejprasitthikul, N.
Automated Attribute Inference for IoT Data Visualization Service.
DOI: 10.5220/0007767105350542
In Proceedings of the 9th International Conference on Cloud Computing and Services Science (CLOSER 2019), pages 535-542
ISBN: 978-989-758-365-0
Copyright
c
2019 by SCITEPRESS – Science and Technology Publications, Lda. All rights reserved
535

In order to create the data visualization service on
cloud, we have to overcome the challenges in
different data sources (i.e. various sensors and
devices), data formats and attributes. Normally, a data
stream from a sensor can contain many data
attributes; however, we cannot present all attributes
on screen without overwhelming users. Traditionally,
users or developers need to understand each data
attribute and carefully select a few attributes to
represent such a data stream. Seeing current data
points easily is crucial for users or developers to
ensure that their system is still working properly.
According to our study on data APIs of IoT
devices or sensors (refer to Section 3, many data APIs
come with many data attributes and several attributes
are quite static, e.g. description, label and no data.
Giving the current manual process of identifying a
key data attribute, this becomes a great impediment to
scalability and productivity. The situation becomes
worse with the rise of sensors / IoT devices
deployment due to many more data streams to deal
with.
To reduce the manual process involved in
determining a key data attribute for each data API, we
propose an automated key attribute selection system
to automatically examine a data stream and identify
which data attributes should be presented. We have
tried different approaches for the core algorithm of
our automated key attribute selection, namely our
rule-based algorithm and the machine learning
algorithms, including Decision Tree (Quinlan, 1986),
Naïve Bayes (Russell, 2003) and K Nearest Neighbor
(KNN) (Altman, 1992). According to the evaluation
results, KNN yields the highest accuracy, 87.15%,
while the rule-based algorithm performs the worst,
83.90%. To demonstrate our proposed automated
system, we implement a visualization to display the
value of the selected key data attribute for users to
easily verify our key-data selection.
This paper is organized as follows. Section 2
discusses the related works. Our survey study on
different data APIs is described in Section 3. Section
4 describes our proposed automated key attribute
selection system. Section 5 focuses on the proposed
attribute selection algorithms which are our rule-
based algorithm and the selected machine learning
algorithms. The evaluation results of the different
decision-making algorithms are demonstrated and
discussed in Section 6. We conclude in Section 7.
2 RELATED WORK
There have been multiple approaches to resolve the
interoperability issues from heterogeneous
information systems. The issues have been
investigated in database and data engineering where
various schemas from different systems have to be
consolidated and matched. Similarity flooding
(Melnik, 2002) technique has been proposed to
identify matching data elements based on graph
structure of exchange objects. Linguistic feature
(Shiang, 2008) can also be used to simplify the
exchange object structure before trying to match. The
approaches focused more on mapping between a few
complex objects whereas our experiments are geared
toward identifying common key attributes which can
be used for visualization across a wide range of
sources.
Previous approaches tend to resolve the issue of
heterogeneous data based on identifying common
schema. The resolution could be done manually by
specifying domain-specific mapping between
document schemas (Yu, 2010), (Zhang, 2010),
building common metadata dictionary (Xu, 2011), or
allowing user-defined rule for mapping (Tan, 2011).
Our approach utilizes both metadata dictionary to
define common data type and apply rule-based and
machine learning approach to identify common
schema.
When considering the context of IoT and Smart
City data, researchers has utilized map-based
interface (Noguchi, 2008) to organize urban
information exchange and defining relationships
between persons, places, and information. Users can
share semantically related information through urban
memories system. Our approach also identifies spatial
information in the data in order to provide potential
label mapping from different data sources.
3 STUDY ON APIS OF IOT
DEVICES AND SENSORS
As mentioned earlier, there is yet no single data
standard for IoT devices and sensors. Hypothetically,
it is possible that every API may have its own data
attribute names and structure with potentially some
congruity. In order to verify our hypothesis, we
survey 97 available data APIs of IoT devices and
sensors so that we can examine the data attribute and
data structure of each API to determine commonality
and variety among them. The learning and
observations from the study should help us define
CLOSER 2019 - 9th International Conference on Cloud Computing and Services Science
536

rules to identify a key data attribute or select an
appropriate algorithm.
From the selected data APIs, 79 of them (81.44%)
carry raw data from IoT devices or sensors and 18 of
them (18.56%) transmit processed data, i.e. the data
has been processed and analyzed. The selected data
APIs belong to different countries, such as Singapore,
China, UK, Spain, USA and Thailand. The list of the
selected data APIs is shown in Table 1. Note that the
APIs listed below exist as of April 2018. All APIs
come from different domains, e.g. weather
stations/sensors, transportations, and so on, as
illustrated in Table 2.
Table 1: Examples of selected APIs in our study.
API Names Reference Websites for APIs
1. Geoname.org:
Postal code search
http://www.geonames.org/export/w
eb-services.html
2. Wunderground.com:
Severe alert
https://www.wunderground.com/we
ather/API/d/docs?d=data/alerts&M
R=1
3. Travelpayouts.com:
Hotels location
https://support.travelpayouts.com/h
c/en-us/articles/115000343268-
Hotels-data-API
4. Wefeelfine.org:
Sentimental
http://wefeelfine.org/API.html
5. Walkscore.com: Near
bus stops
https://www.walkscore.com/profess
ional/public-transit-
API.php#search_stops
6. Ura.gov.sg: Car park
availability
https://www.ura.gov.sg/maps/ura/ur
a_dataservice/samples/Car_Park_A
vailability.txt
7. Aqicn.org: Air quality
http://aqicn.org/json-API/doc/#API-
City_Feed-GetCityFeed
8. Freegeoip.net: Search
location from IP
https://freegeoip.net/?q=49.49.242.2
21
9. Citybik.es: City bikes http://API.citybik.es/v2/
10. Aerisweather.com:
Currently active alerts
https://www.aerisweather.com/supp
ort/docs/API/reference/endpoints/ad
visories/
11. Openweathermap.org:
Weather data
https://openweathermap.org/current
12. Weather.mg: Air
quality
https://API.weather.mg/API-detail-
pages/air-quality-parameter.html
13. 511ny.org: Cameras
https://511ny.org/developers/help/A
PI/get-API-getcameras_Key_format
14. TransportAPI.com:
Journey plan
https://developer.transportAPI.com/
docs?raml=https://transportAPI.co
m/v3/raml/transportAPI.raml#/uk_c
ar_journey_from_from_to_to_json#
uk_cycle_journey_from_from_to_t
o_json
15. Ip2location.com:
Location from IP
https://www.ip2location.com/web-
service
16. Readthedocs.io: Noise
level
http://fiware-
datamodels.readthedocs.io/en/latest/
Environment/NoiseLevelObserved/
doc/spec/index.html
17. Noaa.gov: Noaa
stations
https://www.ncdc.noaa.gov/cdo-
web/webservices/v2#stations
API Names Reference Websites for APIs
18. Yahoo.com: Wind
https://developer.yahoo.com/weathe
r/
19. Breezometer.com: Air
quality
https://breezometer.com/air-quality-
API/
20. Data.gov.sg: Car park
https://data.gov.sg/dataset/carpark-
availability
21. Data.cityofnewyork.us:
Recycling Bins
https://dev.socrata.com/foundry/dat
a.cityofnewyork.us/ggvk-gyea
22.
Transport.opendata.com:
Connections
https://transport.opendata.ch/docs.ht
ml
23. Data.cityofchicago.org:
Crimes
https://dev.socrata.com/foundry/dat
a.cityofchicago.org/6zsd-86xi
24. Data.cityofnewyork.us:
Harbor Water Quality
https://dev.socrata.com/foundry/dat
a.cityofnewyork.us/peb4-ivfn
25. Dallasopendata.com:
Garbage
https://dev.socrata.com/foundry/ww
w.dallasopendata.com/eqhe-99hc
26. Propellerhealth.com:
Forecast
https://www.propellerhealth.com/air
-by-propeller/
27. OpenDataPhilly.org:
Rain Gauges
https://www.opendataphilly.org/dat
aset/rain-gauges
28. Smartcitystructure.
com: Carbon sensor
https://www.smartcitystructure.com
/API/v1/environment/things/58b5a4
d1f4d5fd84057b23e3/telemetries?a
ccess_token=lDzl1qr0n4KUcUlR6s
C4fKcj07lMM0KvN4GniUkl&sort
=id%2C-
createdAt&page=0&perpage=1
29. Smartcity.kmitl.io:
Sentimental
https://API.smartcity.kmitl.io/API/v
1/sentimental/predicted
Table 2: Categories of the data APIs selected in our study.
Data API Categories Data API Categories
Weather and environment 35
Real estate 19
Transportation 18
Location and places 16
Healthcare 11
Internet of Things (IoT) 4
Social media 3
Energy 1
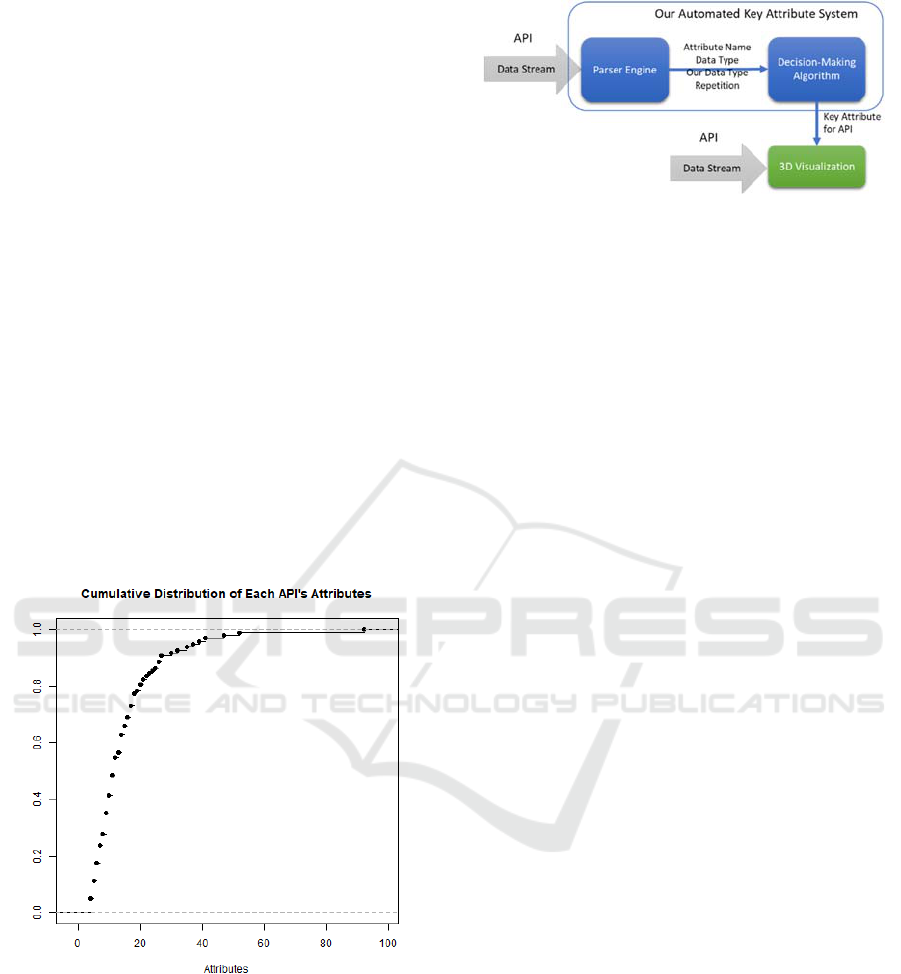
As illustrated in Figure 1, only 11.34% of the
selected APIs have less than or equal to 5 attributes
and 35.05% of the APIs have less than 10 attributes.
This means 64.95% of the APIs have 10 or more
attributes. We also found that 20.59% of the APIs
have more than 20 data attributes and a few APIs have
as many as 40-90 attributes. According to our study,
many data APIs have too many data attributes,
making difficult to go through data attributes
manually. From our observations, each API has one
or two data attributes that carry key values of the API.
Hence, if we can automatically discover a key
attribute of each API, it would help us check whether
an API is still working, not stalling.
Automated Attribute Inference for IoT Data Visualization Service
537
Additionally, 73.13% of the APIs’ the key
attribute have string type, while 18.06%, 8.37% and
0.44% of the key attributes have int, float and
Boolean types respectively. 17.53% of the APIs have
no float, integer or Boolean attributes. These findings
suggest that a key attribute can come in different
types and the majority is not even a number. From the
collected data APIs, there are APIs that use words
(string type) to indicate a quality level, for examples
good, bad, low, medium and high.
4 PROPOSED AUTOMATED
ATTRIBUTE SELECTION
SYSTEM
In this paper, we propose an automated system to
automatically process the data stream sent through an
API and then identify its key attribute. As
demonstrated in Figure 2, our system consists of two
primary components, namely 1) the parser engine,
and 2) the decision-making algorithm, which is
essential to identify a key attribute correctly, referred
to Section V for details.
Figure 1: The CDF graph of the attribute number of each
selected API in our study.
For the parser engine, it is responsible for parsing
data attributes and determining the type of attributes
as well as counting the frequency of the same attribute
path found in one data API response. The data input
format for the parse engine is in JSON format.
According to our study in Section 3, we found that the
JSON data types (i.e. integer, float, Boolean and
string) are not adequate to imply a meaning of an
Figure 2: The overview of our proposed automated system
for identifying a key attribute of an API.
attribute, thereby difficult to gauge the attribute
significance. From our study, many attributes of the
collected APIs have string type but only a text or
string that indicates a quality level tends to be a key
attribute. Otherwise, they are just descriptions or
annotations. As a result, we introduce our metadata
types to help us understand the meaning of each
attribute. Our metadata types are defined as follows;
1. Geo-location: Pinpoint a geographical location.
There are one or more data attributes representing
a coordinate pair or latitude/longitude numbers,
e.g. “latitude: 13.7458, longitude: 100.5343”,
“coordinates: 13.7458,100.5254”
2. Timestamp: Indicate the time.
Examples are "05/01/2009 14:57:32.8" and "1
May 2008 2:57:32.8 PM".
3. Number: Represent numeric value
Examples are 120 and 34.456.
4. Ranking: Indicate a level of quality or quantity.
Examples are good, bad, low, medium, high,
moderate and normal.
5. Nominal value: Miscellaneous texts
Any texts that do not implicate ranking, such as
description or annotation.
The parser assigns a path to each attribute. Path is
defined as a hierarchy of an attribute access
embedded in a data response. After an attribute is
mapped with one of our metadata types, the parser
engine also counts the number of times that the same
attribute path appears in one data API response, called
“repetition”. For example, if data is { “status”:“ok”,
"data":[ { “value”: 1.0 }, { “value”: 2.0 } ],
“desc”:“my value” }, then the repetition of
“data/value” is 2. Attributes with high repetition
values are likely candidates to be used as data sources
for visualization.
Then, the parser engine will send the information
of each attribute, namely an attribute name, a
programming data type, metadata type and repetition,
to the decision-making algorithm, as shown in Figure
2. In the decision-making stage, one of the algorithms
proposed in Section V will determine a key attribute
CLOSER 2019 - 9th International Conference on Cloud Computing and Services Science
538

for a given API. Then, the key attribute output will
become an input to our 3D visualization which
displays the value stream of the key attribute to
developers automatically.
We implement the parser engine and the 3D
visualization with C# on Unity. We also use WRLD
in our 3D visualization to help populate 3D objects.
Our 3D visualization will automatically query the
latest value of the key attribute and display it in a
proper format. For example, if a key attribute also
comes with a geo-location, our 3D visualization will
display the value at the given location. A screenshot
sample of our 3D visualization is illustrated in Figure
3. Our automated key attribute selection system and
our 3D visualization together can help developers
reduce time to go through data and check the value
stream manually in order to see whether a data API is
still working properly.
Figure 3: A screenshot sample of our 3D visualization,
displaying the crowd density in the Bangkok downtown
area in three levels: high, medium and low levels.
5 KEY ATTRIBUTE SELECTION
ALGORITHMS
A key attribute selection algorithm is the heart of
our automated system. The accuracy of predicting a
key data attribute using the information sent from the
parser engine, is essential. In this work, we evaluate
four different approaches to identify key data attribute
from API responses. For our purpose of constructing
visualization engine from multiple APIs, we need to
identify key data attributes whose values match
metadata type number, ranking, and nominal values.
Note that the geo-location and timestamp as these
values are often used to plot against the key data
attribute. For example, the geo-location information
will be used to identify the location of the key data
attribute in the map. The timestamp will be used as
the x-axis of a chart plotted against the key data
attribute.
5.1 Rule-based Algorithm
We create our rule-based algorithm where the rules
encompass the observations and insights we have
learned from the study in Section III. Based on the
observed APIs, we have manually tagged and
identified key data attribute from the responses. The
rule-based algorithm has been formulated based on
the statistical result of occurrence of the key data
attribute names and type of manually tagged attribute.
From our available data API, we have identified the
priority and name of the key data attributes as shown
in Table 3.
Table 3: Names of key data attributes, ranked by
occurrences of manually-tagged key data attributes.
Priority Ranking Number Nominal
1 status index description (s)
2 condition (s) main details
3 level value text
4 result (s) total alerts
5 label average, avg message (s)
6 - normal -
7 - speed -
The result from Table 3 suggests that most API
providers adopt a similar naming strategy for key data
attributes. Our rule-based algorithm identifies the key
data attribute by first extracting a pair of the attribute
name and its metadata type from the API responses.
We then try to match the extracted pair with another
pair of attribute name and metadata type in the
priority table. If the pair matches, then we identify the
attribute as a key data attribute.
The pseudo code of our rule-based algorithm is
show below;
5.2 Machine Learning-based Approach
For machine learning-based approach, we use 4
different features as the input for machine learning-
based approach: 1) attribute name 2) JSON data type
3) metadata type and 4) repetition value of the
attribute.
We utilize Weka for running machine learning
algorithms to identify key data attributes. The
attribute name features are translated to word vectors
using bag of words approach. JSON and metadata
type are assigned nominal value for different data
type. There are 4 JSON data types (string, boolean,
float, int) and 5 metadata types (Geolocation,
timestamp, number, ranking, nominal) used as values
for the features.
The goal of the classifier is to classify whether the
given attribute is a key data attribute. We have
Automated Attribute Inference for IoT Data Visualization Service
539
experimented with three different binary classifiers
including Decision Tree, K-Nearest Neighbor and
Naïve-Bayes.
5.2.1 Decision Tree
We utilize Weka J48 class which uses C4.5 algorithm
[14] to create statistical classifier decision trees from
the training data set. The labelled data set has been
tagged to classify whether the attribute is a key data
attribute.
5.2.2 Naïve Bayes
We also experiment with Naïve Bayes using the
provided training data set. Naïve Bayes classifier
considers each of the input features independently to
the probability that the given attribute is a key data
attribute.
5.2.3 K-Nearest Neighbor (KNN)
K-Nearest Neighbor is used to identify the closest
training examples to the attribute in feature spaces.
This is an instance-based learning approach. Due to
the similarity of many observed attributes, we set k =
1 which means finding the closest training instance.
6 EVALUATION
The objective of the evaluation is to measure how
accurately each algorithm can identify a key attribute.
The algorithms that we would like to compare are our
rule-based algorithm and three machine learning
algorithms; namely Decision Tree, Naïve Bayes and
K-Nearest Neighbor (KNN). The details of the
algorithms are described in Section 5. We define the
following terms;
• A true positive (TP) as a key attribute that is
correctly classified as a key attribute.
• A true negative (TN) as a non-key attribute that is
correctly identified as a non-key attribute.
• A false positive (FP) as a non-key attribute that is
incorrectly labeled as a key attribute.
• A false negative (FN) is a key attribute that is
incorrectly identified as a non-key attribute.
Then, we calculate the following metrics using
(1), (2), (3), and (4) to evaluate all four algorithms;
Recall = TP / (TP + FN)
Precision = TP / (TP + FP)
Accuracy = (TP + TN) / (TP + TN + FP + FN)
False Positive Rate = FP / (FP + TN)
False Negative Rate = FN / (FN + TP)
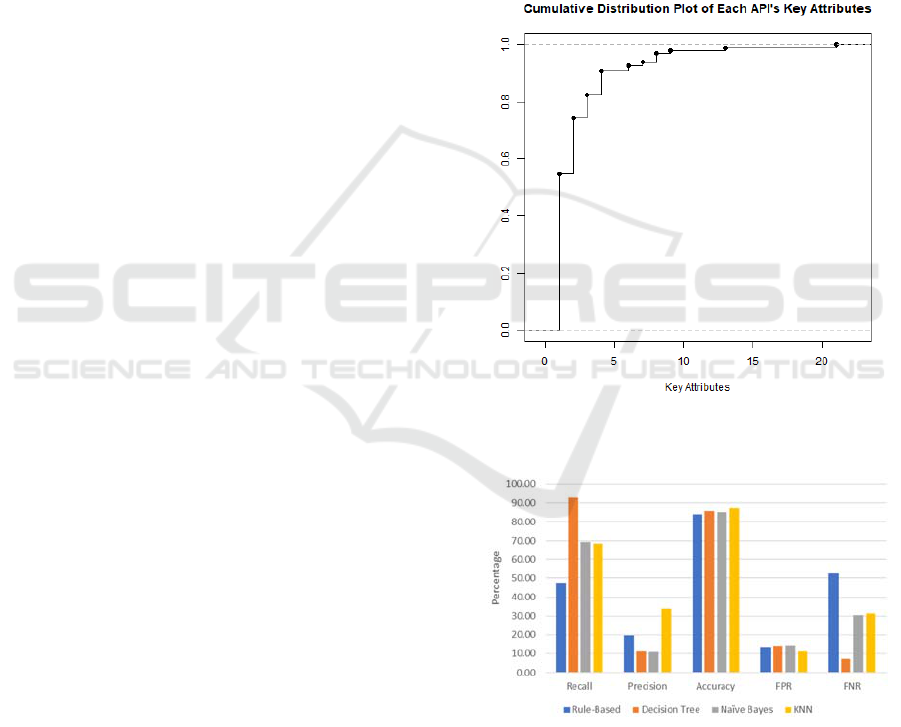
The data set for the evaluation is extracted from
the same APIs in Section 3. There are 97 data APIs.
From all APIs, there are 233 key attributes and 1,246
non-key attributes. As shown in Figure 4, 54.64% of
the APIs has one key attribute and 74.23% of the APIs
has less than three key attributes. 90.72% of the APIs
has less than 5 key attributes. Most of the APIs has a
few key attributes. This means there are more than
one attributes that are meaningful for developers to
consider. From our observations, the number of key
attributes is proportional to the number of attributes.
Figure 4: The cumulative distribution plot of each API’s
key attributes.
Figure 5: The percentage values of recall, precision
accuracy, false positive rate (FPR) and false negative rate
(FNR) for the rule-based algorithm, Decision Tree, Naïve
Bayes and KNN algorithms.
We calculate the recall numbers using (1) for all
four algorithms. The recall number suggests how well
an algorithm can find the key attributes within a data
CLOSER 2019 - 9th International Conference on Cloud Computing and Services Science
540

set. As seen in Figure 5, Decision Tree has the highest
recall (92.86%), followed by Naïve Bayes and KNN,
while the rule-based algorithm performs the worst
(47.42%). According to these results, Decision Tree
can find the key attributes better than Naïve Bayes,
KNN and the rule-based algorithm. One reason that
Decision Tree yields the best recall is because
Decision Tree constructs a decision tree by trying to
select the best feature that can best classify the data.
In this case, the attribute name is the root of the tree,
coinciding with our observations in Section 3.
The precision number expresses the proportion of
the attributes that an algorithm labels as key attributes
are actual key attributes, calculated using (2). As
illustrated in Figure 5, KNN has the most precision
(33.91%) and the runner-up is the rule-based
algorithm (19.74%), while Decision Tree and Naïve
Bayes perform similarly. The reason that KNN yields
the best precision is because KNN is running with
K=1. This means KNN only finds the one nearest
neighbor while all neighbor are true key attributes. In
our case, KNN tries to find the closest attribute name,
the closest attribute type, the closest meta data type,
and the closest repetition. From our observations,
several key attribute names share similar names but
they are not exactly the same. This is why the rule-
based algorithm performs worse than KNN. The rule-
based algorithm checks the exact match of certain
attribute names, including data type, meta data type
and repetition.
We also compute the accuracy values for the rule-
based algorithm, Decision Tree, Naïve Bayes and
KNN, using (3). As shown in Figure 5, KNN has the
best accuracy (87.15%), while the rule-based
algorithm has the worst accuracy (83.91%). Both
Decision Tree and Naïve Bayes perform closely.
The false positive rate (FPR) is calculated using
(4). False positive is a non-key attribute which is
classified as a key attribute. Higher FPR implies
worse usability because the system shows a value of
a non-significant attribute. As illustrated in Figure 5,
the rule-based algorithm has the highest false positive
rate (13.53%), while KNN has the least FPR
(11.29%). Both Decision Tree and Naïve Bayes have
the similar false positive rates. The accuracy rate of
the rule-based algorithm, Decision Tree, Naïve Bayes
and KNN algorithms in percentage.
The false negative rate (FNR) is computed using
(5). As shown in Figure 5, the rule-based algorithm
yields the worst false negative rate (52.58%), while
Decision Tree has the lowest false negative rate
(7.14%). Both Naïve Bayes and KNN have similar
FNR, 30.56% and 31.30% respectively. The reason
that the rule-based algorithm performs badly is
because the rules do not cover all cases of key
attributes. Thus, the rule-based algorithm cannot label
actual key attributes correctly.
In summary, according to the statistical
calculations in Figure 5, we can see that KNN
outperforms the other algorithms, namely the rule-
based algorithm, Decision Tree and Naïve Bayes.
KNN yields the highest precision and accuracy values
and the lowest false positive rate. KNN also has the
second highest recall and the moderate false negative
rate. In contrast, the rule-based algorithm has the
worst recall, the lowest accuracy and the highest false
negative rate. The rule-based algorithm seems to
perform the worst because the rules are defined
statically and cannot adapt to the unseen data,
resulting in high false rates. Although Decision Tree
has the highest recall, it also yields a very low
precision number. This suggests that the constructed
decision tree is overfitting.
7 CONCLUSION
Integration of data and information exchange
amongst various IoT devices and systems is one of
the core problems in providing pervasive computing
environment. The proliferation of APIs and IoT
devices in heterogeneous environments require
different systems to integrate and utilize various API
services. In this paper, we propose a technique which
utilize recent development in machine learning to
facilitate the key integration point and allow systems
to automatically identify and utilize key data
attributes from heterogeneous sources. Different
machine learning approaches have been evaluated as
an alternative to a manual integration of data
heterogeneity and reduce the time for new services to
be implemented and integrated with existing source
of information. From our experiments, KNN is the
most promising algorithm to use to classify a key
attribute which is essential to data verification. The
rule-based algorithm seems to perform the worst
because the rules are rigid and static to exactly match
unseen attribute names. In contrary, KNN has more
flexibility to find a key attribute by using the training
data to guide.
REFERENCES
L. Columbus, L., 2018. “IoT Market Predicted To Double
By 2021,” August 16, 2018
Sangpetch, O., and Sangpetch, A., 2017. Graph-based,
Microservice Architecture for Federated Smart City
Automated Attribute Inference for IoT Data Visualization Service
541

Data Interoperability. In EAI International Workshop
on Smart Cities Interoperability and Standardization.
Quinlan, J. R., 1986. Induction of Decision Trees. Mach.
Learn. 1, 81–106.
Russell, S., and Norvig, P., 2003. Artificial Intelligence: A
Modern Approach (2nd ed.). Prentice Hall. ISBN 978-
0137903955, 1995.
Altman, N. S., 1992. An Introduction to Kernel and
Nearest-Neighbor Nonparametric Regression, The
American Statistician, 46:3, 175-185.
Melnik, S., Garcia-Molina, H., and Rahm, E., 2002.
Similarity flooding: a versatile graph matching
algorithm and its application to schema matching. In
Proceedings 18th International Conference on Data
Engineering, San Jose, CA, USA, 2002, pp. 117-128.
Cabrera, C., White, G., Palade, A., and Clarke, S., 2018.
The Right Service at the Right Place: A Service Model
for Smart Cities, In Percom 2018, IEEE International
Conference on Pervasive Computing and
Communications, Athens, Greece, 2018, pp. 1-10.
Yu, X., Li, P., and Li, S., 2010. Research on data exchange
between heterogeneous data in logistics information
system. In 2010 Second International Conference on
Communication Systems, Networks and Applications,
Hong Kong, 2010, pp. 127-130.
Zhang, J., and Zhang, M., 2010. Data exchange method and
platform design of heterogeneous databases. In 2010
International Conference On Computer Design and
Applications, Qinhuangdao, 2010, pp. V4-192-V4-196.
[10] H. Xu, Y. Tian, G. Dong and Y. Wang, "A schema of
data exchange for heterogeneous data," 2011 2nd
International Conference on Artificial Intelligence,
Management Science and Electronic Commerce
(AIMSEC), Dengleng, 2011, pp. 5324-5327.
Tan, M., and Li, Y., 2011. Design and implementation of
general distributed heterogeneous data exchange
system. In 2011 IEEE 3rd International Conference on
Communication Software and Networks, Xi'an, 2011,
pp. 416-420.
Noguchi., S., and Takada, H., 2008. A Map-Based
Approach for Visualization of Information Exchange in
Town Area. In C5 2008, Sixth International Conference
on Creating, Connecting and Collaborating through
Computing, Poitiers, 2008, pp. 155-161.
Shiang, W., Chen, H., and Rau, H., 2008. An intelligent
matcher for schema mapping problem. In 2008
International Conference on Machine Learning and
Cybernetics, Kunming, 2008, pp. 3172-3177.
Quinlan, J. R., 1993. C4.5: Programs for Machine Learning.
Morgan Kaufmann Publishers.
CLOSER 2019 - 9th International Conference on Cloud Computing and Services Science
542
