
Providing Malaria Analytics as a Service
Marcos Barreto
1
, Juracy Bertoldo
1
, Alberto Sironi
1
and Vanderson Sampaio
2,3
1
AtyImoLab, Computer Science Department, Federal University of Bahia (UFBA), Salvador, Brazil
2
Amazonas State Foundation for Health Surveillance (FVS-AM), Manaus, Brazil
3
State University of Amazonas (UEA), Manaus, Brazil
Keywords:
Data Analytics, Data Linkage, Visual Mining, Data as a Service.
Abstract:
Malaria is still a worrying disease worldwide, being responsible for around 219 million cases reported in 2017
and around 435,000 deaths a year. The consensus among researchers, governmental bodies and health pro-
fessionals is that many countries have relapsed their investments and surveillance actions after a few years of
apparent disease reduction. Brazil is within such countries and, consequently, is presenting a constant increase
in the number of reported cases since 2016 (more than 20% a year). Given this context, the National Malaria
Control Program (NMCP) promotes several actions to redirect the country towards the malaria elimination
path. Among such actions, the improvement of the surveillance ecosystem is considered crucial to allow effi-
cacy of control actions, including vector control as well as early diagnosis and prompt treatment. In this paper,
we present our efforts in designing a visual mining tool allowing descriptive and predictive analytics over an
integrated database comprising malaria surveillance data, climate and vector control data. This tool has been
used as a “data service” by NMCP and partner researchers for validation purposes. So far, our results have
demonstrated that surveillance and combat actions can be highly improved by using this tool.
1 INTRODUCTION
Malaria remains a worldwide public health problem,
especially in some regions in Africa, South America
and Southeast Asia. According to the 2018 WHO Re-
port (WHO, 2018), although the global incidence rate
of malaria has been decreased by 18% between 2010
and 2017 (from 72 to 59 cases per 1,000 population at
risk), it remains at 59 over the past three years, mean-
ing most countries are failing in their strategies to
eliminate or eradicate the disease. In 2017, there were
around 219 million cases and 435,000 deaths glob-
ally reported, against 217 million cases and 451,000
deaths in 2016. These numbers help to realize that
many lives can be saved when surveillance systems
providing early detection and guidance for treatment
are put into action.
In South America, four countries (Brazil, Colom-
bia, Peru and Venezuela) have averaged around 80%
of reported cases in the last three years. Most of these
cases come from the Amazonian region (major green
area shown in Figure 1), except in Colombia, where
most cases come from the Pacific coast (small green
area shown in Figure 1). Although these countries are
considered to be in the “control phase” (which pre-
cedes “elimination” and “eradication”) of the disease,
they are presenting a steady growth in the number of
reported cases according to an alert issued by the Pan
American Health Organization in February 2017.
Figure 1: South American malaria endemic countries
(Source: (Hyndman and Athanasopoulos, 2018)).
Given this context, WHO is partnering with sev-
eral entities and local governments in different coun-
tries to foster improvements in current policies and
tools, as well promoting new ones. It is expected these
countries will comply with most of the objectives con-
tained in WHO’s Global Strategy for Malaria.
Barreto, M., Bertoldo, J., Sironi, A. and Sampaio, V.
Providing Malaria Analytics as a Service.
DOI: 10.5220/0007765205150522
In Proceedings of the 9th International Conference on Cloud Computing and Services Science (CLOSER 2019), pages 515-522
ISBN: 978-989-758-365-0
Copyright
c
2019 by SCITEPRESS – Science and Technology Publications, Lda. All rights reserved
515
As data is playing an important role nowadays,
data portals and data science tools are considered vi-
tal parts for most data-driven ecosystems. Specifi-
cally for malaria surveillance, data on breeding sites,
control actions (indoor residual spraying, use of in-
secticide treated bed nets, etc.), laboratory findings,
treatment, among others, are collected into different
databases to support analysis and policy making, as
well as specific actions during outbreaks.
In this paper, we present our work towards a data
analytics portal for malaria surveillance in Brazil. We
have integrated surveillance, climate and socioeco-
nomic data from different sources and designed a set
of statistical and machine-learning based methods to
support descriptive and predictive analysis over such
integrated database. This portal has been used by re-
searchers and governmental bodies for validation pur-
poses. The results so far, in terms of data richness
(amount, variety and quality of data being integrated)
and analytical methods are a proof that our tool is
effectively capable of providing effective support for
fast analysis and decision making.
This paper is organized as follows: Section 2
presents the Brazilian malaria surveillance system.
Section 3 presents our linkage efforts to gener-
ate a comprehensive database leveraging data about
malaria cases, whereas Section 4 details the proposed
visual mining tool for malaria analytics. Related
works are discussed in Section 5 as we complete with
some conclusions and further directions in Section 6.
2 BRAZILIAN MALARIA
SURVEILLANCE SYSTEM
In Brazil, the National Malaria Control Program
(NMCP), created in 2003, is the governmental body
responsible by permanent policies regarding the pre-
vention and control of malaria at national level.
NMCP acts closely to state health agencies to ensure
continuous surveillance and evaluation actions at mu-
nicipality level, especially in endemic areas.
Around 99% of malaria cases are reported within
the Brazilian Legal Amazon, being recorded in the
SIVEP (Epidemiological Surveillance System for
Malaria) database. Cases reported outside Legal
Amazon are recorded in SINAN (Information System
for Notifiable Diseases), which is a specific database
within the Brazilian Public Health System (SUS) for
the compulsory notification of 28 infectious diseases,
as well as for accidents by venomous animals and do-
mestic violence.
Half of cases reported in SIVEP are diagnosed
and treated late (more than 48 hours after symp-
toms onset), which contributes to a significant mor-
tality rate observed inside the Legal Amazonian re-
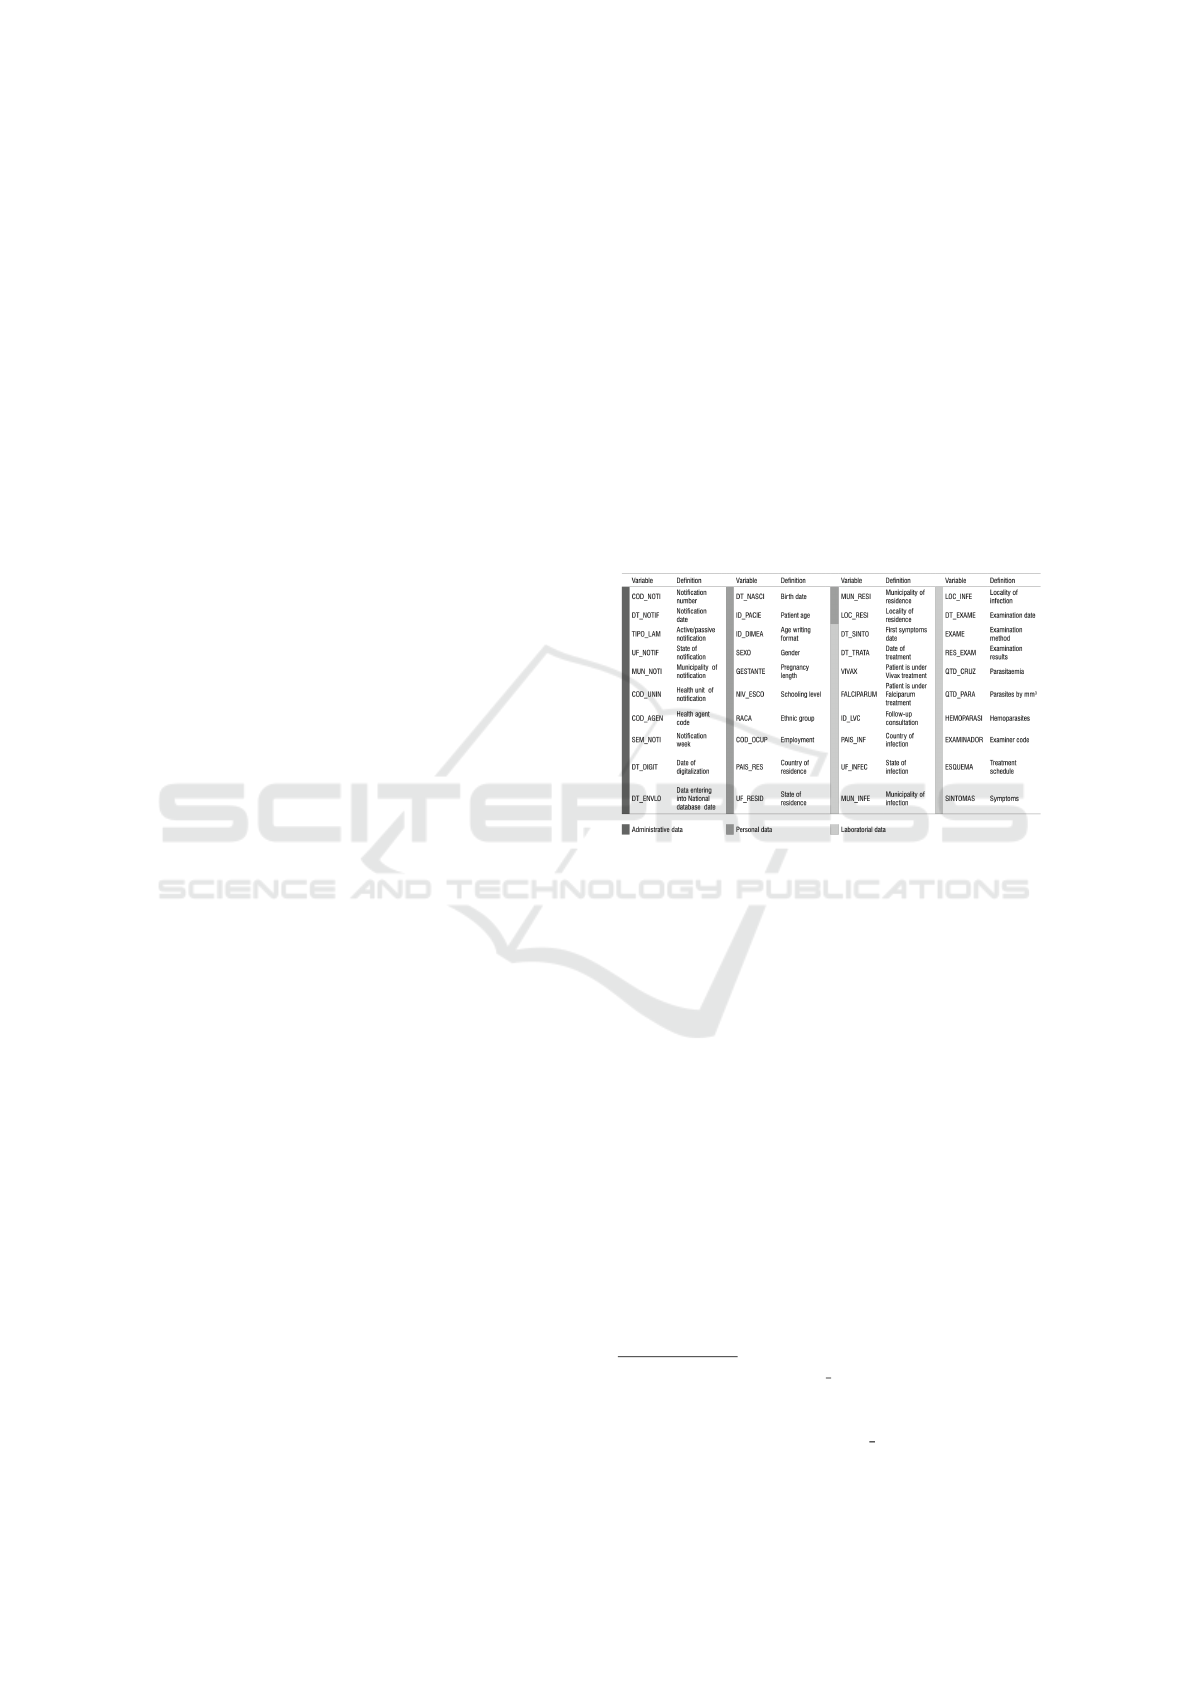
gion. SIVEP aggregates administrative, laboratory
and personal data into 40 variables (as depicted in
Figure 2), most of them presenting high quality in
terms of completeness. It is accessible through a spe-
cific interface
1
and its data sets are publicly available
through a dedicated web-service (TABNET) managed
by the Ministry of Health
2
. TABNET allows the user
to filter data sources from different domains (health
indicators, morbidity and epidemiological data, so-
cioeconomic and demographic data, etc) and gen-
erate specific data tables aggregated at municipal-
ity, state or country level. Data are update regularly
(monthly, for most databases) but asynchronously,
meaning databases have different coverage periods.
Figure 2: SIVEP variables and definition (Source: (Wiefels
et al., 2016)).
Cases reported in SINAN are frequently misdi-
agnosed as other fever-related illnesses and belatedly
treated as malaria is not so frequent outside the Ama-
zonian region (Lorenz et al., 2015), which can re-
sult in high fatality rates. As SINAN was conceived
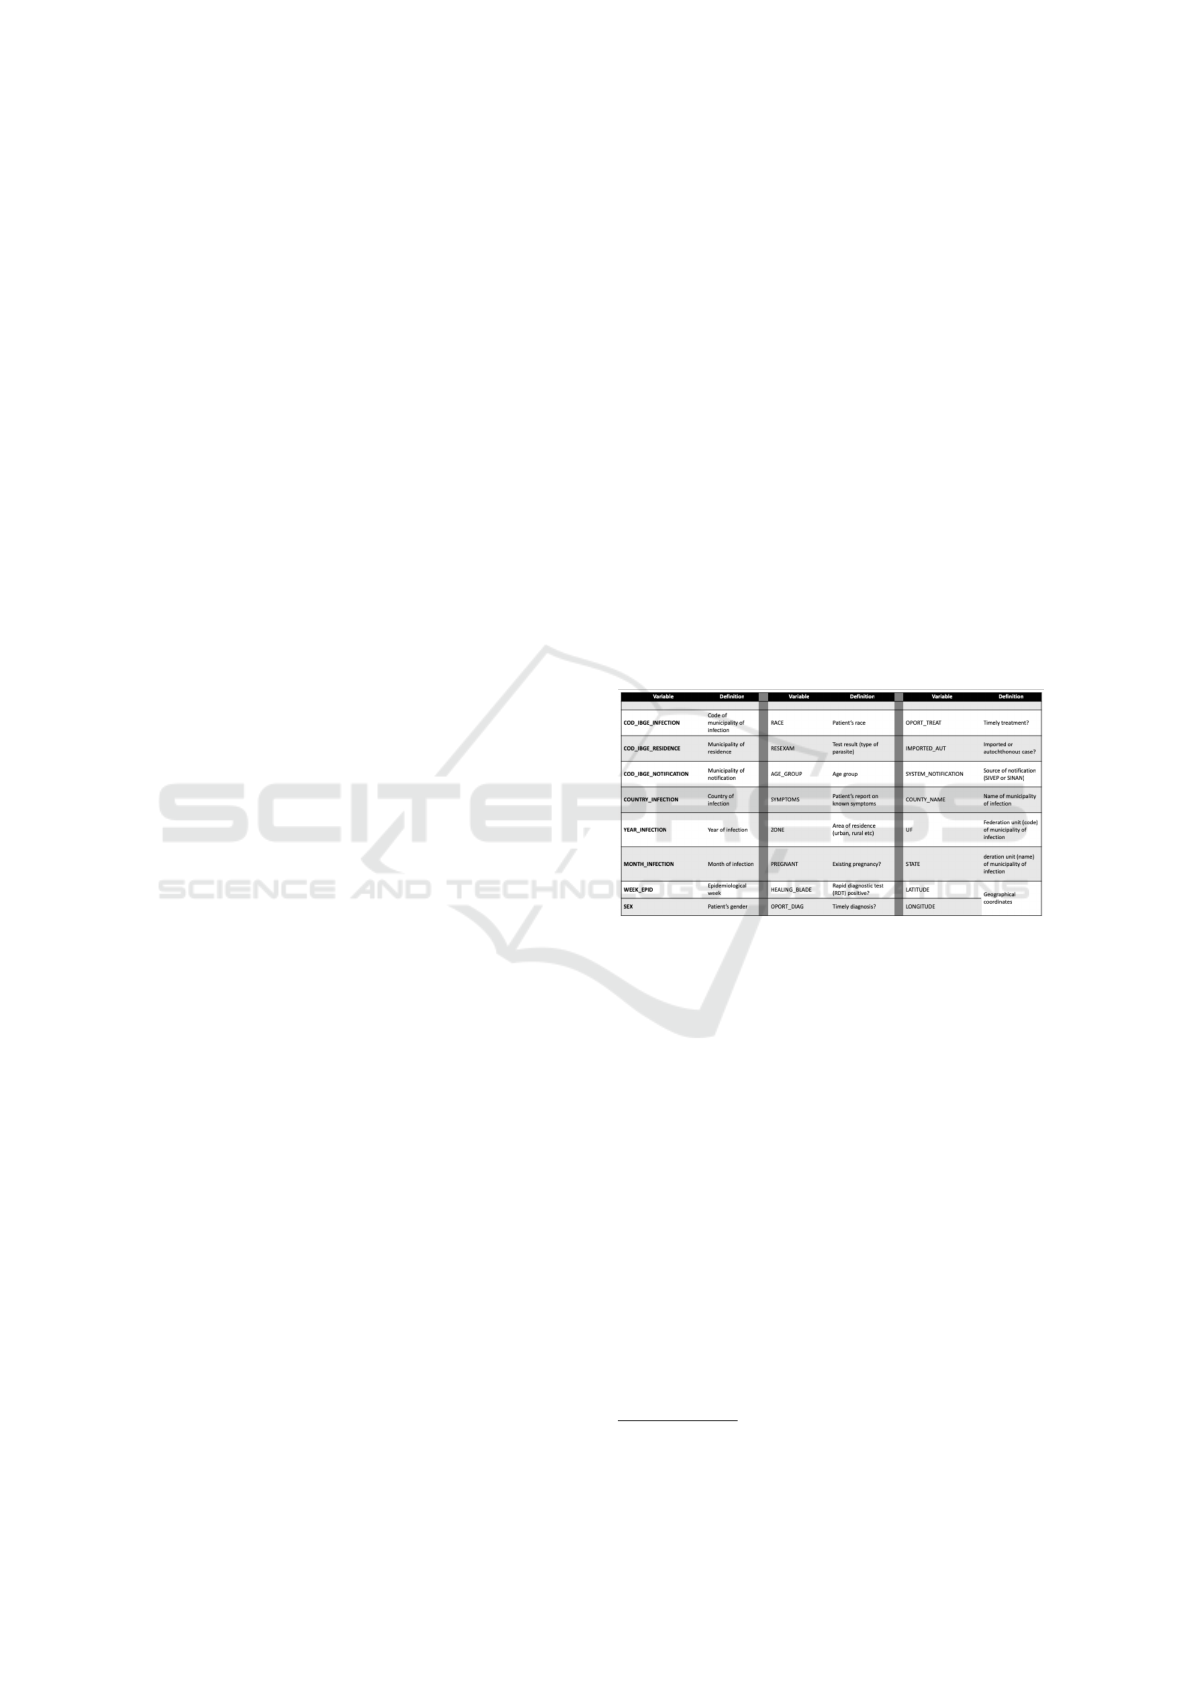
to register several notifiable diseases, its structure is
more generic (43 variables comprising demograph-
ics, symptoms, infection site and suspected disease)
and does not capture the whole information about
malaria (as SIVEP does). Most ICD-10 codes related
to malaria in SINAN are registered as B54 (unspeci-
fied malaria), whereas SIVEP brings a detailed spec-
ification on which parasite (Plasmodium vivax, fal-
ciparum, malariae etc) caused the infection, through
specific ICD-10 codes (B50 to B53). SINAN is acces-
sible to registered users through a specific interface
3
and its data sets, stratified by diseases, are also pub-
licly available through TABNET.
NMCP actions regarding malaria surveillance are
1
www.saude.gov.br/sivep malaria
2
http://www2.datasus.gov.br/DATASUS/
index.php?area=02
3
http://www.saude.gov.br/sinan net
CLOSER 2019 - 9th International Conference on Cloud Computing and Services Science
516
hampered due to the existence of these two hetero-
geneous systems. The discrepancy of health agents’
expertise and infrastructure inside and outside the
Amazonian region, as well poor government aware-
ness (in some regions) related to breeding sites, are
other impacting factors. Data about transmission vec-
tors (Anopheles mosquitoes), for example, are present
only in a small number of municipalities (most inside
the Amazonian region), where local health secretari-
ats exercise more effective control of breeding sites.
The lack of a centralized view of all reported cases
is a challenging operational issues faced by NMCP.
Although most cases occur inside the Amazonian re-
gion and are promptly recorded in SIVEP, the propor-
tion of cases registered in SINAN has led to a signif-
icant number of deaths due to late treatment. Given
the enormous size of the Amazonian region, many
breeding sites are not known or detected early and,
consequently, many cases are reported late. There
are some specific locations, such as indigenous com-
munities and gold mining areas, where the access of
health agents is somewhat restricted and people liv-
ing in these areas do not have sufficient prevention
habits or resources. This situation is particularly com-
plicated, especially for combating epidemics.
Regarding research, both systems, when used
alone, do not offer a complete and updated snapshot
of malaria in Brazil. Frequently, researchers need
to decide which samples to use and deal with pre-
processing and linkage issues to get data sets with
better quality and coverage. Consequently, many re-
searchers own bespoken data sets which are, in gen-
eral, richer than public ones (they capture more and
better data), although tailored for particular studies.
The proposed tool aims to help in circumvent-
ing some of these issues by providing an unified
view of malaria-related data recorded in SIVEP and
SINAN, as well other relevant data from climate, so-
cioeconomic, vector control and mortality databases.
This unified database is used by health agents and
researchers for surveillance, policy making and epi-
demiological studies. This tool is under validation to
be part of NMCP’s portfolio of available tools to com-
bat malaria in Brazil. We are also promoting it to the
academic community, as they are valuable partners
owing proprietary data sources and very challenging
questions to guide further improvements in our tool.
3 LINKAGE OF MALARIA DATA
Besides aggregating data from SIVEP and SINAN,
we have also linked bespoken data sets from research
partners to support specific studies in three munici-
palities inside the Amazonian region. These studies
have been used as “pilot studies” to i) identify new
data sources and functionalities to our tool, ii) pro-
vide evidence on the feasibility of our tool regarding
data coverage and analytical capabilities, and iii) help
researchers on more complex questions.
Data from SIVEP covers the period 2003–2017,
resulting in 5,490,603 records with 40 variables stor-
ing demographics, symptoms, laboratory results, di-
agnosis and information on infection sites. From
SINAN, we have aggregated 42,670 records from the
period 2003–2015. Our linkage was based on 40 com-
mon variables, resulting in a total of 5,533,273 cases.
We have aggregated these data into a “national
database of malaria episodes” (Figure 3) providing
a comprehensive overview of malaria cases. This
database has a mixture of raw data (variables from
SIVEP and SINAN), as well new variables storing
information about timely or late diagnosis and treat-
ment, imported and autochthonous cases, epidemio-
logical week and geographic coordinates.
Figure 3: National database of malaria episodes.
Timely/late diagnosis and treatment are important
metrics to assess how effective are existing surveil-
lance and combat actions. Existing regulation defines
late diagnosis or treatment as two days after symp-
toms onset, whereas timely diagnosis and treatment
occur before that. This analysis is important to iden-
tify possible outbreaks. Analysis of imported and
autochthonous cases is also important to understand
malaria dynamics. For a given municipality, it is im-
portant to know from where reported cases are com-
ing, as they can significantly influence decisions and
expenses related to surveillance and combat actions.
Mortality data related to malaria were extracted
from SIM
4
, a database used to routine collect data
on mortality. SIM has changed over the years, rang-
ing from 37 to 112 variables storing anonymized data
at individual level. We aggregated data covering the
period 2003–2015, totalizing 1,004 cases. Variables
were chosen after a careful revision and harmoniza-
4
http://sim.saude.gov.br/default.asp
Providing Malaria Analytics as a Service
517
tion (Figure 4). We have also introduced new vari-
ables to allow this database to be linked to the national
database of malaria episodes (by municipality code).
Figure 4: Mortality data (municipality level).
Climatic variables help to understand malaria dy-
namics, as they directly influence the emergence, sur-
vival and longevity of malaria vectors. Changes in
rainfall patterns, water development projects and un-
usual temperature increase can play a great role in
malaria transmission (Sena et al., 2015). Climate data
was extracted per day from the National Oceanic and
Atmospheric Administration (NOAA)
5
, based on mu-
nicipality location. The variables aggregated into our
tool are shown in Figure 5.
Figure 5: Climate variables (municipality level).
For some municipalities inside the Amazonian re-
gion, we were able to aggregate data about transmis-
sion vectors, which are important for vector-based
disease control strategies. We have developed a pi-
lot study in Manaus, capital city of Amazonas, state
reporting most of the cases recorded in SIVEP. Data
about breeding sites, laboratory, leisure places and
spraying zones (see Section 4 for details) were ag-
gregated. This data is used by local health agents to
monitor and recommend long-term interventions for
vector control. This pilot study has been done to re-
inforce the importance of collecting this kind of data
to support new strategies to combat transmission vec-
tors.
We have relied on our experience designing link-
age methods and tools (Barreto et al., 2017), (Pita
et al., 2018) to get data from these databases correctly
harmonized and linked. Although centrally managed
by the Ministry of Health, these databases were de-
signed at different times and for different purposes.
We have omitted details about this preprocessing step,
but we highlight that most researchers need to per-
form this task when working with public data sets
which is a complex and time-consuming task. So, one
5
https://www.noaa.gov/
important contribution of the proposed tool is to pro-
vide access to a set of data, aggregated at municipality
level, with high accuracy and coverage.
4 MINING MALARIA DATA
Besides building this national database comprising
malaria episodes and complementary data, we have
also developed a graphical mining tool (Figure 6) al-
lowing for descriptive and predictive analysis over
these data. This tool is temporarily hosted at this ad-
dress
6
and will be fully functional (Portuguese and
English versions, permanent address) by April 2019.
Figure 6: Malaria visual mining tool (main interface).
The proposed tool has a set of functions support-
ing univariate and bivariate analyzes, visual mining
through different metaphors, access to the aggregated
data and their dictionaries, as well predictive analy-
sis for specific outcomes. We are running evaluation
tests and pilot studies together with NMCP staff and
partner researchers to improve the tool.
4.1 Descriptive Analysis
Regarding statistical analyzes, the tool allows for uni-
variate and bivariate analysis, as well time series and
quartiles evaluation. Univariate analysis can be done
through histograms or density-based graphs and data
can be ranked at municipality or federation unit level.
Bivariate analysis allows for more complex relations
among data items. For illustration purposes, we can
check for malaria cases influenced by different cli-
mate variables for the whole period (2010–2015), as
exemplified in Figure 7. Time series analysis can be
performed over reported cases as well climate data for
the whole period. Figure 8 shows an example.
6
http://200.128.60.86:3838/shiny integracao/
CLOSER 2019 - 9th International Conference on Cloud Computing and Services Science
518
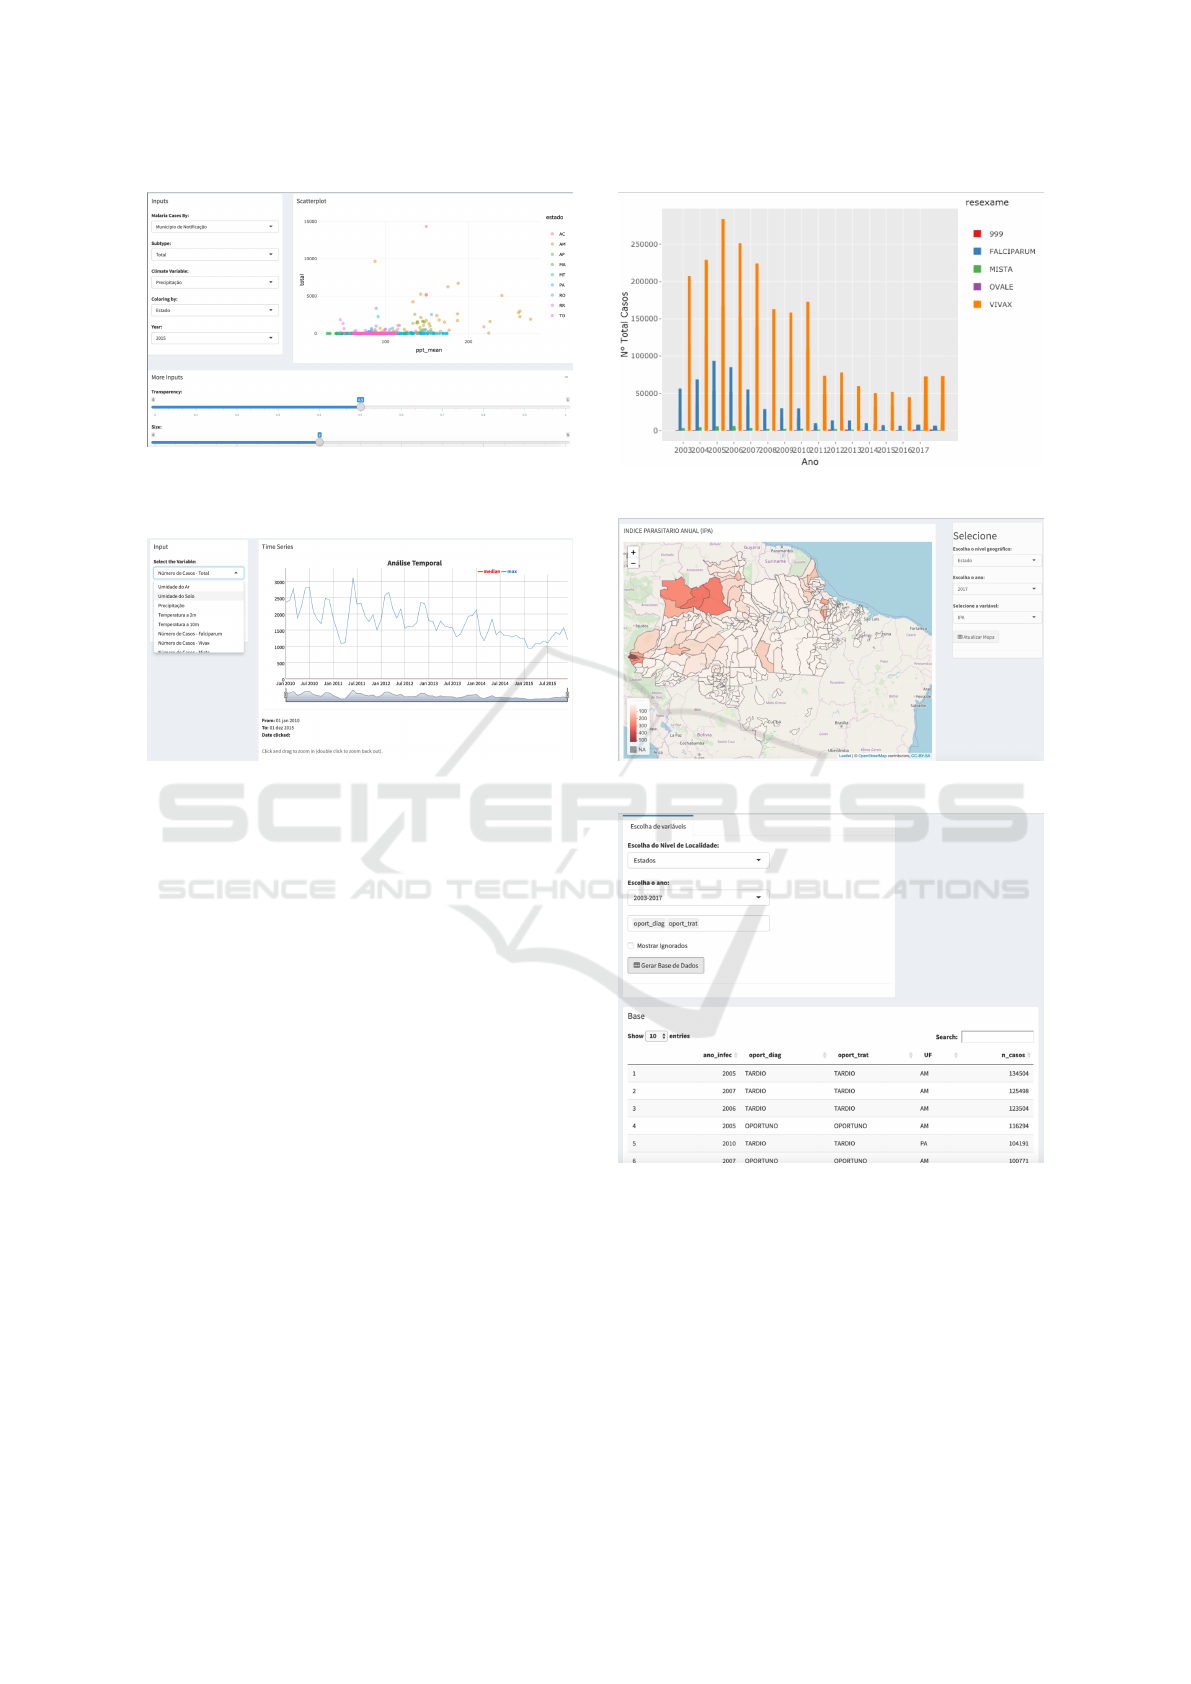
Figure 7: Example of bivariate analysis - total number of
cases by municipality of notification related to mean pre-
cipitation (year 2015).
Figure 8: Example of time series analysis - total number of
cases over the period (2010–2015).
4.2 Visual Data Mining
We have designed a set of functions which rely on
graphical metaphors (specially maps) to present in-
formation in a friendly way (considering users with
different backgrounds). These functions were pointed
out by partner researchers and NMCP staff as being
vital for fast analysis and decision making.
Available functions comprise analysis of Annual
Parasite Index (IPA), temporal analysis of number of
cases per month, total number of cases by year or ac-
cording to parasite type (Falciparum, Vivax, Malariae
etc), imported versus autochthonous cases, including
whether diagnosis and treatment were timely or late,
and specific analysis by age group. Figures 9 and 10
show some of these functions.
One important feature in the proposed tool is
“variable crossing”, which allows any user to select a
subset of the variables present in the national database
and build a bespoke data set to accommodate her
needs. The user can select data from the period 2003–
2017 aggregated at different levels (from municipali-
ties to entire country). Figure 11 depicts an example.
Figure 9: Total of cases by parasite type.
Figure 10: Annual Parasite Index (2017).
Figure 11: Bespoke data set generated by variable crossing:
timely (“oportuno”) x late (“tardio”) diagnosis and treat-
ment (period 2003–2017, by federation unit).
4.3 Predictive Analysis – Forecasting
Predictive analysis is an important capability to any
decision support system. For malaria surveillance,
one challenging issue is the ability to predict out-
breaks and incidence, or number of cases, given past
episodes, weather conditions, known breeding sites
and existing combat actions. As mentioned earlier,
Providing Malaria Analytics as a Service
519
most countries have experienced an unforeseen in-
crease in the number of malaria cases in the last two
years, so prediction plays an important role.
Our first effort to build a predictive model for
malaria epidemics have considered data from Man-
aus, capital city of Amazonas, which is the state with
most cases reported in SIVEP (more than 8,000 cases
in 2018). Another municipality is Boca do Acre,
which presents a low IPA.
We have tested the predictive power of several al-
gorithms to estimate the number of cases for these
two municipalities. We have extracted monthly val-
ues from the national malaria database, for the period
2003 to 2018. Our prediction model is based on the
following attributes as predictors: number of asymp-
tomatic individuals, number of pregnant women and
number of male and female individuals.
The validation method is known as ”evaluation
on a rolling forecasting origin”, which considers that
training data will always be prior than test data, not
using future data to build the model (Hyndman and
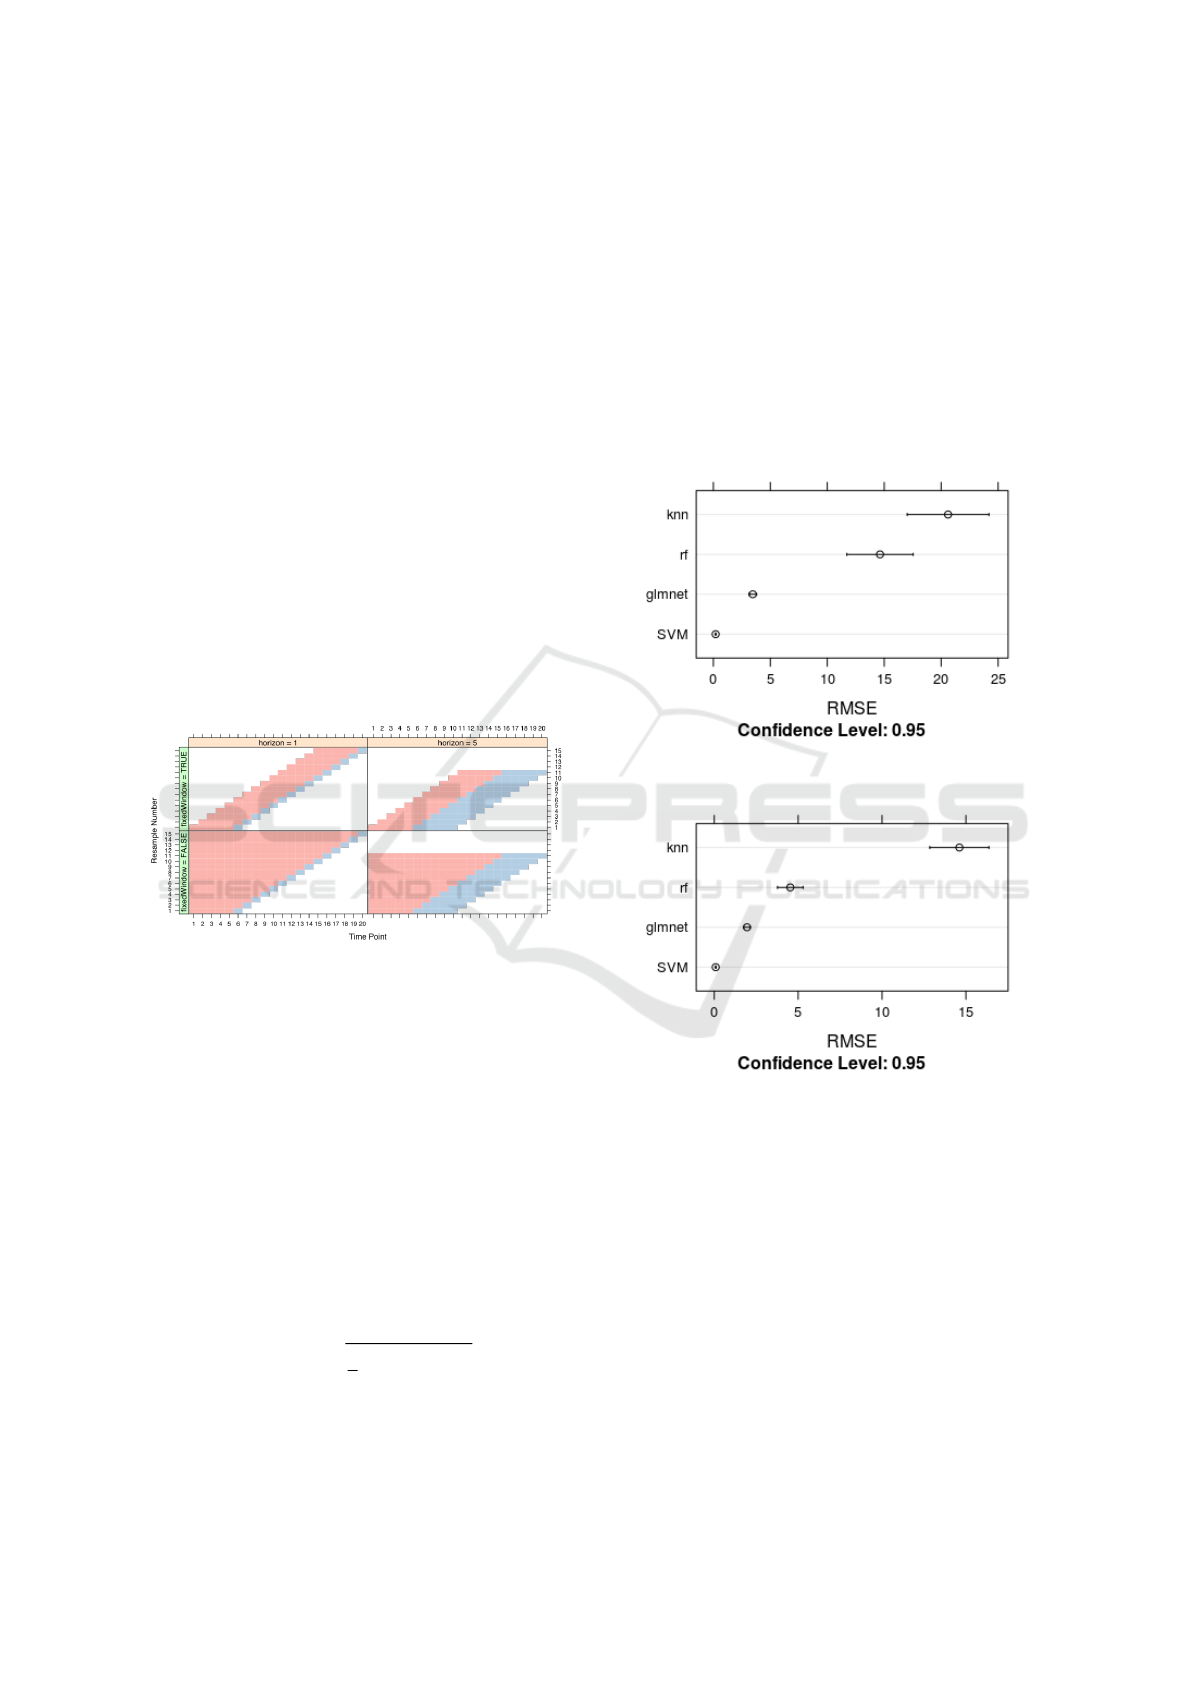
Athanasopoulos, 2018), as depicted in Figure 12.
Figure 12: Rolling forecasting origin approach
(Source: (Kuhn, 2009)).
This approach has the following parameters:
• Initial consecutive number in each training data
set (initialWindow).
• Consecutive number of values for the testing data
set (horizon).
• A control parameter indicating whether the train-
ing data set has a fixed window size or whether
the size will be accumulative (fixedWindow).
To measure accuracy, we used the mean square er-
ror (RMSE), defined as the square root of the average
of squared differences between predicted and actual
observations (Equation 1).
RMSE =
r
1
n
Σ
n
i=1
(p
i
− o
i
)
2
(1)
where: p
i
is the predicted values; o
i
is the ob-
served values; and n is the sample size.
We have used the following algorithms to assess
our prediction model: K-Nearest Neighbors (KNN),
Support Vector Machines (SVM), Random Forest and
Lasso and Elastic-Net Regularized Generalized Lin-
ear Models. Some existing works have been used
similar approaches to predict diseases: KNN is used
in (Modu et al., 2017) and (Ben Taieb and Hyndman,
2014); Support Vector Regression (SVR) is used in
(Ch et al., 2014) and (Agrawal and Ratnadip, 2013),
Random forest is used in (Kane et al., 2014) and (Car-
vajal et al., 2018); and Generalized linear models are
used in (Kouway
`
e, 2016) and (Zinszer et al., 2012).
Figure 13: RMSE for all models for Boca do Acre with
training data set with fixed sized.
Figure 14: RMSE for all models for Boca do Acre with
training data set is acumulative.
Results for Boca do Acre, using a training data set
with fixed size of 12 and test data set with size of 4,
are shown in Figure 13. Results for the training data
set with accumulative size are shown in Figure 14,
without modifications in the testing data set. We per-
formed the same experiment for Manaus, with results
presented in Figure 15 and Figure 16.
Table 1 shows the RMSE values for both munici-
palities. We can observe that SVM has outperformed
the other models, presenting the lowest RMSE for
both experiments for the two validation approaches.
We used grid search for all models and chose the
best configuration for each model. All models pre-
CLOSER 2019 - 9th International Conference on Cloud Computing and Services Science
520
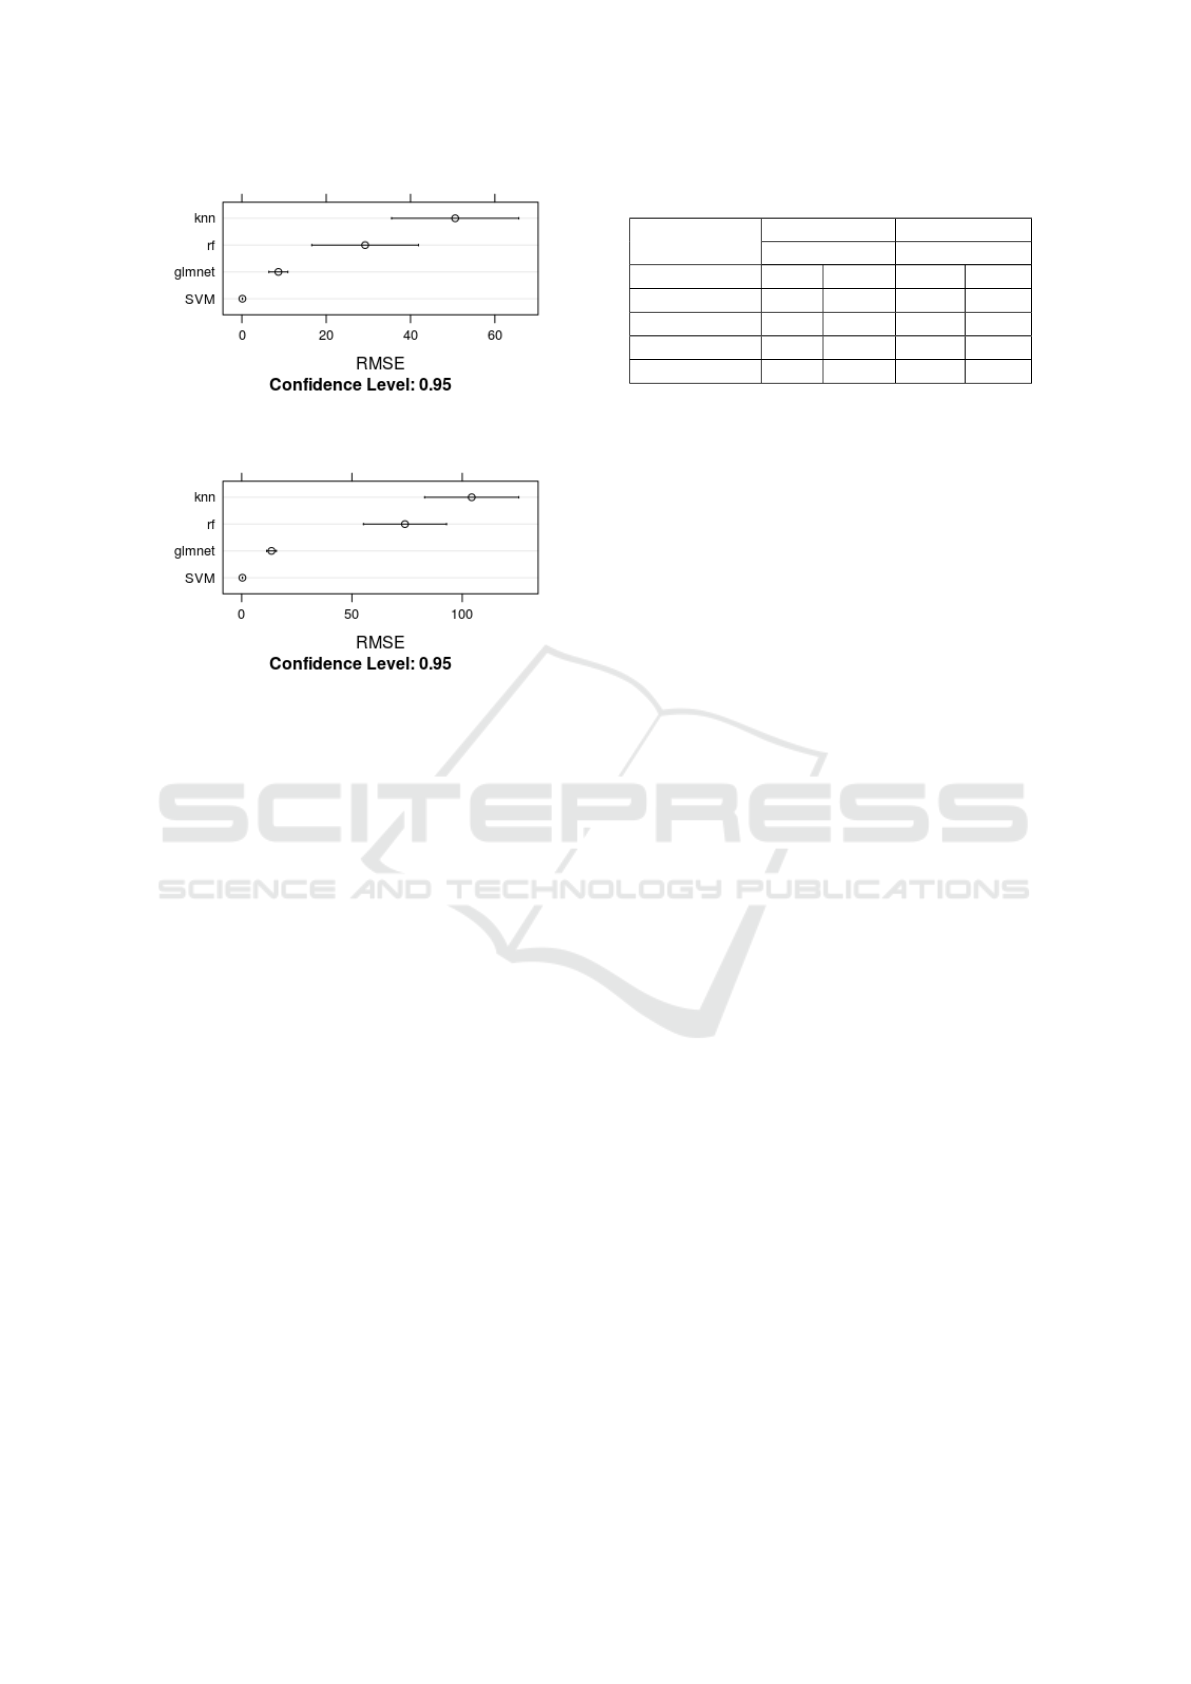
Figure 15: RMSE for all models for Manaus with training
data set is acumulative.
Figure 16: RMSE for all models for Manaus with training
data set with fixed sized.
sented better predictive power when exposed to accu-
mulative training data sets, being SVM the best one
(which reinforces its capacity of better data general-
ization in forecasting applications).
5 RELATED WORK
Data analysis platforms are becoming increasingly
important for surveillance and decision-making in
several domains. Literature contains some proposals
comprising Web applications that provide functionali-
ties for consulting, visualizing and performing spatio-
temporal analysis of malaria data.
The Malaria Atlas Project (Hay and Snow, 2006)
is a joint effort of WHO and partnering institutions to
develop a set of interactive maps to quantify malaria
syndromes and treatment rates, predict seasonality of
transmission, support spatio-temporal analysis, strat-
ify risks etc. They also keep a set of up to date country
profiles that help researchers and governmental bod-
ies on policy making and action planning.
A system to monitor and visualize malaria cases in
Brazil is proposed in (Prettz et al., 2015). The authors
present some results related to the higher occurrence
of malaria cases in the Amazon forest and a greater
number of cases assigned to male.
A similar work is presented in (Wiefels et al.,
2016). The author discuss the choice of variables
to increase data accuracy. The goal was to apply a
Table 1: RMSE for Manaus and Boca do acre.
RMSE RMSE
Boca do Acre Manaus
fixedWindow True False True False
RF 14.6 4.5 73.77 28.5
GLMNET 3.46 1.95 13.52 8.65
SVM 0.2 0.08 0.3 0.1
KNN 20.6 14.6 104 50.5
good cleanup of data excluding absent and inconsis-
tent variables. The work was based on SIVEP data
and the author defended the use of some important
variables, different to others, during the analysis tasks
for a series of more consistent and complete results.
Another study (Ch et al., 2014) proposes the Fire-
fly Algorithm (FFA), used in conjunction with SVMs
to predict malaria indentation. Performance of SVM
depends on the choice of parameters, which is done
by FFA. Climate data, such as mean rainfall and tem-
perature, were also used. Malaria data were extracted
monthly from 1998 to 2010. The proposed algorithm
was compared with artificial neural networks and au-
toregressive models, and results indicate it presents
better accuracy compared to traditional techniques.
Concerning time series models for malaria fore-
casting, in (Sewe et al., 2017) authors claim that time
series models play an important role in disease pre-
diction. Incidence data can be used to predict the oc-
currence of disease events. They conclude Random
Forest time series modeling provides enhanced pre-
dictive ability over other existing time series models.
6 CONCLUSIONS
In this research, we have presented a Web-based plat-
form to help on surveillance and decision making
about malaria in Brazil. The proposed platform al-
lows the users to run different analyzes over an inte-
grated database comprising malaria episodes, climate
and vector control data. We claim this tool can en-
able the government to maximize their surveillance
and combat actions towards malaria eradication and,
as proof of concept, we are partnering with NMCP
and researchers to validate and improve the tool.
Decision support systems focusing on malaria are
considered a global need, being confirmed through
the set of initiatives worldwide. Brazil lacks of
an integrated system aggregating data from malaria
episodes to other data potentially interesting to
surveillance, combat actions and prediction of out-
breaks. This tool was designed to be a central repos-
itory of such data and to support policy making and
research on specific outcomes.
Providing Malaria Analytics as a Service
521

In a short term, we expect this tool be officially in-
corporated into NMCP’s portfolio and become a ref-
erence platform for malaria research. This will re-
quire the setup of a cloud-based data as a service so-
lution in conformance to performance, scalability, re-
liability and availability requisites.
As middle term goal, we aim to keep all databases
updated and to design a ”real time” data capture sys-
tem allowing users to provide information on sus-
pected cases, hot spots and any other useful data on
a daily basis. This will allow for better decision and
prompt reaction in suspect situations. We are running
a pilot study on real time data capture and alert sys-
tem in Manaus, with support of local health agents
and technical staff from the Amazonas State Founda-
tion for Health Surveillance (FVS-AM).
The proposed tool has been also used to support
research on i) visual mining/analytics and ii) fore-
casting models. The set of visual metaphors provided
by the tool has been designed having in mind the di-
versity of potential users (government staff, research,
general public) and the most useful and effective re-
sources they can use to answer their decision-making
or research queries. Regarding forecasting, this work
aimed at to verify the predictive capacity of some
machine learning algorithms over malaria data from
Brazil. The next steps comprise the addition of new
attributes to improve long-term predictive power and
comparison with other metrics and models, including
neural networks and autoregressive ones.
REFERENCES
Agrawal, R. K. and Ratnadip, A. K. (2013). An introduc-
tory study on time series modeling and forecasting.
arXiv:1302.6613, 1302.6613:1–68.
Barreto, M., Alves, A., Sena, S., Fiaccone, R., Amorim, L.,
Ichihara, M. Y., and Barreto, M. (2017). Assessing the
accuracy of probabilistic record linkage of social and
health databases in the 100 million brazilian cohort. In
Proceedings of the IPDLN Conference (August 2016).
Swansea University.
Ben Taieb, S. and Hyndman, R. J. (2014). Recursive and
direct multi-step forecasting: the best of both worlds.
International Journal of Forecasting, (September).
Carvajal, T. M., Viacrusis, K. M., Hernandez, L. F. T.,
Ho, H. T., Amalin, D. M., and Watanabe, K. (2018).
Machine learning methods reveal the temporal pat-
tern of dengue incidence using meteorological factors
in metropolitan Manila, Philippines. BMC Infectious
Diseases, 18(1):1–15.
Ch, S., Sohani, S. K., Kumar, D., Malik, A., Chahar, B. R.,
Nema, A. K., Panigrahi, B. K., and Dhiman, R. C.
(2014). A support vector machine-firefly algorithm
based forecasting model to determine malaria trans-
mission. Neurocomput., 129:279–288.
Hay, S. I. and Snow, R. W. (2006). The Malaria Atlas
Project: developing global maps of malaria risk. PLoS
medicine, 3(12):e473.
Hyndman, R. and Athanasopoulos, G. (2018). Forecasting:
Principles and Practice. OTexts, Australia, 2nd edi-
tion.
Kane, M. J., Price, N., Scotch, M., and Rabinowitz, P.
(2014). Comparison of ARIMA and Random Forest
time series models for prediction of avian influenza
H5N1 outbreaks. BMC Bioinformatics, 15(1):276.
Kouway
`
e, B. (2016). Regression Trees and Random for-
est based feature selection for malaria risk exposure
prediction. pages 1–15.
Kuhn, M. (2009). The caret package.
Lorenz, C., Virginio, F., Aguiar, B. S., Suesdek, L., and
Chiaravalloti-Neto, F. (2015). Spatial and temporal
epidemiology of malaria in extra-amazonian regions
of brazil. Malaria Journal, 14(1):408.
Modu, B., Polovina, N., Lan, Y., Konur, S., Asyhari, T., and
Peng, Y. (2017). Towards a predictive analytics-based
intelligent malaria outbreak warning system. Applied
Sciences, 7:836.
Pita, R., Pinto, C. P., Sena, S., Fiaccone, R., Amorim, L.,
Reis, S., Barreto, M. L., Denaxas, S., and Barreto,
M. E. (2018). On the accuracy and scalability of prob-
abilistic data linkage over the Brazilian 114 million
cohort. IEEE Journal of Biomedical and Health In-
formatics , 22:346 – 353.
Prettz, J., Prado, K., Almeida, L., Frizon, M., Murari,
M., and Bertolini, C. (2015). MapMal
´
aria: um sis-
tema para visualizac¸
˜
ao e monitoramento dos casos de
mal
´
aria no Brasil. Anais do Computer on the Beach,
pages 328–337.
Sena, L., Deressa, W., and Ali, A. (2015). Correlation of
climate variability and malaria: a retrospective com-
parative study, southwest Ethiopia. Ethiopian journal
of health sciences, 25(2):129–138.
Sewe, M. O., Tozan, Y., Ahlm, C., and Rockl
¨
ov, J. (2017).
Using remote sensing environmental data to forecast
malaria incidence at a rural district hospital in Western
Kenya. Scientific Reports, 7(1):2589.
WHO (2018). WHO world malaria report 2018.
Wiefels, A., Wolfarth-Couto, B., Filizola, N., Durieux, L.,
and Mangeas, M. (2016). Accuracy of the malaria
epidemiological surveillance system data in the state
of Amazonas. Acta Amazonica, 46:383 – 390.
Zinszer, K., Verma, A. D., Charland, K., Brewer, T. F.,
Brownstein, J. S., Sun, Z., and Buckeridge, D. L.
(2012). A scoping review of malaria forecasting: Past
work and future directions. BMJ Open, 2(6):1–11.
CLOSER 2019 - 9th International Conference on Cloud Computing and Services Science
522
