
Easy Mobile Meter Reading for Non-smart Meters: Comparison of AWS
Rekognition and Google Cloud Vision Approaches
Maria Spichkova, Johan van Zyl, Siddharth Sachdev, Ashish Bhardwaj and Nirav Desai
School of Science, RMIT University, Melbourne, Australia
Keywords:
Software Engineering, Computer Vision, Google Cloud Vision, AWS Rekognition.
Abstract:
Electricity and gas meter reading is a time consuming task, which is done manually in most cases. There
are some approaches proposing use of smart meters that report their readings automatically. However, this
solution is expensive and requires (1) replacement of the existing meters, even when they are functional and
new, and (2) large changes of the whole system dealing with the meter readings. This paper presents results
of a project on automation of the meter reading process for the standard (non-smart) meters using computer
vision techniques, focusing on the comparison of two computer vision techniques, Google Cloud Vision and
AWS Rekognition.
1 INTRODUCTION
There are many approaches proposing smart devices
for several types of utilities, see e.g., Depuru et al.
(2011); Benzi et al. (2011); Zheng et al. (2013). Smart
meters can record energy consumption and automat-
ically send the corresponding data to the electricity
supplier for monitoring and billing purposes. This
solution is definitely useful and has many benefits,
from increasing the sustainability to offering poten-
tial benefits to householders. However, implementing
it in a large scale in real life is expensive, e.g., the
costs of the transition program for Australia were es-
timated to be a total cost of $ 1.6 billions. Many cus-
tomers prefer not to upgrade their non-smart meters
to a smart version, when the costs of this upgrade are
out of their pocket. For example, in Australia, differ-
ent energy providers may have different approaches
to how they charge their customers for this change –
either as a lump sum that is added to the first bill af-
ter the upgrade or a higher monthly fee – but in all
cases the costs are beared by the customers. Also, the
use of smart meters raised privacy concerns from the
consumers’ side: as they typically record energy con-
sumption on the hourly basis or even more frequently,
and report it to the system at least daily, this informa-
tion might be used to identify whether the residences
are at home or not, etc.
Therefore, many countries delay the transition to
the smart meter systems or purpose a partial transi-
tion. Thus, another solution is required for this case,
as to do the electricity and gas meter reading com-
pletely manually is extremely time consuming. We
proposed a solution for non-smart meters, which is
based on computer vision approaches. This solution
provides an easy way for customers to upload meter
readings to their system.
The project was conducted in collaboration with
Energy Australia, which is an electricity and gas
retailing private company in Australia. It supplies
electricity and natural gas to more than 2.6 million
residential and business customers throughout Aus-
tralia. Our goal was to provide a convenient alter-
native method for their current meter reading updat-
ing system. The current solution from Energy Aus-
tralia involves consumers using updating their utility
reading through using an online portal. This method
is inconvenient for consumers as consumers need to
provide intricate entry details. Consumers are also
required to calculate their utility reading from their
meter. The proposed solution is to use a mobile appli-
cation for capturing readings, a cloud-system to man-
age readings and a blockchain technology, see Zheng
et al. (2018); Michael et al. (2018); Swan (2015), to
store reading securely.
Contributions: This paper presents (1) the archi-
tecture and implementation details of the proposed so-
lution, as well as (2) the comparison of two computer
vision technologies, Google Cloud Vision
1
and Ama-
1
https://cloud.google.com/vision
Spichkova, M., van Zyl, J., Sachdev, S., Bhardwaj, A. and Desai, N.
Easy Mobile Meter Reading for Non-smart Meters: Comparison of AWS Rekognition and Google Cloud Vision Approaches.
DOI: 10.5220/0007762301790188
In Proceedings of the 14th International Conference on Evaluation of Novel Approaches to Software Engineering (ENASE 2019), pages 179-188
ISBN: 978-989-758-375-9
Copyright
c
2019 by SCITEPRESS – Science and Technology Publications, Lda. All rights reserved
179
zon Web Services (AWS) Rekognition
2
, applied for
recognition in utility meter readings. As the majority
of the currently used meters have digital displays (the
old versions were of dial type) we focused on this type
of displays as well as on digit recognition analysis.
The system was elaborated within a research
project under the initiative Research embedded in
teaching, proposed at the RMIT University, see
Spichkova and Simic (2017); Simic et al. (2016). To
encourage curiosity of Bachelor and Master students
to the research in Software Engineering, we suggested
to include research and analysis components in the
projects as a bonus task. Short research projects
have been sponsored by industrial partners and fo-
cused on the topics related to the project to conduct
within semester. These have to be conducted after the
semester end, focusing on research prospective and
deeper analysis of the semester task, see for example
Spichkova et al. (2018); Sun et al. (2018); Spichkova
(2018); Christianto et al. (2018); Clunne-Kiely et al.
(2017).
Outline: The rest of the paper is organised as fol-
lows. Section 2 introduces related work. The method-
ology we applied to compare AWS Rekognition and
Google Cloud Vision technologies, as well as the re-
sults of the conducted study are discussed in Sec-
tion 3. The proposed and implemented system is pre-
sented in Section 4. Finally, Section 5 summarises the
paper and proposed future work directions.
2 RELATED WORK
Many research works on elaboration of auto-
mated/remote meter reading were conducted even ap-
prox. 20 years ago. There are also a number of cor-
responding patents. For example, Kelley et al. (2000)
patented an automated meter reading (AMR) system
with distributed architecture that collects, loads, and
manages system-wide data collected from energy me-
ters and routes the data automatically to upstream
business systems.
Nap et al. (2001) patented an automatic me-
ter reading data communication system that has
an integrated digital encoder and two-way wireless
transceiver that is attachable to a wide variety of util-
ity meters for meter data collection and information
management. Many other systems with similar ideas
were patented Jenney et al. (1999); Knight and Banks
(1998); Ehrke et al. (2003), but the research area is
still very active, see e.g., Grady et al. (2016); Winter
(2017).
2
https://aws.amazon.com/rekognition
However, the majority of works in this area last
years focus on the following aspects:
• Application of the data mining and data analytics
techniques on the meter reading data.
Thus, Rathod and Garg (2016) presented an elec-
tricity consumption analysis for consumers using
data mining techniques applied to meter reading
data. Xiao et al. (2013) proposed an approaches
to recognise energy theft based on the analysis of
meter data.
• Design of smart energy meter for the smart grid,
where a smart greed is a next generation power
grid having a two-way flow of electricity and in-
formation, see Yan et al. (2013b) for more details
on smart grids.
Zheng et al. (2013) presented an overview of typi-
cal smart meter’s aspects and functions wrt. smart
grid aspects.
Kuzlu et al. (2014) analysed communication net-
work requirements for smart grid applications.
Yaacoub and Abu-Dayya (2014) proposed an ap-
proach on automatic meter reading in the smart
grid using contention based random access over
the free cellular spectrum.
Arif et al. (2013) conducted a study on design and
development of smart energy meter for the smart
grid.
• Privacy and security aspects of smart meters are
studied especially intensively over the last years,
as the privacy and security concerns provide one
of the biggest obstacles for the (potential) users of
smart meters.
Yan et al. (2013a) proposed a security protocol for
advanced metering infrastructure in smart grid.
Sankar et al. (2013) proposed a theoretical frame-
work to analyse privacy aspects of smart meters.
Albert and Rajagopal (2013) and Beckel et al.
(2014) discussed what the consumption patterns
derived using the smart meters might say about
the consumers.
Chen et al. (2013) presented an approach for non-
intrusive occupancy monitoring using smart me-
ters, having a goal to implement energy-efficiency
optimizations based on the information of home’s
occupancy. Other approaches for occupancy de-
tection from electricity consumption data were
proposed by Kleiminger et al. (2013); Yang et al.
(2014); Masoudifar et al. (2014); Chen et al.
(2018) and Tang et al. (2015).
Tan et al. (2013) proposed a solution to increase
the smart meter privacy through energy harvest-
ing and storage devices.
Eibl and Engel (2015) analysed the influence of
data granularity on smart meter privacy as well
ENASE 2019 - 14th International Conference on Evaluation of Novel Approaches to Software Engineering
180
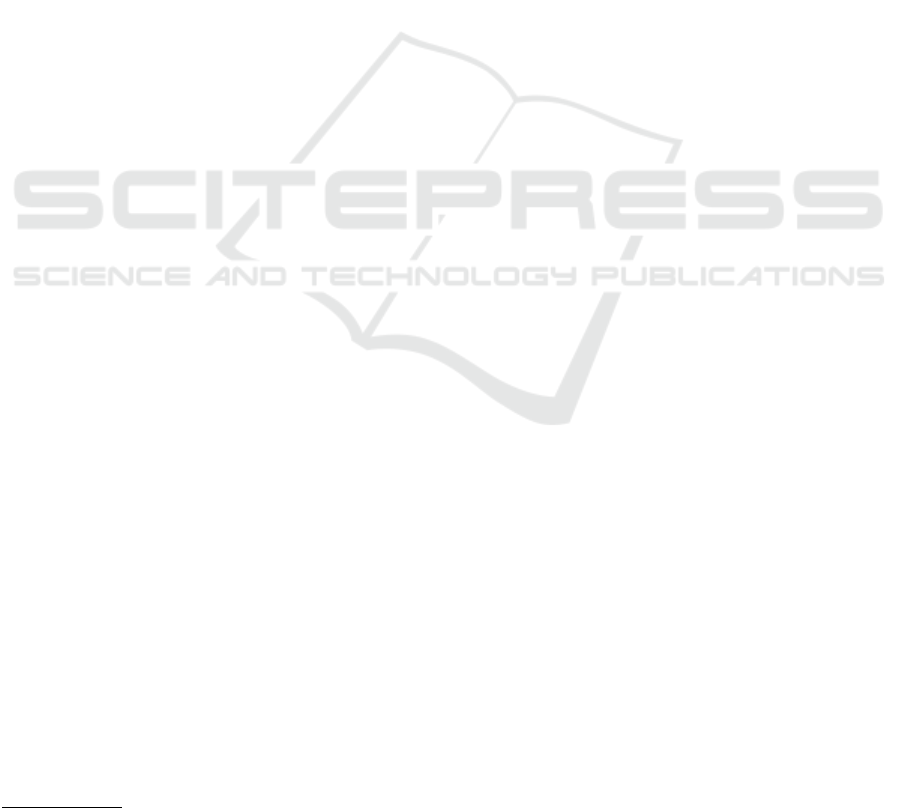
(a) (b) (c)
Figure 1: Blurring effect: (a) 30BLUR, (b) 60BLUR, (c) 90BLUR.
(a) (b) (c)
Figure 2: Gamma correction effect: (a) 0.25GAMMA, (b) 1.5GAMMA, (c) 3.0GAMMA.
as what granularity should be used to prevent the
interference of personal data from load profiles
by using non-intrusive appliance load monitoring
methods. Another approach for preventing occu-
pancy detection from smart meters was proposes
by Chen et al. (2014, 2015).
Eibl et al. (2015) elaborated a set of use cases
for Smart Metering, formulated in a way that is
suitable for the development of privacy enhancing
technologies.
Eibl et al. (2018) also presented a study on holiday
detection from energy consumption data based on
low-resolution smart meter data.
Burkhart et al. (2018) conducted a study where
swimming pools were detected through their filter
pumps in load data with the 15-minute granularity
prescribed by the European Union for smart me-
ters, which demonstrates how vulnerable the pri-
vate information might be through access to the
meter readings data.
3 AWS REKOGNITION VS.
GOOGLE CLOUD VISION
To implement the proposed system, the were select-
ing between two computer vision technologies, AWS
Rekognition vs. Google Cloud Vision. In the below
sections we present the methodology of the compari-
son as well as the details of the conducted study.
3.1 Methodology
Reading utility meters involves several challenges for
application of computer vision technologies: reflec-
tion from the meters’ glass, clipped digits, additional
text on the meter that does not belong to the actual
meter reading, blur, noise, as well as cases, where a
meter has digital representation style for some read-
ings but dial representation for other.
Images for the evaluation data set were selected
based on their “uniqueness” – images with unique
meters or images with unique lighting. A total of 30
images were selected. This set of images were dupli-
cated and modified with various effects in order to test
the limitations of the different technologies. These ef-
fects are:
• Scaling: The data set was scaled in steps of 0.1
ranging from a scale of 0.1 to 0.9 (10% to 90%)
of the original data set.
• Blurring: Blurring was done in steps of 10 from
10 to 90 with an open source blur algorithm that
is based on the normalised box filter, see OpenCV
(2018). The algorithm uses a normalised box fil-
ter, the numeral value adjusts the kernel size. Fig-
ures 1(a)–1(c) present examples of blurring appli-
cation with 30BLUR, 60BLUR, and 90BLUR, re-
spectively.
Easy Mobile Meter Reading for Non-smart Meters: Comparison of AWS Rekognition and Google Cloud Vision Approaches
181
0%
10%
20%
30%
40%
50%
60%
Original
0.8 Scale
0.6 Scale
0.4 Scale
0.2 Scale
3.00 Gamma
2.50 Gamma
2.00 Gamma
1.50 Gamma
0.75 Gamma
0.25 Gamma
0.08 SP
0.16 SP
20 Blur
40 Blur
60 Blur
80 Blur
Average
GCV Accuracy(%)
Figure 3: Google Cloud Vision (GCV) Accuracy.
0%
10%
20%
30%
40%
50%
60%
Original
0.8 Scale
0.6 Scale
0.4 Scale
0.2 Scale
3.00 Gamma
2.50 Gamma
2.00 Gamma
1.50 Gamma
0.75 Gamma
0.25 Gamma
0.08 SP
0.16 SP
20 Blur
40 Blur
60 Blur
80 Blur
Average
AWS R ekog nit ion Accuracy(%)
Figure 4: AWS Recognition Accuracy.
• Gamma: The gamma algorithm was used with
an open source lookup table algorithm OpenCV
(2018). The gamma correction to simulate
different lightning conditions. Figures 2(a)–
2(c) present examples of gamma algorithm ap-
plication with 0.25GAMMA, 1.5GAMMA, and
3.0GAMMA, respectively.
• Noise: The noise algorithm is based upon the
salt and pepper noise algorithm that adds sharp
and sudden disturbances in the image in the form
of sparsely occurring white and black pixels, see
Gonzalez and Woods (2001). This algorithm was
included to further test the performance of the
various technologies as noise arguably emulates
“dirt” on meters.
We calculated the accuracy of recognition calcu-
lated as the following simple formula (we measure the
accuracy in percents, where 100% means a totally ac-
curate recognition):
Accuracy =
CorrectResults
Total
∗ 100 (1)
where
CorrectResults is the number of results that match
with the original readings completely,
Total presents the total number of images in data set.
In our study, we had 30 images in each of the data
sets.
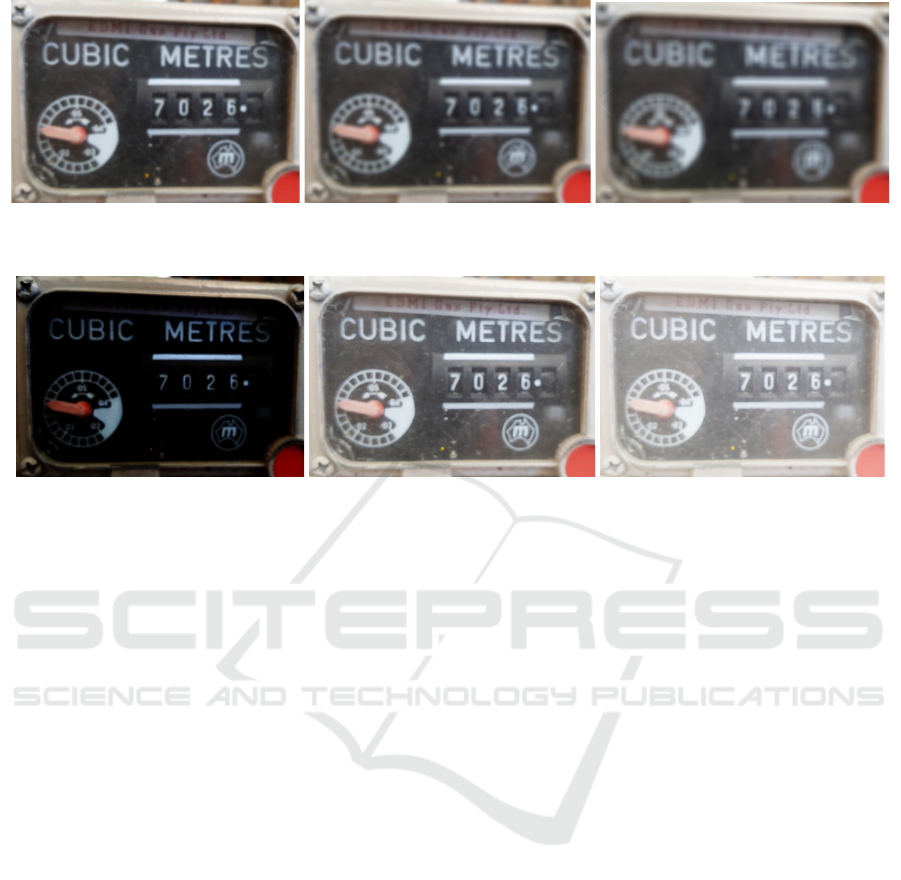
3.2 Results of the Study
The results of the conducted study are summarised on
Figures 3 and 4 for Google Cloud Vision and AWS
Rekognition, respectively. The bar Original presents
the recognition results for the original data set. For
this case, Google Cloud Vision has performed slightly
better than AWS Rekognition having a 3% higher ac-
curacy.
ENASE 2019 - 14th International Conference on Evaluation of Novel Approaches to Software Engineering
182
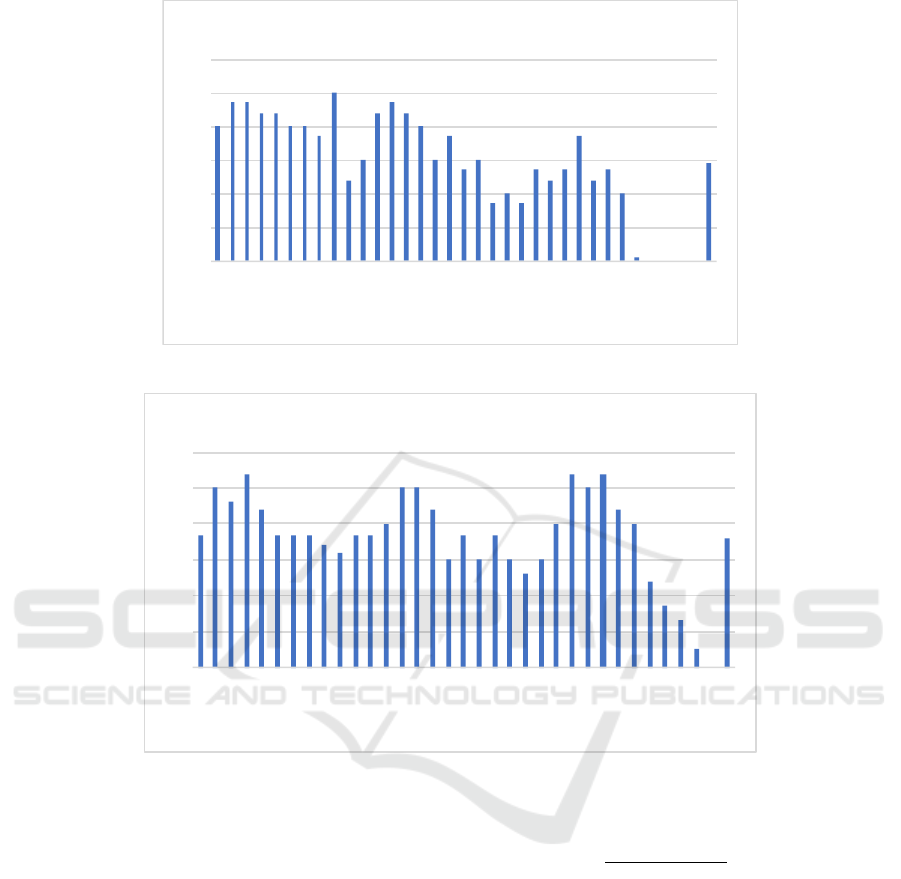
Figure 5: Solution Architecture.
Scale Data Set: There is a variation of 10% in the
accuracy of the two models. AWS Rekognition has
an overall higher efficiency than Google Cloud Vision
with the former performing 10% better than the latter
in every iteration. As the value of scaling is increased,
accuracy is also increasing.
Gamma Dataset: The variation between the two,
in this case, is almost negligible, as both provide an
accuracy of approx. 40%. SP Dataset: AWS Rekogni-
tion outperforms Google Cloud Vision with over 20%
margin in accuracy. As the value of SP increases, so
does the accuracy.
Blur Dataset: This dataset proved to be a chal-
lenge for both the models, with AWS Rekognition
reaching a top accuracy of 50% whereas the Google
Cloud Vision only reached around 37% when blur
level is 10. It dropped down to almost 0% when
it reached around 40% blur in Google Cloud Vision
and 90% blur in the case of AWS Rekognition. Even
with higher blurred images, AWS Rekognition is able
to detect some readings, unlike Google Cloud Vision
where accuracy is 0%.
Thus, on average, AWS Rekognition was able to
perform approx. 7% better than Google Cloud Vision
when same data set was provided.
4 PROPOSED SYSTEM
Figure 5 presents the solution architecture for the
proposed system, where computer vision approaches
are applied to capture meter readings using mobile
phones. These readings should then be passed on to
the core system to update consumer utility-charges
accordingly. Consumers should then be able to
view their renewed charges and usages in an internet
browser. Thus, the mobile application is used to cap-
ture, upload and store an image of the meter to the
system.
The system will then analyse this image to iden-
tify meter readings and return the readings’ values
back to the user for confirmation. Once the user has
confirmed the meter reading, it will be stored on a
blockchain.
The proposed system has two core components
providing interfaces for two user types:
• an Android application developed for customers;
the application was built using React Native,
which provides cross-platform compatibility be-
tween Android and iOS platforms (thus, develop-
ment of an iOS version of the app will be less
time-consuming);
• a Web application developed using ReactJS for
admin users to audit the meter readings.
Mobile application and web application acts as a
clients and call back-end APIs (application program-
ming interfaces) running of Spring Boot. which
is deployed on Amazon Web Services Elastic
Beanstalk Services (2018). AWS Elastic Beanstalk
reduces complexity without restricting choice or con-
trol, as it automatically handles the details of capacity
provisioning, load balancing, scaling, and application
health monitoring.
An example of a Web application page is pre-
sented in Figures 6. Figure 7 presents an examples
of the mobile application pages.
Spring Boot APIs are secured using JSON Web
Token OAuth 2.0 security. The back-end uses Post-
greSQL and Hyperledger Blockchain
3
to store data.
Amazon Web Services (AWS) Rekognition is used
to get the meter reading from the meter image. The
choice of the computer vision technology is justified
by the study presented in Section 3.
3
https://www.hyperledger.org
Easy Mobile Meter Reading for Non-smart Meters: Comparison of AWS Rekognition and Google Cloud Vision Approaches
183
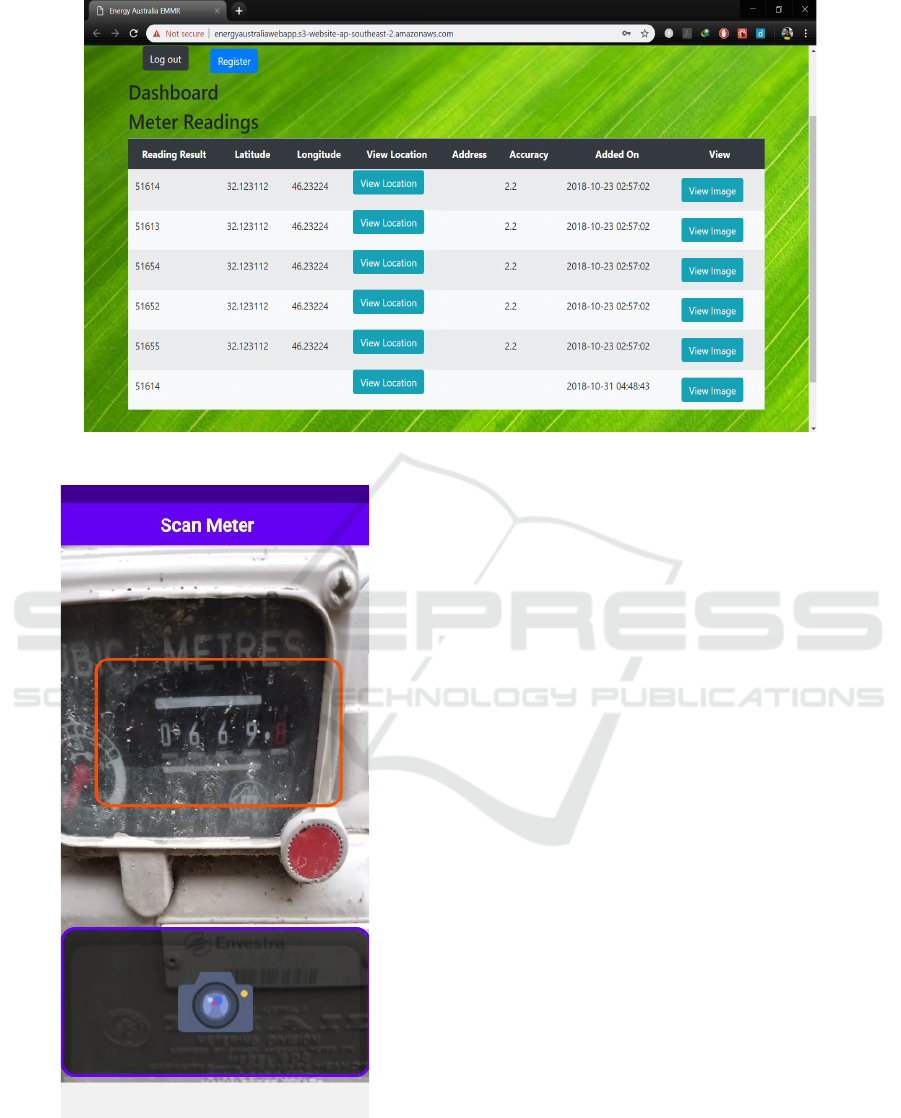
Figure 6: Web Application (Admin): Meter reading results.
Figure 7: Mobile Application (Customer View): Capturing
an image of a meter.
When a customer using the mobile application clicks
an image of the meter (the application uses viewfinder
technology as shown in Figure 7), a Spring Boot API
will be called to filter out the meter readings from the
image and to forward the result to AWS Rekognition,
which returns all the text at the Spring Boot level. Fig-
ure 8 presents an algorithm we elaborated to filter out
all irrelevant data and return only the relevant results
back to the mobile application. The API takes the im-
age URL and the storage bucket (S3) name from the
client and returns the meter reading. Firstly, image
is fetched from the URL and the bucket name, then
the image is passed to the AWS Rekognition library,
which is applied to identify all the text on the image.
The algorithm further filters out all irrelevant text by
considering the user’s last meter reading or the initial
meter reading, which was added to the system when
the corresponding account was created. If the algo-
rithm unable to return the scanned meter reading, it
simply returns the last meter reading to the user, so
that user has to change only the minimal number of
digits.
If the customer is satisfied with the image recogni-
tion results, the customer submits the meter reading,
thus, another API will be called which stores the im-
mutable data into Blockchain and mutable data into
PostgreSQL database. The administrator can use the
Web application to audit the meter readings at any
time. Web application also calls Spring Boot APIs
to get all customer details and their meter readings.
The blockchain also contains an interface from
which the cloud-system can interact with. The cloud-
system provides a portal for administrators, where
they can review customer meter readings through dis-
playing previously uploaded images along with their
respective geo-location coordinates. These features
ENASE 2019 - 14th International Conference on Evaluation of Novel Approaches to Software Engineering
184
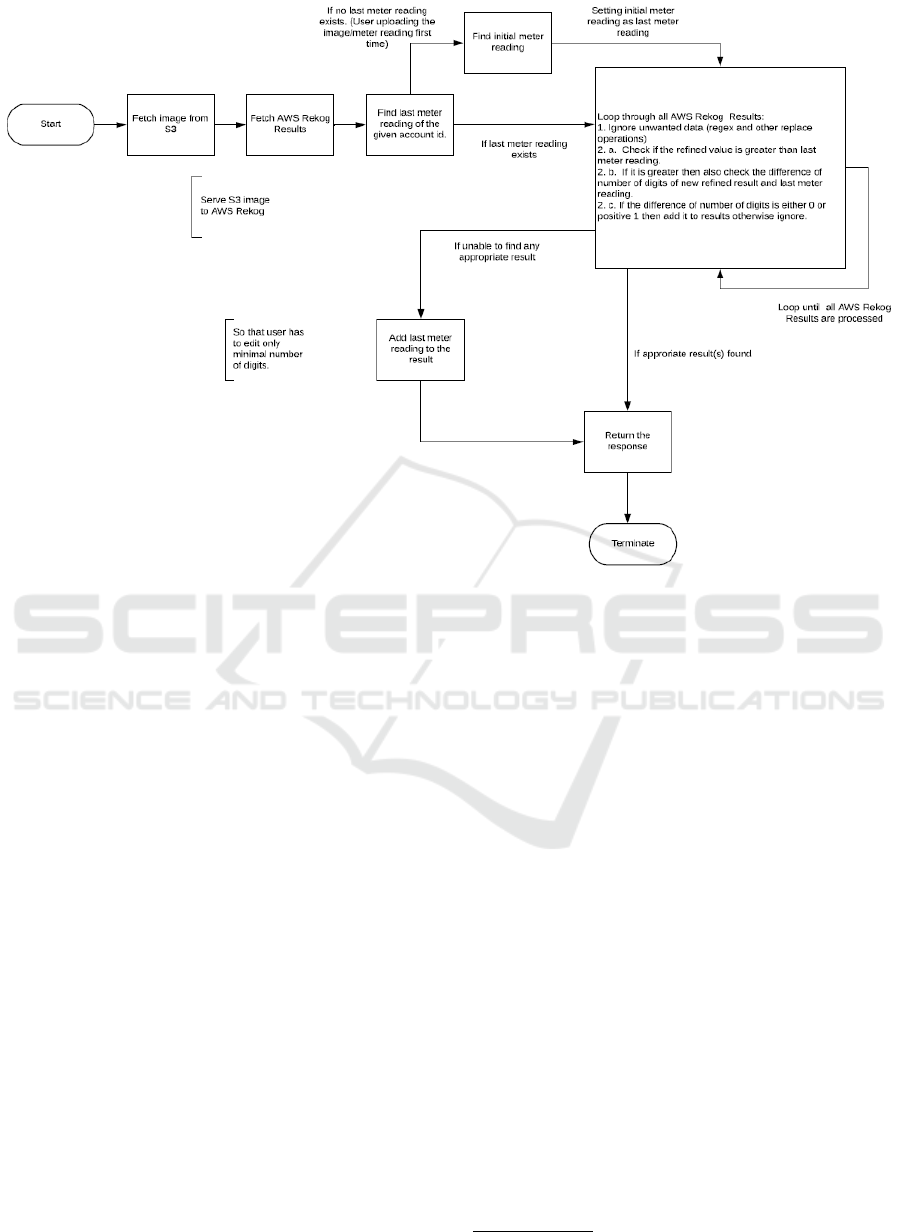
Figure 8: Results Refinement Algorithm for Image Recognition.
provide Energy Australia with a manual method of
detecting falsified readings.
The blockchain component consists of three
nodes, see Figure 9: Customer Node, EA (Energy
Australia) Node and Orderer Node; deployed using
docker containers on three individual EC2 instances
running on Ubuntu 16.04 Xenial Xerus. The peers
are part of the Fabric and represent the node on the
blockchain. Each Node has its own version of the
Ledger using LevelDB. Each node also consists of
MSP (Membership service provide) docker container
used to provide signatures and certificates to new join-
ing entities. Node.js is used on all the instances to
expose the APIs for backend to interact with the Net-
work.
When an update is made to the meter reading by a
customer, it is sent by the customer node to the chan-
nel for verification. The EA node in this case acts
as an endorser to verify the validity of the transac-
tion. The requested transaction is executed on the en-
dorsers’ version of the ledger. Once it is successful,
the transaction for meter reading update is signed and
sent back to the customer node. This signed transac-
tion is then sent to Orderer. Orderer will verify the en-
dorsed signature and wait for the next block to come
up. Once a block is available it will update the me-
ter reading and attach this block to the ledger. The
block is then sent to all the nodes for inclusion in the
Ledger.
Docker
4
containers were used to launch the in-
stances on to AWS EC2 instances. In this case, a
docker container consist of six docker images: for
Customer, for EA (Energy Australia), for Orderer, for
Chaincode, for EAMSP (Energy Australia Member-
ship Service Provider) and for Customer Membership
Service Provider. The Chaincode docker consists of
the channel on which the nodes are interacting and
the latest version of Chaincode installed and instan-
tiated. A simple web page is hosted to display the
amount of transaction that have been committed to
the ledger along with other network specifications. A
shell bash script was written for each AWS EC2 in-
stance to quickly generate all the artefacts required
for Blockchain, to quickly setup and tear down the
network for testing and development and finally for
deployment.
5 CONCLUSIONS
In this paper, we presented the core results of a re-
search project conducted in collaboration with Energy
4
https://www.docker.com
Easy Mobile Meter Reading for Non-smart Meters: Comparison of AWS Rekognition and Google Cloud Vision Approaches
185
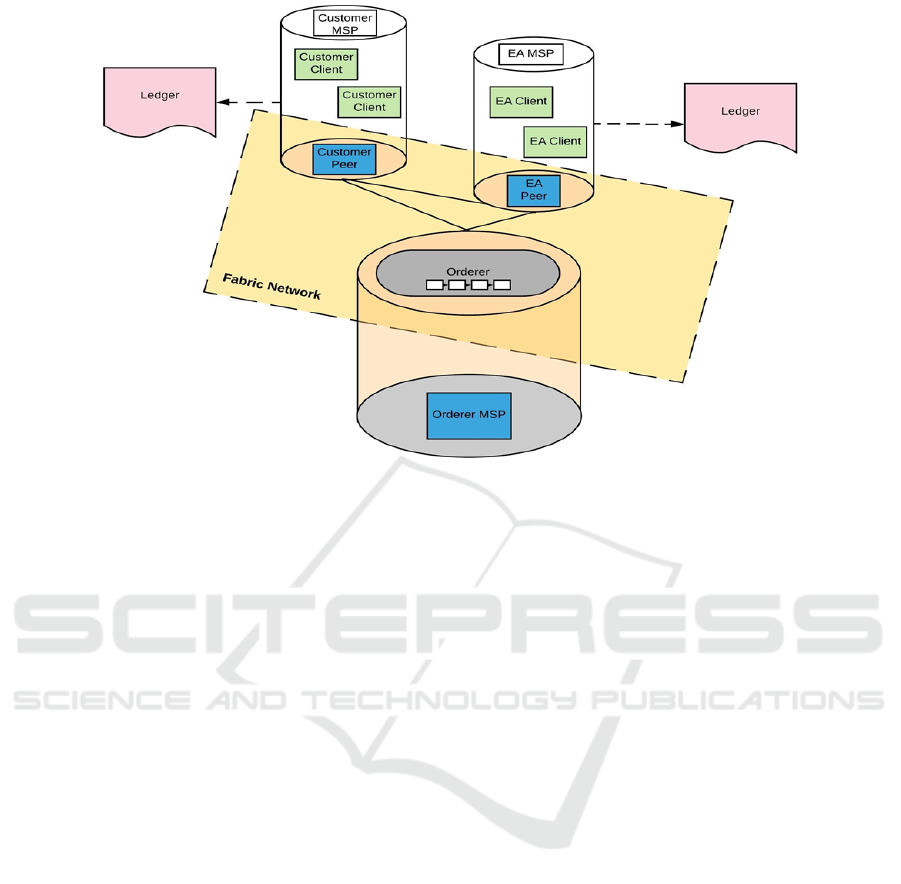
Figure 9: Blockchain Architecture.
Australia, an Australian electricity and gas retailing
company. The goal of the project was to provide a
convenient alternative method for their current me-
ter reading updating system focusing on non-smart
meters. We implemented the proposed system as a
cloud-based solution that applies
• computer-vision technology to identify the meter
readings automatically,
• blockchain technology to store the meter reading
securely.
We conducted a study to compare two computer vi-
sion technologies, Google Cloud Vision and AWS
Rekognition, applied for recognition in utility meter
readings. The study demonstrated that AWS Rekog-
nition provides better results for our application do-
main. Thus, AWS Rekognition was applied within
the proposed system.
The developed system has two interfaces:
• the customer interface: a mobile application for
automated capturing meter readings and manag-
ing the account details, such as customer’s ad-
dress, contact details, as well as the core details
on the electricity and gas meters belonging to the
customer;
• the administrator interface: a web application for
management customers’ accounts, details on the
electricity and gas meters (including geo-location
of the meters), as well as the stored images of the
meter readings.
Future Work: As a possible future work direction
we consider extending the proposed system to allow
incorporation of data from smart meters. This exten-
sion would provide a better overview of customers’
data for further management and analysis, covering
the data collected from both old (non-smart) and new
(smart) meters.
Another direction of our future work is to investi-
gate further computer vision technologies, as the av-
erage accuracy values of Google Cloud Vision and
AWS Rekognition applied for recognition in utility
meter readings were not high. We consider to conduct
a study to analyse the following technologies, also
applied for recognition in utility meter readings: an
open-source Tensorflow technique Abadi et al. (2016,
2017) and a commercial solution Anyline.
ACKNOWLEDGEMENTS
We would like to thank Shine Solutions Group Pty Ltd
for sponsoring this project under the research grant
RE-03615. We also would like to thank Energy Aus-
tralia for collaboration in this project. We also would
like to thank the experts from the Shine Solutions
Group, especially Aaron Brown and Alan Young for
numerous discussions as well as their valuable advice
and feedback.
REFERENCES
Abadi, M., Barham, P., Chen, J., Chen, Z., Davis, A., Dean,
J., Devin, M., Ghemawat, S., Irving, G., Isard, M.,
ENASE 2019 - 14th International Conference on Evaluation of Novel Approaches to Software Engineering
186

et al. (2016). Tensorflow: a system for large-scale
machine learning. In OSDI, volume 16, pages 265–
283.
Abadi, M., Isard, M., and Murray, D. G. (2017). A com-
putational model for tensorflow: an introduction. In
Proceedings of the 1st ACM SIGPLAN International
Workshop on Machine Learning and Programming
Languages, pages 1–7. ACM.
Albert, A. and Rajagopal, R. (2013). Smart meter
driven segmentation: What your consumption says
about you. IEEE Transactions on power systems,
28(4):4019–4030.
Arif, A., Al-Hussain, M., Al-Mutairi, N., Al-Ammar, E.,
Khan, Y., and Malik, N. (2013). Experimental study
and design of smart energy meter for the smart grid.
In 2013 International Renewable and Sustainable En-
ergy Conference (IRSEC), pages 515–520.
Beckel, C., Sadamori, L., Staake, T., and Santini, S. (2014).
Revealing household characteristics from smart meter
data. Energy, 78:397–410.
Benzi, F., Anglani, N., Bassi, E., and Frosini, L.
(2011). Electricity smart meters interfacing the house-
holds. IEEE Transactions on Industrial Electronics,
58(10):4487–4494.
Burkhart, S., Unterweger, A., Eibl, G., and Engel, D.
(2018). Detecting swimming pools in 15-minute
load data. In 17th IEEE International Confer-
ence On Trust, Security And Privacy In Computing
And Communications/12th IEEE International Con-
ference On Big Data Science And Engineering (Trust-
Com/BigDataSE), pages 1651–1655. IEEE.
Chen, D., Barker, S., Subbaswamy, A., Irwin, D., and
Shenoy, P. (2013). Non-intrusive occupancy monitor-
ing using smart meters. In Proceedings of the 5th ACM
Workshop on Embedded Systems For Energy-Efficient
Buildings, pages 1–8. ACM.
Chen, D., Irwin, D., Shenoy, P., Albrecht, J., et al. (2014).
Combined heat and privacy: Preventing occupancy
detection from smart meters. In 2014 IEEE Interna-
tional Conference on Pervasive Computing and Com-
munications (PerCom), pages 208–215. IEEE.
Chen, D., Kalra, S., Irwin, D., Shenoy, P., and Albrecht,
J. (2015). Preventing occupancy detection from smart
meters. IEEE Transactions on Smart Grid, 6(5):2426–
2434.
Chen, Z., Jiang, C., and Xie, L. (2018). Building occupancy
estimation and detection: A review. Energy and Build-
ings.
Christianto, A., Chen, P., Walawedura, O., Vuong, A.,
Feng, J., Wang, D., Spichkova, M., and Simic, M.
(2018). Enhancing the user experience with vertical
transportation solutions. Procedia computer science,
126:2075–2084.
Clunne-Kiely, L., Idicula, B., Payne, L., Ronggowarsito,
E., Spichkova, M., Simic, M., and Schmidt, H.
(2017). Modelling and implementation of humanoid
robot behaviour. In 21st International Conference on
Knowledge-Based and Intelligent Information & En-
gineering Systems, pages 2249–2258. Elsevier Sci-
ence Publishers BV.
Depuru, S. S. S. R., Wang, L., Devabhaktuni, V., and Gudi,
N. (2011). Smart meters for power grid. challenges, is-
sues, advantages and status. In 2011 IEEE/PES Power
Systems Conference and Exposition, pages 1–7. IEEE.
Ehrke, L. A., Nap, K. A., and Dresselhuys, D. R. (2003).
Electronic electric meter for networked meter reading.
US Patent 6,538,577.
Eibl, G., Burkhart, S., and Engel, D. (2018). Unsupervised
holiday detection from low-resolution smart metering
data. In 4th International Conference on Information
Systems Security and Privacy (ICISSP), pages 477–
486.
Eibl, G. and Engel, D. (2015). Influence of data granularity
on smart meter privacy. IEEE Transactions on Smart
Grid, 6(2):930–939.
Eibl, G., Engel, D., and Neureiter, C. (2015). Privacy-
relevant smart metering use cases. In Industrial Tech-
nology (ICIT), 2015 IEEE International Conference
on, pages 1387–1392. IEEE.
Gonzalez, R. C. and Woods, R. E. (2001). Digital Im-
age Processing. Addison-Wesley Longman Publish-
ing Co., Inc., 2nd edition.
Grady, B. D., Vaswani, R., and Pace, J. (2016). Method and
system of reading utility meter data over a network.
US Patent 9,464,917.
Jenney, W. P., Szydlowski, L. G., Ferguson, R. D., and
Potaczala, C. A. (1999). Automatic meter reading sys-
tem. US Patent 5,897,607.
Kelley, R. H., Carpenter, R. C., Lunney, R. H., and Mar-
tinez, M. (2000). Automated meter reading system.
US Patent 6,088,659.
Kleiminger, W., Beckel, C., Staake, T., and Santini, S.
(2013). Occupancy detection from electricity con-
sumption data. In Proceedings of the 5th ACM
Workshop on Embedded Systems For Energy-Efficient
Buildings, pages 1–8. ACM.
Knight, N. E. and Banks, D. M. (1998). Remote meter read-
ing system. US Patent 5,852,658.
Kuzlu, M., Pipattanasomporn, M., and Rahman, S.
(2014). Communication network requirements for
major smart grid applications in han, nan and wan.
Computer Networks, 67:74–88.
Masoudifar, N., Hammad, A., and Rezaee, M. (2014). Mon-
itoring occupancy and office equipment energy con-
sumption using real-time location system and wireless
energy meters. In Simulation Conference (WSC), 2014
Winter, pages 1108–1119. IEEE.
Michael, J., Cohn, A., and Butcher, J. (2018). Blockchain
technology. The Journal.
Nap, K. A., Ehrke, L. A., and Dresselhuys, D. R. (2001).
Automatic meter reading data communication system.
US Patent 6,246,677.
OpenCV (2018). Open source computer vision. https:
//docs.opencv.org/3.1.0.
Rathod, R. R. and Garg, R. D. (2016). Regional electricity
consumption analysis for consumers using data min-
ing techniques and consumer meter reading data. In-
ternational Journal of Electrical Power & Energy Sys-
tems, 78:368–374.
Sankar, L., Rajagopalan, S. R., and Mohajer, S. (2013).
Smart meter privacy: A theoretical framework. IEEE
Transactions on Smart Grid, 4(2):837–846.
Easy Mobile Meter Reading for Non-smart Meters: Comparison of AWS Rekognition and Google Cloud Vision Approaches
187

Services, A. W. (2018). AWS Elastic Beanstalk: Developer
Guide. Amazon Digital Services LLC.
Simic, M., Spichkova, M., Schmidt, H., and Peake, I.
(2016). Enhancing learning experience by collabo-
rative industrial projects. In ICEER 2016, pages 1–8.
Western Sydney University.
Spichkova, M. (2018). Automated analysis of the impact of
weather conditions on medicine consumption. In 2018
25th Australasian Software Engineering Conference
(ASWEC), pages 166–170. IEEE.
Spichkova, M., Bartlett, J., Howard, R., Seddon, A., Zhao,
X., and Jiang, Y. (2018). Smi: Stack management
interface. In 23rd International Conference on En-
gineering of Complex Computer Systems (ICECCS),
pages 156–159.
Spichkova, M. and Simic, M. (2017). Autonomous systems
research embedded in teaching. In Intelligent Interac-
tive Multimedia Systems and Services, pages 268–277.
Springer.
Sun, C., Zhang, J., Liu, C., King, B. C. B., Zhang, Y., Galle,
M., Spichkova, M., and Simic, M. (2018). Software
development for autonomous and social robotics sys-
tems. In International Conference on Intelligent Inter-
active Multimedia Systems and Services, pages 151–
160. Springer.
Swan, M. (2015). Blockchain: Blueprint for a new econ-
omy. ” O’Reilly Media, Inc.”.
Tan, O., Gunduz, D., and Poor, H. V. (2013). Increasing
smart meter privacy through energy harvesting and
storage devices. IEEE Journal on Selected Areas in
Communications, 31(7):1331–1341.
Tang, G., Wu, K., Lei, J., and Xiao, W. (2015). The meter
tells you are at home! non-intrusive occupancy de-
tection via load curve data. In Smart Grid Communi-
cations (SmartGridComm), 2015 IEEE International
Conference on, pages 897–902. IEEE.
Winter, D. (2017). Methods and systems of reading utility
meters and methods and systems of transmitting util-
ity meter data. US Patent 9,752,895.
Xiao, Z., Xiao, Y., and Du, D. H.-C. (2013). Exploring ma-
licious meter inspection in neighborhood area smart
grids. IEEE Trans. Smart Grid, 4(1):214–226.
Yaacoub, E. and Abu-Dayya, A. (2014). Automatic meter
reading in the smart grid using contention based ran-
dom access over the free cellular spectrum. Computer
Networks, 59:171–183.
Yan, Y., Hu, R. Q., Das, S. K., Sharif, H., and Qian, Y.
(2013a). An efficient security protocol for advanced
metering infrastructure in smart grid. IEEE Network,
27(4):64–71.
Yan, Y., Qian, Y., Sharif, H., and Tipper, D. (2013b). A
survey on smart grid communication infrastructures:
Motivations, requirements and challenges. IEEE com-
munications surveys & tutorials, 15(1):5–20.
Yang, L., Ting, K., and Srivastava, M. B. (2014). Infer-
ring occupancy from opportunistically available sen-
sor data. In Pervasive Computing and Communica-
tions (PerCom), 2014 IEEE International Conference
on, pages 60–68. IEEE.
Zheng, J., Gao, D. W., and Lin, L. (2013). Smart meters
in smart grid: An overview. In Green Technologies
Conference, pages 57–64. IEEE.
Zheng, Z., Xie, S., Dai, H.-N., Chen, X., and Wang, H.
(2018). Blockchain challenges and opportunities: A
survey. International Journal of Web and Grid Ser-
vices, 14(4):352–375.
ENASE 2019 - 14th International Conference on Evaluation of Novel Approaches to Software Engineering
188
