
Rainfall Distribution Trend Analysis of the Philippine National
Capital Region (2013-2016)
Miguel Aaron M. Bobadilla, Ryan Gabriel A. Eugenio and Maria Teresa R. Pulido
Department of Physics, Mapúa University, Intramuros, Manila City, 1002, Philippines
Keywords: Natural Science as a Service (NSaaS), Weather Forecasting, Decision as a Service, Big Data as a Service
(BDaaS), Big Data Algorithm, Trend Analysis, Rainfall Distribution, Mann-Kendall Test.
Abstract: The Philippine archipelago is a tropical country that experiences only two major seasons annually: wet
(June-November) and dry (December-May). Due to these conditions, the country is bound to experience
significant amounts of rainfall, followed by drought. Hence, studying long-term rainfall trends is highly
beneficial for the country’s livelihood and safety. In this work, we studied the rainfall distribution in the
National Capital Region covering the period of 2013 to 2016, and analysed the data using the Mann-Kendall
Test and the Bootstrap procedure. Using a monthly scale, we found a negative trend, signifying a decrease
in rainfall amount over the four years of data. Interestingly, we found a positive trend using a yearly scale,
showing an increase of rainfall overall. Therefore it is quite risky to generalize a certain region's rainfall
condition just by looking at it annually, but must consider as well its seasonal and monthly phenomena for a
more detailed analysis. We note also that the area being studied was considerably large and the rainfall data
varied with the location of the weather station where it was obtained. This work demonstrates the potential
of using Big Data and the Internet of Things to measure and predict weather trends using various sensors
and processors.
1 INTRODUCTION
The Philippines in general experiences most often
record breaking typhoons as years go by which
brings heavy rainfalls that consequently destroys a
lot of properties mainly its agricultural resources
which lead to production losses (Lansigan, 2013;
Cinco, et al., 2016).
Because of this, rainfall activity poses a great
point of attention in making a good preparation of
what's to come to our distant future. This kind of
study has actually been constantly the point of
change assumption in a span of 30-65 years in the
making particularly about climate change itself
(Cinco, 2018). The climate trends accounted in the
said studies also made use of the Mann-Kendall non-
parametric test since it's basically used for
identifying trends in time series data.
To further supplement this concept, we made use
of the Bootstrap procedure used to study rainfall
trends in Sicily (Cannarozzo, et al, 2006). The trends
found within a span of several years will be
categorized in a temporal manner (yearly, monthly),
eliminating the autocorrelation of time series data
that defeats an essential application of Mann-
Kendall Test.
The Philippine Atmospheric, Geophysical,
Astronomical Services Administration (PAGASA) is
the national agency mandated to “provide protection
against natural calamities and utilize scientific
knowledge as an effective instrument to insure the
safety, well-being and economic security of all the
people, and for the promotion of national progress”
(Presidential Decree No. 1149, 1977). This agency
has gathered, among many others, rainfall data over
several years and has made it public via the Freedom
of Information website (https://www.foi.gov.ph/).
We chose to collect data regarding the Philippine
National Capital Region (NCR) due to its political
and economic significance.
2 METHODOLOGY
2.1 Dataset
We used the rainfall data collected from three
PAGASA weather stations located in the NCR
370
Bobadilla, M., Eugenio, R. and Pulido, M.
Rainfall Distribution Trend Analysis of the Philippine National Capital Region (2013-2016).
DOI: 10.5220/0007750303700375
In Proceedings of the 4th International Conference on Internet of Things, Big Data and Security (IoTBDS 2019), pages 370-375
ISBN: 978-989-758-369-8
Copyright
c
2019 by SCITEPRESS – Science and Technology Publications, Lda. All rights reserved
(Ninoy Aquino International Airport in Pasay City,
Science Garden in Quezon City, and Port Area in
Manila). These data were made available to the
public via the Freedom of Information website.
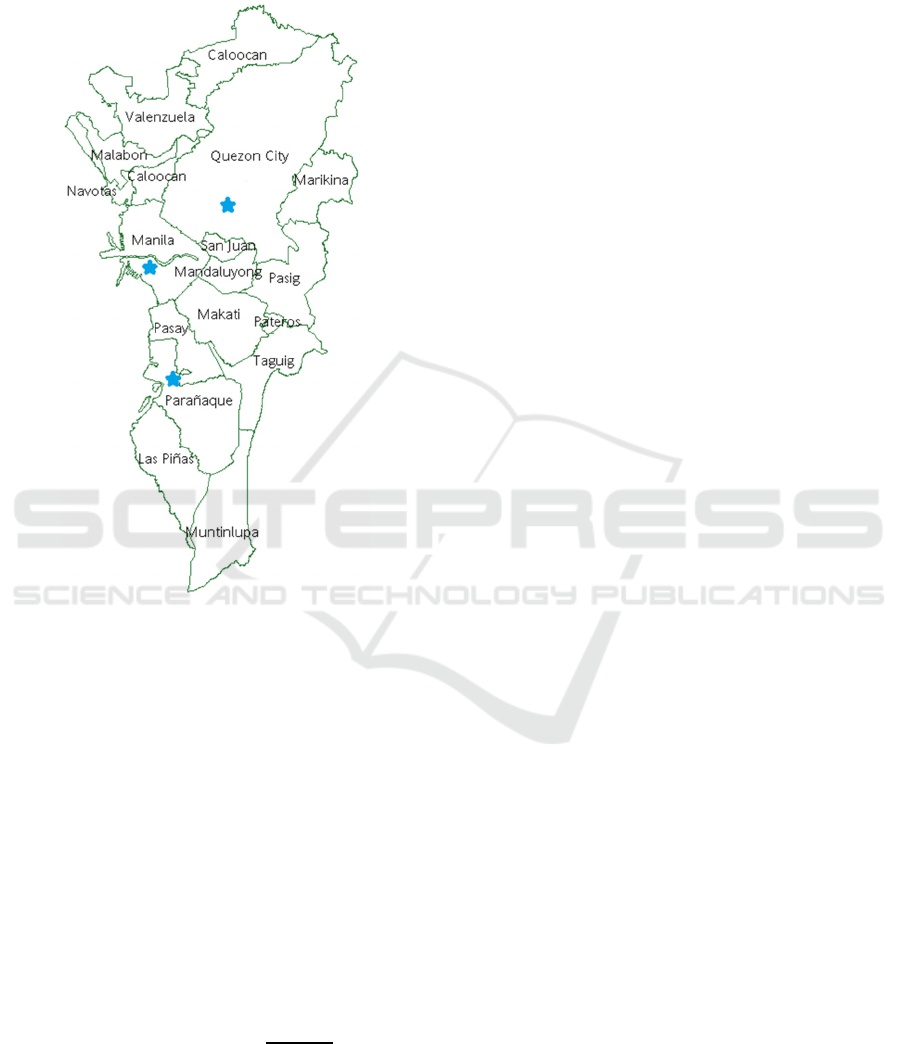
Figure 1: NCR Map showing 3 PAGASA weather
stations: Science Garden in Quezon City, Port Area in
Manila City, and NAIA in Pasay City.
The four year-long daily data acquired from
PAGASA are designated in the three following
weather stations as shown in Figure 1. From these
selected stations, only NAIA station have missing
data comprised of about 0.55% of its total and the
consequent changes from over all stations shown
were expressed in terms of its average monthly and
annual rainfall amount.
To further show the variability of data, modified
version of Oliver's Precipitation Concentration Index
(PCI) (Oliver, 1980) was used which analyzes
yearly, as well as monthly heterogeneity of rainfall
amounts. This index is described as:
100∙
∑
∑
(1)
where p
i
is the rainfall amount for the i
th
order of n
which is either equal to twelve if analyzed annually
and 29, 30, or 31 if the case is monthly analyzed.
The resulting PCI with values below 10 is said to be
uniform throughout the particular time scale, while
for 11 to 20 values would mean seasonality in
rainfall amounts, and values of 20 above
corresponds to substantial variability in the specific
time scale.
2.2 Trend Detection
The Mann-Kendall (MK) test is often used to detect
trends in a time series dataset with no apparent
pattern, such as rainfall. MK does not require the
data to be normally distributed, making it a non-
parametric or distribution-free test. In using the MK
test, we assume that there is no trend present, that
the observations over time are representative of the
true conditions at sampling times, and that the data
to be analyzed is unbiased and representative of the
underlying populations over time (Mann, 1945). Our
assumed Null Hypothesis (H
0
) is that there is no
existing trend from the rainfall data, while the
Alternative Hypothesis (H
1
) is that there is an actual
monotonic trend existing in the data. To either
accept or reject these hypotheses, we have
∑∑
(2)
and specifically,
signT
T
1ifT
T
0
0ifT
T
0
1ifT
T
0
(3)
where T
j
and T
i
are the values in the times j and i
respectively, j > i. A positive value of S implies that
a majority of the differences between earlier and
later measurements are positive, suggestive of an
upward trend over time. Likewise, a negative value
for S implies that a majority of the differences
between earlier and later values are negative,
suggestive of a decreasing trend. A value near zero
indicates a roughly equal number of positive and
negative differences.
In conjunction with the MK test is the bootstrap
procedure or approach which counteracts the
correlation of time series data of rainfall amounts.
We extract randomly one year of a time series,
rearrange randomly the data for that particular year,
then compare the resulting statistic S to the original
unarranged data for the year.
Rainfall Distribution Trend Analysis of the Philippine National Capital Region (2013-2016)
371
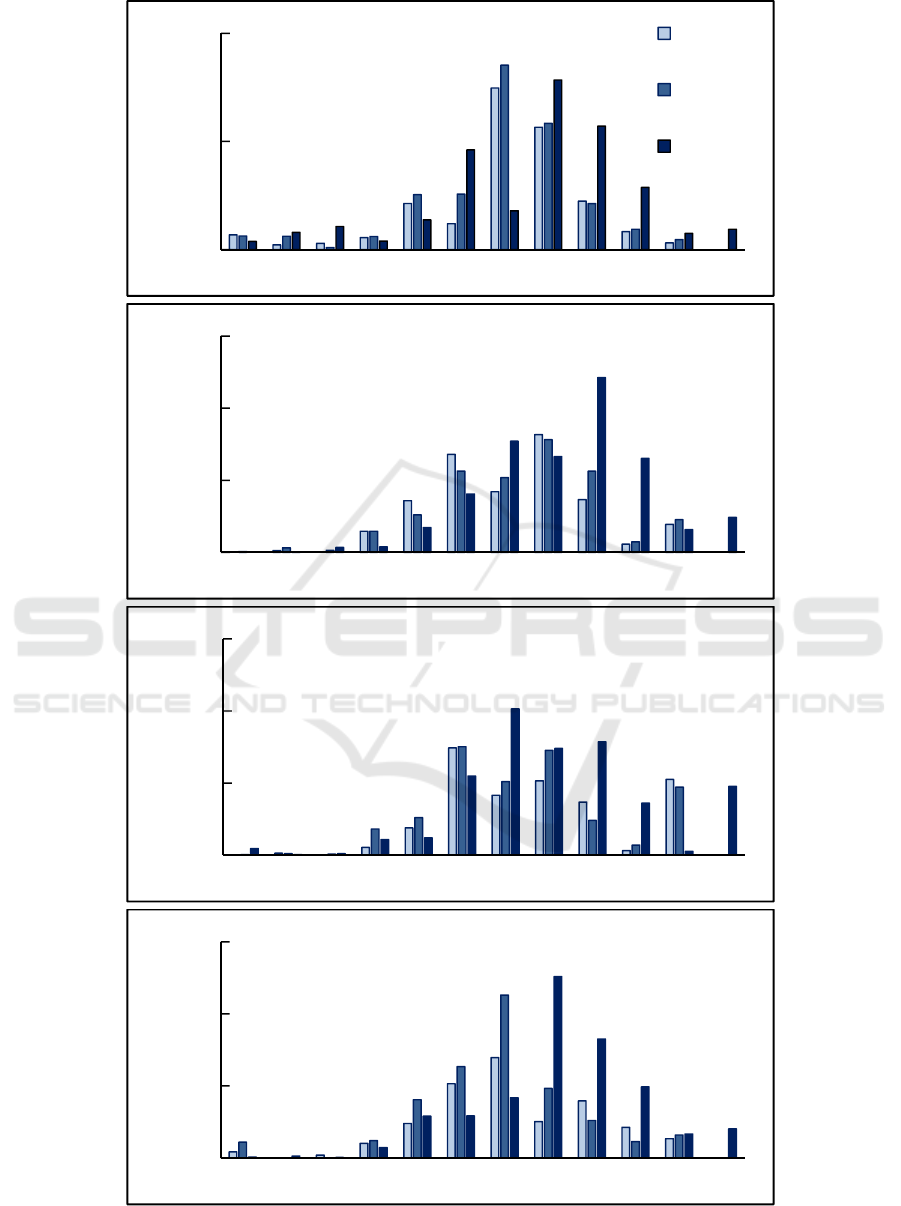
Figure 2: Daily rainfall in NCR averaged on a monthly basis.
0
20
40
Jan Feb Mar Apr May Jun Jul Aug Sep Oct Nov Dec
Rainfall (mm)
Average Rainfall - 2013
NAIA
Port Area
Science
Garden
0
10
20
30
Jan Feb Mar Apr May Jun Jul Aug Sep Oct Nov Dec
Rainfall (mm)
Average Rainfall - 2014
0
10
20
30
Jan Feb Mar Apr May Jun Jul Aug Sep Oct Nov Dec
Rainfall (mm)
Average Rainfall - 2015
0
10
20
30
Jan Feb Mar Apr May Jun Jul Aug Sep Oct Nov Dec
Rainfall (mm)
Average Rainfall - 2016
IoTBDS 2019 - 4th International Conference on Internet of Things, Big Data and Security
372
3 RESULTS AND DISCUSSION
The daily rainfall was averaged over each month and
shown in Figure 2. Rainfall is seen to coincide with
the seasonal rainfall patterns prominent in the
months of June to November (wet season) and
December to May (hot season). Such trends are seen
more clearly in Figure 3, which averages the
monthly data from the three stations.
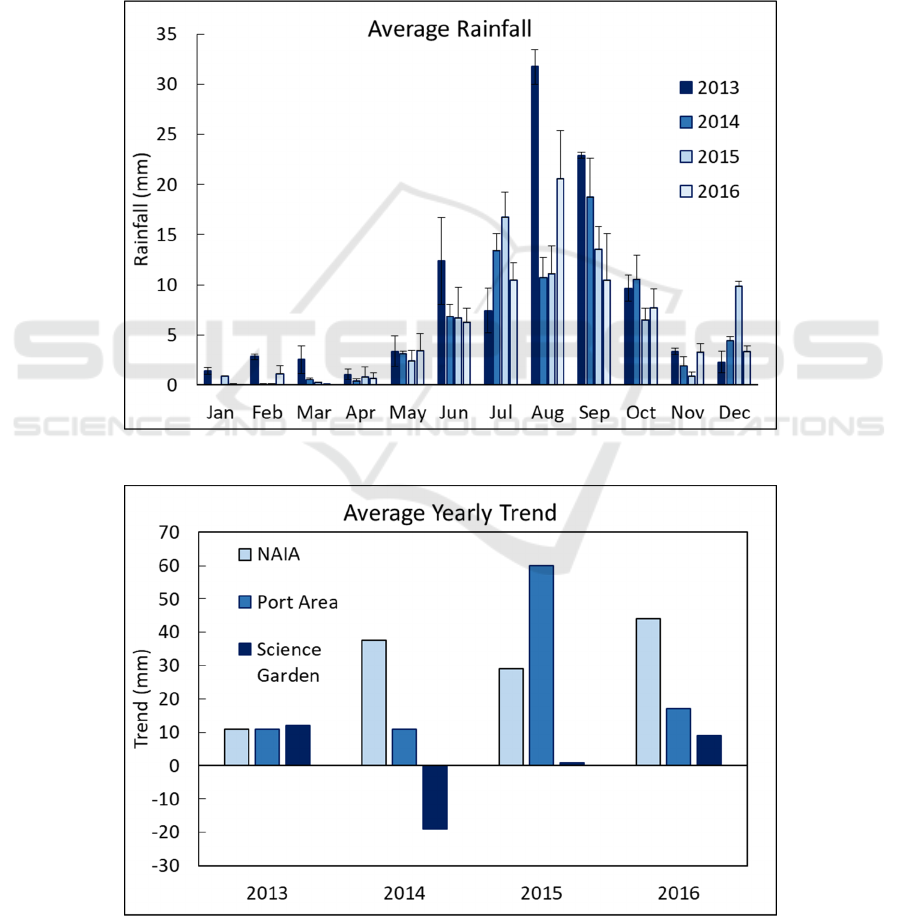
The trends in Figures 2 and 3 displayed
consistency with minor differences between years.
These differences are further expounded with the
PCI calculations and the MK test trends. In
particular, the yearly scaled trends in Figure 4
greatly vary when compared with the monthly scaled
trends in Figure 5. We note that the same method of
obtaining trends yields quite different results when
scaled over different time periods, which reminds us
to choose the region and scope of interest
appropriate to our study.
Figure 3: Daily rainfall in NCR averaged monthly for the three PAGASA stations.
Figure 4: Average yearly trend of rainfall in NCR for the three PAGASA stations.
Rainfall Distribution Trend Analysis of the Philippine National Capital Region (2013-2016)
373
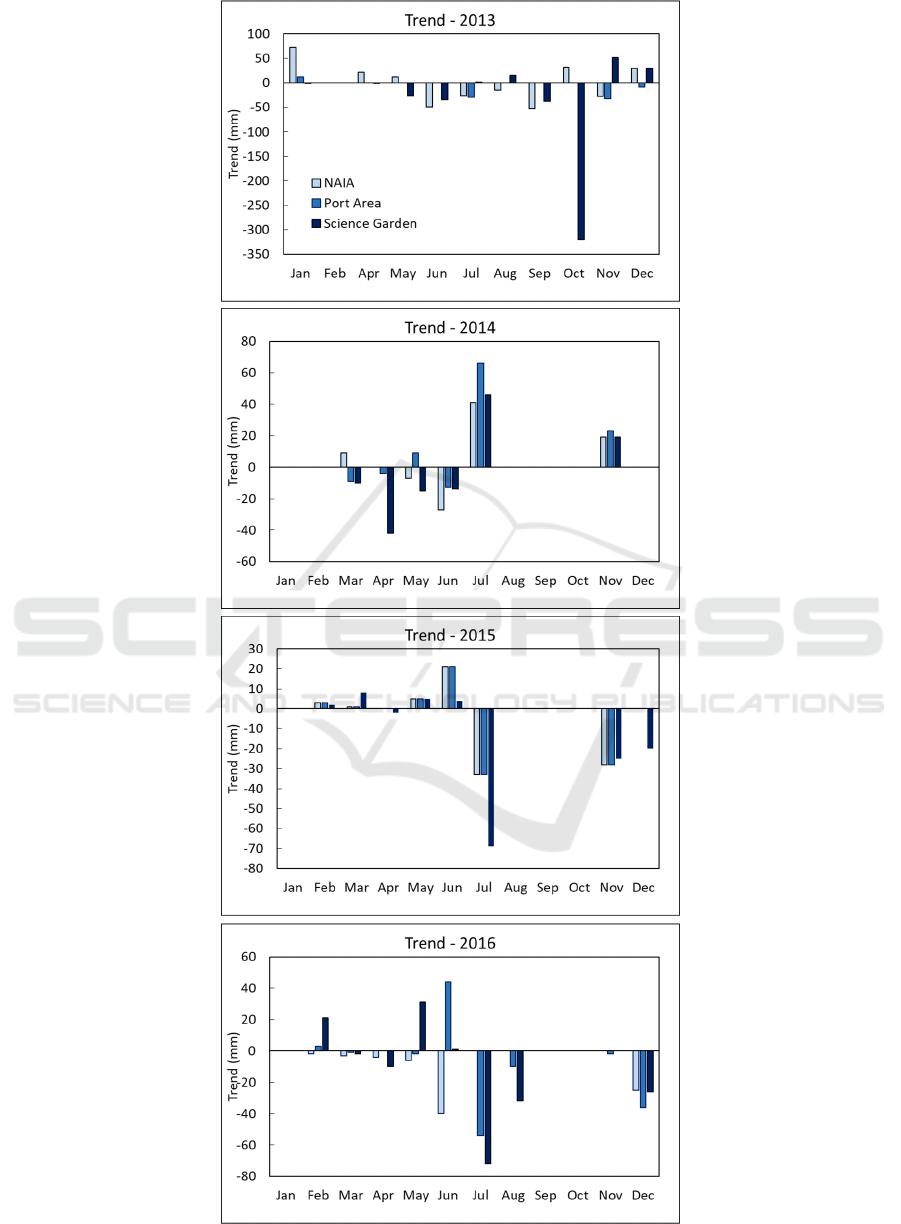
Figure 5: Monthly scaled trends in rainfall data.
IoTBDS 2019 - 4th International Conference on Internet of Things, Big Data and Security
374

While the trends vary with the location of the
weather station, the yearly and monthly trends are
generally the same for all locations. For rainfall data,
monthly trends are more accurate than yearly trends,
since the former are more finely resolved and show
the variability of rainfall in the Philippines within a
year. The next step would be to use these trends to
predict data for the succeeding years, and determine
the presence of climate change with regard to
Philippine rainfall.
4 CONCLUSIONS
We can conclude that the MK Test is a very useful
tool for analyzing rainfall and other meteorological
data, which is optimized via Bootstrap resampling.
The analysis made over the NCR is fruitful since the
trends on temporal scale were successfully shown.
The variance in monthly and yearly trends remind us
of the inherent seasonal variability of rainfall within
a year for the Philippines. The specific location is
still an important factor in characterizing the
distribution for areas as large as the Philippine NCR.
We can extend this study using the remaining
PAGASA weather stations around the Philippines,
as well as other data sources. The emergence of Big
Data and the Internet of Things gives researchers
access to an unprecedented wealth of meteorological
data as well as the tools to measure possible trends
and predict future ones.
ACKNOWLEDGEMENTS
We thank the Philippine Atmospheric, Geophysical
and Astronomical Services Administration
(PAGASA) and the Freedom of Information website
for the rainfall data, the Mapúa University
Yuchengco Innovation Center for the resources in
preparing this manuscript, and our colleagues and
loved ones for their support. We also thank the
organizers of the IoTBDS 2019 Conference for
accepting this work and for the financial support.
REFERENCES
Cannarozzo, M., Noto, L.V. & Viola, F., 2006. Spatial
distribution of rainfall trends in Sicily (1921–2000).
Physics and Chemistry of the Earth, Parts A/B/C,
31(18), pp. 1201-1211.
Cinco, T. A., et al., 2016. Observed trends and impacts of
tropical cyclones in the Philippines. International
Journal of Climatology, 36(14), pp. 4638-4650.
Cinco, T. A., 2018. Observed Climate Change and
Projected Climate Change in the Philippines. [Online]
Available from: https://designingresilience.ph/wp-
content/uploads/day-1-observed-climate-trends-and-
projected-climate-change-in-the-philippines-pagasa-
15lzz9-file.pdf [Accessed 30 December 2018].
Lansigan, F. P., 2013. Climate risk for weather index-
based insurance for crop production in the
Philippines. [Online] Available from http://nap.psa.
gov.ph/ncs/12thncs/papers/INVITED/IPS-01%20Envi
ronment%20and%20Natural%20Resources%20Statisti
cs%20including%20Climate%20Change%20I/IPS-01
_1%20Climate%20Risk%20for%20Weather%20Index
-Based%20Insurance%20for%20Crop%20Production
%20in%20the%20Philippines.pdf [Accessed 30
December 2018].
Mann, H. B., 1945. Nonparametric tests against trend.
Econometrica: Journal of the Econometric Society,
pp.245-259.
Oliver, J. E., 1980. Monthly precipitation distribution: a
comparative index. The Professional Geographer
32(3), pp. 300–309.
Presidential Decree No. 1149 1977 (Establishing the
Philippine Atmospheric Geophysical and
Astronomical Services Administration), Malacanang,
Manila.
Rainfall Distribution Trend Analysis of the Philippine National Capital Region (2013-2016)
375
