
Potential of Supermarket Refrigeration Systems for Grid Balancing by
Demand Response
Tommie M˚ansson
a
and York Ostermeyer
b
Architecture and Civil Engineering Dept., Chalmers University of Technology, Sven Hultins Gata 6, Gothenburg, Sweden
Keywords:
Supermarket, Demand Side Management, Demand Response, Energy Storage, Smart Grid.
Abstract:
The environmental goals of European Union demand a larger share of renewable energy sources for electrical
energy generation. With the increasing share of renewable energy sources such as solar and wind, the utility
grids has an increasing need for energy storage and/or demand side management. With a high energy intensity
and a large thermal inertia, the refrigeration systems of supermarkets appear as an attractive actor for demand
response in such scenario. Theoretically they have the capability to absorb vast amounts of electrical energy
as stored compressor work, lowering the temperature of the food goods in the refrigerators. Alternatively
supermarkets have the capability of reducing their energy demand by allowing the food goods temperature
increase to its upper limit, reducing electrical power demand for the grid. This positioning paper will further
discuss the attractiveness as and feasibility to use supermarkets for electrical energy balancing by demand
response in a smart grid.
1 BACKGROUND
The European Union (EU) Commission launched the
European Climate Change Programme in 2000 to de-
velop strategies to implement the Kyoto protocol in
EU. In short the programme aim is to reduce the
release of anthropogenic greenhouse gases (GHG)
to the atmosphere and thereby mild the effects of
global warming and climate change. The commit-
ment was further strengthened by the Paris agreement
from COP21 in 2015 where 195 UNFCCC members
agreed to limit the global warming to less than 2
◦
C,
while aiming at 1.5
◦
C compared to pre-industrial lev-
els.
EU has set ambitious goals towards a more sus-
tainable future and by 2050 EU aims to reduce the
GHG emissions by 80 − 95% compared to 1990 lev-
els(European Commission, 2012). The EU is pur-
suing these goals through both financial support and
revised regulations as will briefly be introduced be-
low(Union and Action, 2017). Milestones for 2020 is
a 20% reduction in GHG, 20% reduced energy usage
and a 20% increased energy efficiency.
The financial support is agreed as at least 20% of
the EU’s budget for 2014 to 2020 (e 180 billion) shall
a
https://orcid.org/0000-0003-1536-8484
b
https://orcid.org/0000-0001-7285-2737
be spent on actions helping to achieve the ambitious
goals for 2050(European Union, 2018). Additionally
individual countries and company initiatives are also
funding parallel actions and projects.
The introduction of EU emissions trading system
in 2005 that limits the maximum amount of GHG that
the EU countries is allowed to release has created
a platform for businesses to trade with their GHG-
reduction. Companies and countries can trade their
rights to release GHG, which becomes an incentive to
reduce emission to increase profit.
Additionally, all EU countries are required to sup-
port renewable energy generation such as solar, wind
and biomass as a part of the Green energy targets.
Following the Revised Energy Directives (REDII) the
EU should have reached an overall share of 27% of
renewable energy by 2030, with some members per-
forming significantly better(Comission, 2018). How-
ever, an increased share of uncontrollable and slower
responding renewable energy sources creates an issue
for the utility grid to balance the supply and demand.
In a traditional electrical grid, the supply is
adapted to the demand by adjusting the electrical en-
ergy generation. The variations are often balanced
by the use of smaller gas turbines, hydroelectric etc.
that has the possibility to adjust their power outtake
rapidly. However, gas turbines most commonly are
using fossil fuels and the hydroelectric capacity is
Månsson, T. and Ostermeyer, Y.
Potential of Supermarket Refrigeration Systems for Grid Balancing by Demand Response.
DOI: 10.5220/0007749401510156
In Proceedings of the 8th International Conference on Smart Cities and Green ICT Systems (SMARTGREENS 2019), pages 151-156
ISBN: 978-989-758-373-5
Copyright
c
2019 by SCITEPRESS – Science and Technology Publications, Lda. All rights reserved
151

geographically limited to regions with a satisfying
topology.
Therefore in a national, continental or global sce-
nario where the share renewable energy sources are
increased and the use of fossil fuels are to be min-
imised, these problems of balancing will become
more severe. Implementing energy storage in com-
bination with demand side management to adapt the
demand to the available supply of energy is therefore
needed (Farhangi, 2010).
1.1 Needed Energy Storage and
Demand Response
In Germany, the implementation of renewable energy
sources has been progressing in accordance with the
goals of EU and the need of storage solutions in in-
creasing. In (Sinn, 2017) the author concludes a stor-
age capacity demand of 5, 800 GWh at 68% share of
renewable energy and 16,300 GWh with a share of
89% for the German context. In (Zerrahn et al., 2018)
the authors instead conclude a 55 GWh need at a 68%
share, and a 436 GWh need at 88% share. Already
today and since years back Germany is facing issues
with balancing the grid, resulting in negative electri-
cal energy tariff(Deloitte, 2015).
If batteries or pumped hydro is used, it has the
capability of storing electrical energy to be released
later, but it is costly and also the materials used in bat-
teries has a negative environmental impact(Sand´en,
2014).
By introducing demand side response, the
needed storage capacity will be lowered accord-
ingly(Balijepalli et al., 2011). Instead of demanding
energy when there is a deficit, the energy user will
postpone the demand to a more favourable time for
the supply side.
(Haider et al., 2016) ,(Costanzo, 2015) , (Gelazan-
skas and Gamage, 2014) ,(Gelazanskas and Gamage,
2014) and (Baharlouei and Hashemi, 2013) amongst
others have discussed the benefits and challenges with
demand response. They conclude one challenge to be
the communication between a vast amount of appli-
ances to schedule their loads optimally. By identify-
ing large and energy intense systems, the amount of
involved units can be reduces and this challenge is
thereby reduced.
This is where supermarkets and their refrigera-
tion systems appears as an attractive actor (M˚ansson
and Ostermeyer, 2013)(Funder,2015)(Pedersen et al.,
2014)(Hovgaard et al., 2011).
2 POTENTIAL DEMAND
RESPONSE BY
SUPERMARKETS
Supermarkets are inherently intense energy users due
to all food goods that demands refrigeration (Tassou
et al., 2011). The thermal inertia of the refrigeration
system is a great benefit as it would allow the super-
market to “charge” by transforming electrical energy
into stored compressor work by temperature reduc-
tion of the food goods(M˚ansson, 2016). Addition-
ally the supermarket would be capable of reducing the
electrical power demand for refrigeration to nil within
seconds if requested by the supply side.
In Germany alone, there are about 38,000 super-
markets with an accumulated energy demand of 10
TWh (Funder, 2015), translating to an average of 30
kW of electrical power demand per market or 1.14
GW nationally. This represents about 2% of Ger-
manys electrical energy demand, which is also a rep-
resentative number for both Sweden (Arias, 2005)
and UK(Tassou et al., 2011). With refrigeration
representing approximately 50%(Statens Energimyn-
dighet, 2010) of a supermarkets energy demand it is
reasonable to estimate that the average power demand
would be correspondingly large. And most certainly
the rated power of the accumulated refrigeration sys-
tems is significantly larger, which is advantageous
when acting as a energy sink for the grid.
2.1 Available Buffering Power and
Energy
A supermarket refrigeration system could potentially
run its refrigeration system at maximum rated capac-
ity at any given time. This action would result in all
refrigerated display cabinets decreasing in tempera-
ture at maximum rate. Several models for estimation
of this rate and the energy demand exists (Smale et al.,
2006) but are all dependent on accurate input param-
eters for the thermal properties of the food and refrig-
eration system. From the authors experience this rate
is in the magnitude of 1
◦
C/min. As the temperature
of the refrigerated display cabinets in general vary in
time with ±2
◦
C around the set point temperature, the
possible buffering capacity measured in time would
be 0− 4 minutes, depending on the individual tem-
perature levels of the cabinets in the supermarket.
Another scenario is to partially increase the com-
pressor work above the needed heat extraction rate for
the refrigerated display cabinets. This would result in
a slower decrease of temperatures in the cabinets i.e.
longer discharge time for the supply side. However,
SMARTGREENS 2019 - 8th International Conference on Smart Cities and Green ICT Systems
152
the energy buffered by the refrigerated display cab-
inets is equal for the maximum rate and partial rate
scenario. The energy storage capacity is limited to
the accepted lower limit temperature and the thermal
inertia of the food goods and refrigerated display cab-
inets.
2.2 Available Electrical Demand
Reduction
A supermarket could potentially also turn the com-
pressor completely or partially off, resulting in a tem-
perature increase of the food in the refrigerated dis-
play cabinets. The temperature increase rate is how-
ever lower than the temperature decrease rate. Fol-
lowing that the cabinets are developed to be energy
efficient, the insulation capacity is high. From field
observations and laboratory measurements an esti-
mated temperature increase rate between 0.2− 0.8
◦
C
per minute can be expected depending on the cabi-
net type and quality. For low temperature cabinets a
lower rate is likely.
With the same reasoning as above, this gives a
potential complete shut off time of 0 − 20 minutes
depending on the actual individual temperature and
quality of the cabinets. In a scenario where the su-
permarket just has been charged and all cabinets are
at their lower limit temperature and they are of highly
energy efficient type, the upper figure of 40 min is
true. This figure is however also influenced by the
customer behaviours, i.e. if the doors are frequently
opened or not.
If instead of completely turning the compressors
off the supermarket keeps them at a reduced power,
the supermarket should be able to run at reduced ca-
pacity for significantly longer times.
2.3 Example Store from Germany
To exemplify the potential, we present data from a
1,300 m
2
supermarket built in 2011 just outside Han-
nover in Germany. The refrigeration system serves a
total of 22 doored freezers, 15 chest type freezers and
62 doored medium temperature cabinets as well as 12
meter of refrigerated deli desk. The rated electrical
power for this system is approximately 50 kW.
In Figure 1 the electrical power demand by the
refrigeration system is shown. Here it can be seen
that the system uses on average about 25 kW over
the week. Only at a few times a week the demand
is above 30 kW and it never goes below 20 kW on the
15 min averaged data that is shown. The fluctuations
in the low temperature compressors that causes the
daily peaks is a consequence of synchronised defrost
schedules for the low temperature refrigerated display
cabinets.
Figure 1: Stacked line graph showing one week of the 15
minute average electrical power demand by the 1,300 m
2
supermarket used in this example.
For medium temperature refrigerated display cab-
inets in the store, the setpoint temperature range is
6 ± 2
◦
C allowing for 4
◦
C variation of temperature.
For low temperature cabinets the set point is −20
◦
C
with the same allowed variations.
To estimate the storage potential, the temperature
decrease and increase rate must be known. The au-
thors therefore performed a test on the medium tem-
perature cabinets of the store to find the maximum
temperature decrease rate. And a representative tem-
perature increase rate for 23
◦
C ambient conditions,
which is slightly higher than the actual store temper-
ature, making the results conservative. The results
from the experiment is presented bellow in Figure 2.
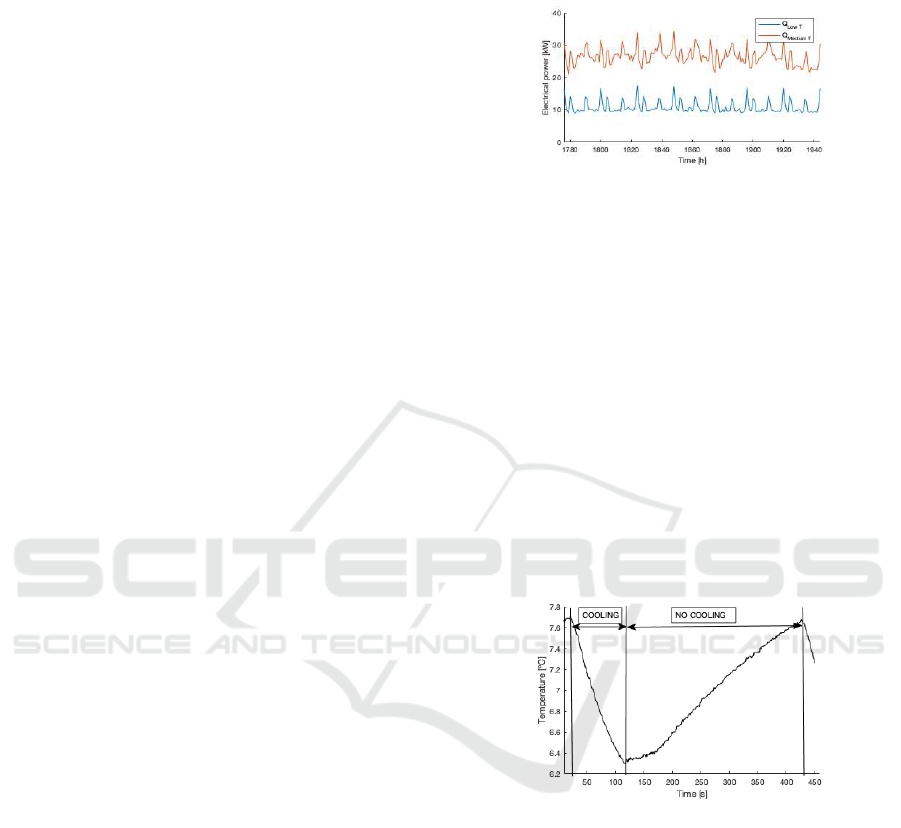
Figure 2: Temperature development in a refrigerated dis-
play cabinet during maximum cooling followed by no active
cooling. Results are from a pilot experiment by the authors.
In Figure 2 it can be seen that the temperature de-
crease from 7.7 to 6.3
◦
C occurs during approximately
100 seconds. Resulting in an temperature decrease
rate of 0.84
◦
C/min. In analogy with the decrease rate
the increase rate was calculated to be 0.24
◦
C/min.
2.3.1 Absorbing or Postponing Energy
From Figure 1 we see that the electrical power de-
mand at any given time is within the range of 20− 30
kW. Meaning that the remaining power to reach the
maximum power of 50 kW is 20 − 30 kW too. With
a temperature decrease rate of 0.84
◦
C/min, the mar-
ket would be able to absorb energy for a maximum of
Potential of Supermarket Refrigeration Systems for Grid Balancing by Demand Response
153

4.76 minutes resulting in 1.59 − 2.58 kWh of excess
energy stored.
If assuming that all components of the refrigera-
tion system is at their respective lower temperature
limit and that all cabinets have the same temperature
increase rate we can calculate the maximum post-
poned energy use. From the experiment presented
the authors concluded a temperature increase rate of
0.24
◦
C/min, meaning that it would take 16.7 min-
utes to increase the temperature by 4
◦
C. During this
time the supermarket would under normal conditions
(20 − 30 kW) have used 5.3 − 8 kWh, which is the
amount of energy that was shifted.
With the large number of refrigerated display cab-
inets it can be assumed that the distribution of their in-
dividualtemperature is evenlyspread within the upper
and lower limits. This implies that a complete shut-
down of the refrigeration system is only possible if
the refrigeration system actively has cooled down all
cabinets before the shutdown. Otherwise the warmer
cabinets will exceed the upper temperature limitation
and the food must be discarded. Running the system
on partial load, serving only the warmer cabinets is
however a more realistic scenario.
3 DISCUSSION
As shown in the example above and by the previ-
ous argumentation, supermarket refrigeration systems
could potentially be utilised for demand response in
the electrical grid. In the example the quantities of
stored energy is rather low while the available elec-
trical power is high and almost instantly accessible,
making the supermarkets attractive as a short time en-
ergy buffer for the grid. One missing part to realise
this today lay in the communication between the su-
permarkets and the electrical grid, both for the busi-
ness agreements and digital signals to allow the grid
to use the capacity.
In today’s supermarkets the main objective of
the control systems is to keep the food temperatures
within the temperature limits and to make the heat ex-
traction demand even for the compressors to be able
run at an energy efficient level. Some system actively
plans the cooling cycles to avoid peak power events
to occur when the electrical tariff is high. Meaning
that the refrigeration system today already uses the
thermal inertia of the food goods, but for a different
purpose then demand response. But due to the low ac-
curacy of the control system the safety margins must
be high to ensure the food safety. Meaning that the
full range in allowed temperature variation is almost
never used but rather limited to a few degrees.
When designing a supermarket refrigeration sys-
tem they are made to be redundant to ensure that heat
extraction demand never is larger than the installed
capacity. This has led to that the supermarkets has
significant amounts of spare cooling power capacity,
which most certainly would benefit the electrical grid
to have as buffering capacity.
Following that the four largest supermarket com-
panies Aldi, Netto, Lidl and REWE represents 14 640
(Statista, 2013) of these stores, the sector becomes
easily addressable. Meaning that if the companies
find incentivesto implement demand response, the ac-
cumulated effects would be very large.
With low profit margins (2 − 3%)(Arias, 2005),
the supermarkets are prone to adapt cost reducing ac-
tions in their markets(Retail Forum for Sustainability,
2009). Potentially being offered by the electrical grid
companies to sell buffering capacities or benefit of re-
duced energy prices might be an attractive incentive.
With the trade of Carbon-emission rights the super-
markets could claim to have lowered the GHG emis-
sions and therefore sell parts of its emission rights.
Creating a second revenue stream for the supermarket
companies.
From a technology implementation perspective,
the larger organisations are often using standardised
solutions which would mean that the demand re-
sponse technology that is necessary would have fewer
variations. Adapting the technology of one system
that is used for thousands of similar stores makes it
more attractive for developers to find a business case.
The businesses case is however rather complex
and must involve benefits for two actors, both the
supermarket and the energy producer. Fiscal and
economical incentives for increased energy efficiency
and lower climate impact for the energy producers are
obvious. But these benefits must also be transferred to
the supermarkets to motivate the initial investment in
systems allowing for the demand response to be im-
plemented.
An interesting aspect is that the driving force that
makes supermarkets attractive for demand response is
their high energy intensity. Meaning that any energy
efficiency measures that lowers the energy demand
for refrigeration will negatively affect its capacity as a
resource for demand response. Yet it will lowerthe lo-
cal energy demand and thereby the energy bill. There-
fore, finding a balance between the incentives here is
crucial.
Another aspect of the utilisation of the refrigera-
tion system for demand response is the fact that the
thermal mass is highly valuable food. The accumu-
lated monetary value of the stored food in the cabinets
is monumental. This demands that the implemented
SMARTGREENS 2019 - 8th International Conference on Smart Cities and Green ICT Systems
154

technologies are safe against failures and the highest
priority must always be the food safety.
Depending on the business model of the super-
market companies and the incentives provided by the
electrical grid, the installation of additional cold ther-
mal storage for the refrigeration system might be ben-
eficial(Ochieng et al., 2014). As presented earlier
the duration for which the refrigeration system can
be turned off or ran at maximum capacity is limited
to the thermal inertia of the food. If installing addi-
tional thermal energy storage units, the duration and
stored energy could be increased. Additionally de-
pending on on chosen technical solution for thermal
energy storage, this would also allow for complete
shutdown by allowing the valuable food goods to cool
directly from the thermal energy storage instead of in-
creasing its temperature. The optimal sizing of such a
storage depends on the energy demand by the super-
market and the business agreements with the utility
grid. However, the storage is one directional as the
stored compressor work cannot be converted back to
electricity. Meaning that there must be a balance be-
tween the supermarkets heat extraction and the stored
electrical energy overthe chosen storage period which
could be stretching from minutes to seasons.
4 CONCLUSION
With the above presented arguments and discussion
we conclude that utilising supermarket refrigeration
systems as a part of the grid balancing mechanism
is feasible. The technology is there and the incen-
tives could be created via the right business model.
In theory almost any centralised refrigeration control
system would be capable of providing this buffering
capacity to the grid, the main barrier is the business
models and control system accuracy and communica-
tion.
ACKNOWLEDGEMENTS
The authors would like to thank the main funding
body, Climate-KIC, providing not just the necessary
funds but an invaluable network and inspirational
community.
REFERENCES
Arias, J. (2005). Energy Usage in Supermarkets - Modelling
and Field Measurements. PhD thesis, Royal Institute
of Technology.
Baharlouei, Z. and Hashemi, M. (2013). Demand Side
Management challenges in smart grid: A review. In
2013 Smart Grid Conference, page 96, Tehran,Iran.
IEE.
Balijepalli, V. S. K. M., Khaparde, S. A., Shereef, R. M.,
and Pradhan, V. (2011). Review of Demand Response
under Smart Grid\rParadigm.pdf. IEEE PES Innova-
tive Smart Grid Technologies.
Comission, E. (2018). European Comission - Renewable
energy directive.
Costanzo, G. T. (2015). Demand Side Management In The
Smart Grid. PhD thesis, Technical University of Den-
mark.
Deloitte (2015). European energy market reform Country
profile : Germany Contents. Technical report, Deloitte
Conseil, Zurich.
European Commission (2012). Roadmap 2050. Policy,
001(April):1–9.
European Union (2018). Energy in figures – Statistical
pocketbook. Publications Office of the European
Union.
Farhangi, H. (2010). The path of the smart grid. IEEE
Power and Energy Magazine, 8(1):18–28.
Funder, T. (2015). Supermarkets as an Important Smart
Grid Application. In 16th European Conference, Tech-
nological Innovations In Refrigeration And In Air
Conditioning, Milan. Danfoss.
Gelazanskas, L. and Gamage, K. A. A. (2014). Demand
side management in smart grid : A review and pro-
posals for future direction. Sustainable Cities and So-
ciety, 11:22–30.
Haider, H. T., See, O. H., and Elmenreich, W. (2016). A
review of residential demand response of smart grid.
Renewable and Sustainable Energy Reviews, 59:166–
178.
Hovgaard, T. G., Halvgaard, R., Larsen, L. F. S., and
J{\o}rgensen, J. B. (2011). Energy Efficient Refrig-
eration and Flexible Power Consumption in a Smart
Grid. In Proceedings of Ris{\o} International Energy
Conference, pages 164–175.
M˚ansson, T. (2016). Energy in supermarkets. Licentiate
thesis, Chalmers University of Technology.
M˚ansson, T. and Ostermeyer, Y. (2013). The potential of
thermal energy storage in food cooling processes in
retail markets for grid balancing. In Nordic Sympo-
sium on Building Physics 2013, pages 1–6, Lund.
Ochieng, E. G., Jones, N., Price, a. D. F., Ruan, X., Egbu,
C. O., and Zuofa, T. (2014). Integration of energy ef-
ficient technologies in UK supermarkets. Energy Pol-
icy, 67:388–393.
Pedersen, R., Schwensen, J., Biegel, B., Stoustrup, J., and
Green, T. (2014). Aggregation and control of super-
market refrigeration systems in a smart grid. IFAC
Proceedings Volumes (IFAC-PapersOnline), 19:9942–
9949.
Retail Forum for Sustainability (2009). Issue Paper on the
Energy Efficiency of Stores. Retail Forum for Sustain-
ability, 1(1):1–9.
Potential of Supermarket Refrigeration Systems for Grid Balancing by Demand Response
155

Sand´en, B. (2014). Systems Perspectives on Renewable
Power 2014. Chalmers University of Technology,
G¨oteborg, v1.0 edition.
Sinn, H. W. (2017). Buffering volatility: A study on the
limits of Germany’s energy revolution. European Eco-
nomic Review, 99:130–150.
Smale, N., Moureh, J., and Cortella, G. (2006). A review
of numerical models of airflow in refrigerated food
applications. International Journal of Refrigeration,
29(6):911–930.
Statens Energimyndighet (2010). STIL 2 - Ener-
gianv¨andning i handelslokaler. Technical report, En-
ergimyndigheten, Stockholm.
Statista (2013). Retail Week. (n.d.). Number of stores of
key food and grocery retailers in Germany in 2013, by
store count.
Tassou, S. A., Ge, Y., Hadawey, A., and Marriott, D. (2011).
Energy consumption and conservation in food retail-
ing. Applied Thermal Engineering, 31(2-3):147–156.
Union, E. and Action, C. (2017). Energy Union. THE EU
AND series of the European Commission, 1(February
2017).
Zerrahn, A., Schill, W. P., and Kemfert, C. (2018). On
the economics of electrical storage for variable re-
newable energy sources. European Economic Review,
108:259–279.
SMARTGREENS 2019 - 8th International Conference on Smart Cities and Green ICT Systems
156
