
Machine Learning Approach for Live Migration Cost Prediction in
VMware Environments
Mohamed Esam Elsaid
1 a
, Hazem M. Abbas
2 b
and Christoph Meinel
1 c
1
Internet Technologien und Systeme, Hasso-Plattner Institut, Potsdam Uni., Potsdam, Germany
2
Dept. Computer and Systems Engineering, Ain Shams University, Cairo, Egypt
Keywords:
Cloud Computing, Virtual, Live Migration, VMWare, vMotion, Modeling, Overhead, Cost, Datacenter,
Prediction, Machine Learning.
Abstract:
Virtualization became a commonly used technology in datacenters during the last decade. Live migration is
an essential feature in most of the clusters hypervisors. Live migration process has a cost that includes the
migration time, downtime, IP network overhead, CPU overhead and power consumption. This migration cost
cannot be ignored, however datacenter admins do live migration without expectations about the resultant cost.
Several research papers have discussed this problem, however they could not provide a practical model that
can be easily implemented for cost prediction in VMware environments. In this paper, we propose a machine
learning approach for live migration cost prediction in VMware environments. The proposed approach is
implemented as a VMware PowerCLI script that can be easily implemented and run in any vCenter Server
Cluster to do data collection of previous migrations statistics, train the machine learning models and then
predict live migration cost. Testing results show how the proposed framework can predict live migration time,
network throughput and power consumption cost with accurate results and for different kinds of workloads.
This helps datacenters admins to have better planning for their VMware environments live migrations.
1 INTRODUCTION
Live migration of virtual machines is a key feature in
virtual environments, private and public cloud com-
puting datacenters. Using live migration, virtual ma-
chines can be moved from a physical host to another
while the applications are running online. This is due
to the negligible service interruption during the mi-
gration process. Servers load balance, power saving,
fault tolerance and dynamic virtual machines alloca-
tion are all dependent on live migration (Choudhary
et al., 2017). During the live migration process, the
VM CPU cache, memory pages and IO buffers con-
tents are migrated. However the storage content is
shared between the source and the target servers, so
storage content is not migrated. Live migration is sup-
ported by VMware (vMotion), Xen (XenMotion), Mi-
crosoft Hyper-V and KVM.
Live Migration cost can be classified into perfor-
mance of migration and performance loss of VM and
a
https://orcid.org/0000-0003-1577-5290
b
https://orcid.org/0000-0001-9128-3111
c
https://orcid.org/0000-0002-3212-6201
energy overhead (Strunk, 2012). Performance of mi-
gration includes the migration time and the downtime
that is consumed during a live migration process. Per-
formance loss of VM includes the overhead of the
migration process on the servers CPU, memory and
network throughput. And finally the energy overhead
in Joule or the power consumption overhead in Watt
due to live migration. As we will discuss in section
II, the live migration cost is variable with VM mem-
ory size, network utilization, CPU utilization and the
dirty pages rate which depends on the running work-
load. For the best of our knowledge, until now live
migration is done by datacenter admins with no ex-
pectations about the migration cost. So the admins
do the live migrations and then see the impact of it
on the network, CPU, memory and power consump-
tion. This leads sometimes to facing failures in live
migration, bottlenecks in the datacenter infrastructure
resources, and downgrade in the VMs availability due
to longer down time especially for large memory VMs
migrations.
In this paper, we propose a practical machine
learning framework for live migration cost modelling
and prediction in VMware environments. The pro-
456
Elsaid, M., Abbas, H. and Meinel, C.
Machine Learning Approach for Live Migration Cost Prediction in VMware Environments.
DOI: 10.5220/0007749204560463
In Proceedings of the 9th International Conference on Cloud Computing and Services Science (CLOSER 2019), pages 456-463
ISBN: 978-989-758-365-0
Copyright
c
2019 by SCITEPRESS – Science and Technology Publications, Lda. All rights reserved

posed framework starts with data collection about the
history of live migrations that have run in the cluster
during the past 12 hours, then use the collected statis-
tics for models training. After training the models,
the prediction phase can start to estimate the future
live migration requests cost. This should help the dat-
acenters admins to estimate the cost of single or mul-
tiple VMs live migration before proceeding with it.
This means better live migration tasks planning and
less resources bottlenecks.
The rest of this paper is structured as following. In
section II, we discuss in details the live migration
cost. In section III, the related research work is dis-
cussed. The proposed prediction technique is pre-
sented in section IV. The the modeling results are an-
alyzed in section V. Then we conclude the paper in
section VI.
2 LIVE MIGRATION COST
Live migration consists of mainly six phases; ini-
tialization, reservation, iterative pre-copy, stop-and-
copy, commitment and activation (Elsaid and Meinel,
2014). The cost of live migration is actually a result
of passing through these six phases. In this paper, we
focus on modeling and predicting the below migra-
tion cost parameters as main overhead costs that can
be measured in our test-bed and modeled with regres-
sion techniques:
• Migration Time: This is the time consumed in
seconds from the migration request initiation un-
til having the VM activated at the destination host.
This is the time consumed by the above 6 phases
of the pre-copy migration.
• Network Overhead: This is the increase in the IP
network throughput in kBps due to the VM con-
tent migration from the source host to the target
one.
• Power Consumption: live migration process con-
sumes significant energy. This is due to the in-
crease in CPU and network utilization. In this pa-
per, we model and predict the peak power over-
head in Watt.
The CPU and down time cost parameters will be con-
sidered in an extended work to this paper.
3 RELATED WORK
Live Migration cost is analyzed by different mathe-
matical and empirical methods. Analysis and Predic-
tion of live migration cost is presented using machine
learning, or mathematical approaches. In our paper
(Elsaid and Meinel, 2014), we have provided empiri-
cal models for live migration time, network overhead
and power consumption in relation with the VM ac-
tive memory size for VMware vMotion. Cost predic-
tion could not be used in (Elsaid and Meinel, 2014)
due to the constants in the provided models. These
constants depend on the cluster characteristics like
CPU models and network bandwidth. This work is an
extension of the previous work in (Elsaid and Meinel,
2014); where the contribution is providing a machine
learning based approach for live migration cost esti-
mation. Machine learning is used mainly to define
the constants in the provided models in (Elsaid and
Meinel, 2014) during the training phase, and then the
empirical models are used to predict the VM migra-
tion cost.
In Reference (Hu et al., 2013), an analysis of
live migration time and downtime is provided and
then a comparison between Xen, KVM, Hyper-V and
VMware vSphere hypervisors is presented in terms of
storage migration and live migration time and down-
time. A comparison between Xen and VMware live
migration time and downtime is also presented in
(Salfner et al., 2011) with more investigation on the
parameters that contol the live migration time and
downtime durations. The authors (Bezerra et al.,
2017) show the impact of a VM live migration on the
running applications performance from client side.
The performance degradation of the application from
client side was measured in operations per second.
The impact of live migration on Internet Web 2.0
applications performance is discussed in (Voorsluys
et al., 2009). This is important for environments with
SLA requirements. For this purpose, a test-bed is built
in (Voorsluys et al., 2009) where the running Web
2.0 workload is Olio application, combined with Fa-
ban load generator that access the Apache 2.2.8 Web
server with MySQL database.
The other category of papers focus on live migra-
tion cost prediction. Classification of Live migration
cost is provided in (Strunk, 2012) with an explanation
of the parameters that control migration time, down-
time and energy consumption. Also, Mathematical
models are proposed to estimate live migration time,
downtime and energy consumption.Machine learning
is used in (Berral et al., 2013) for VM placement el-
ements predictive modeling like (CPU, memory, net-
work and energy).The authors (Akoush et al., 2010)
analyze the parameters that control the migration time
and the downtime and show the impact of the work-
load on the migration performance. Markov chains
are used in (Melhem et al., 2018) for hosts utilization
prediction after live migration. The proposed Markov
Machine Learning Approach for Live Migration Cost Prediction in VMware Environments
457
Table 1: Summary of Related Work.
Paper
Research
Scope
Migration
Time
Down
Time CPU Network Power Hypervisor
(Elsaid and Meinel, 2014) Analysis X - - X X VMware
(Hu et al., 2013) Analysis X X - - -
VMware/ Xen/
Hyper-v/ KVM
(Salfner et al., 2011) Analysis X X - - - Xen / VMware
(Voorsluys et al., 2009) Analysis X X - - - Xen
(Strunk, 2012) Prediction X X - - X Xen
(Zhao and Figueiredo, 2007) Prediction X - - - -
VMware but
not vMotion
(Berral et al., 2013) Prediction - - X X X
Oracle
Virtual Box
(Jo et al., 2017) Prediction X X X X -
VMware/ Xen/
Hyper-v/ KVM
(Akoush et al., 2010) Prediction X X - - - Xen
(Salfner et al., 2012) Prediction X X - - -
VMware/
Xen/ KVM
(Melhem et al., 2018) Prediction X - - - - -
(Huang et al., 2014) Prediction X - X X X Xen
(Aldossary and Djemame, 2018) Prediction X - X - X KVM
based prediction model is used for power saving al-
gorithm that can achieve lower SLA violations, lower
VM migrations as well as less power consumption
(Melhem et al., 2018). Time series is used in (Huang
et al., 2014) for time varying resources load predic-
tion. The proposed model is used for power saving by
minimizing the number of active physical machines
with less live migration times and with satisfying the
SLA requirements. The proposed technique is tested
in a Xen cluster. A mathematical based prediction
framework is also proposed in (Aldossary and Dje-
mame, 2018). From Table I, the papers that focus
on VMware cost prediction are (Zhao and Figueiredo,
2007), (Jo et al., 2017) and (Salfner et al., 2012). To
the best of our knowledge, using machine learning for
VMware live migration cost prediction is not covered
in a practical way by any of these papers; which is
the point that we cover in this paper by the proposed
machine learning approach. We discuss the shortage
in practicality of papers (Zhao and Figueiredo, 2007),
(Jo et al., 2017) and (Salfner et al., 2012) in the fol-
lowing points:
• In paper (Zhao and Figueiredo, 2007), a VMware
cluster is built for modeling, but vMotion is not
used. The authors could do the suspend, copy and
resume operations manually for migration time
prediction. This limits the proposed modeling to
be used practically in an enterprise environments
that use vMotion by default as the live migration
feature in vSphere; without any manual opera-
tions.
• The machine learning approach proposed in (Jo
et al., 2017) can be used for most of the live migra-
tion algorithms in different hypervisors as stated
in (Jo et al., 2017). However, the proposed ma-
chine learning technique depends on massive em-
pirical tests for 40,000 live migration that were
run in order to have accurate prediction. This
means that the approach used for live migration
cost prediction will generate an intensive cost it-
self; which blocks the ability to practically imple-
ment the proposed approach in (Jo et al., 2017).
• In the proposed mathematical model in (Salfner
et al., 2012), live migration time and downtime
can be predicted but after the start of the live mi-
gration; not before. This means that the proposed
algorithm does not help the cluster admin to know
the live migration cost before proceeding with mi-
gration.
In the next section, we discuss our paper contribu-
tion in more details.
4 PROPOSED COST
PREDICTION FRAMEWORK
In this paper, we solve the challenge of having a prac-
tical live migration cost prediction for VMware en-
vironments. This is achieved by proposing a ma-
chine learning based approach that is implemented
as VMware PowerCLI script and can connect to any
VMware vCenter server to train the model and then
predict live migration cost. Here, we list our contri-
bution in this paper in the following points:
• We propose a machine learning approach for
VMware vMotion that predicts the live migration
time, network overhead and power consumption
given the active memory size of the VM.
CLOSER 2019 - 9th International Conference on Cloud Computing and Services Science
458

• The proposed approach can be practically used.
It is implemented as a VMware PowerCLI script;
that can be bounded with any VMware vCenter
server and show the cost prediction results.
• The proposed script includes data collection that
is used for the models training phase. This makes
the proposed models adaptable to each VMware
cluster automatically.
• The training phase in the proposed machine learn-
ing algorithm is fed by the ongoing live migra-
tion operations that run in the datacenter; which
increases that the prediction accuracy.
4.1 Modelling of Live Migration Cost
This paper is an extension to the proposed models in
(Elsaid and Meinel, 2014) and (Elsaid and Meinel,
2016). From these papers, the following empirical
models could be proposed for live migration time,
data rate and power consumption after applying the
regression techniques:
• The relation between the network rate and the ac-
tive memory size can be modelled as an exponen-
tial relation; as shown in equation (1).
R
s
= αe
V
Mem
+ β
(1)
R
s
: is the source host network throughput over-
head in kBps, V
mem
is the source host active mem-
ory size in kB at the time when the live migration
should start. α and β are the equation constants.
From equation (1).
• Migration Time: A linear relationship is obtained
between the migration time and the division of the
memory size over the transmission rate; as repre-
sented in equation (2).
T
mig
= a.(
V
mem
R
s
) + b
(2)
T
mig
is the migration time duration in seconds. a
and b are the equation constants.
• Peak power consumption overhead has linear re-
lation with the transmission rate; as represented in
equation (3).
P
mig
=
dE
mig
dt
= c
dV
mig
dt
= c R
s
(3)
P
mig
is the peak power overhead in Watt, and c is
constant. From equation (3).
In our previous papers, the above models could be
used for cost analysis but not for cost prediction. This
is because of the equations constants. These con-
stants depend on the cluster hardware configuration
like CPU specs, so they change from a cluster envi-
ronment to another. So in order to determine these
constants and achieve higher accuracy in cost predic-
tion, we propose a machine learning framework to
predict the live migration cost.
4.2 Machine Learning based Cost
Prediction
In this paper, machine learning is used because the
proposed models in equations (1 - 3) can not be used
in live migration cost prediction. This is due to the
constants included in the equations. These constants
values depend on the cluster hardware characteris-
tics; like CPU and network configurations. So, ma-
chine learning is needed to train the models in ref-
erence to equations (1 - 3) until the constants val-
ues are obtained for each cluster. Then, these equa-
tions can be used for cost prediction. In this sec-
tion, we present the proposed machine learning based
framework for live migration time, transfer rate and
power consumption overhead prediction. As shown
in the flow chart of Fig. 1, the proposed framework
consists of two main phases, the training phase and
the prediction phase. The training phase starts when
the VMware PowerCLI script connects to the cluster
vCenter Server Appliance (vCSA). Then data collec-
tion starts with listing all the events happened in the
cluster during the last 12 hours. This 12 hours cy-
cle can be changed based on the cluster admin pref-
erence. From the collected events, vMotion events
are filtered out. These vMotion events details like the
source host, target host and time stamp are captured.
Then the script calculates the complete and start time
differences in order to get the migration time of each
vMotion request. The performance logs of vCSA are
collected at the start and the completion times at the
vMotion events in order to get the active memory size
of the migrated VMs in kB, the network overhead in
kBps and the peak power change in Watt.
From the above data of each vMotion event, we use
the regression models in equations (1 - 3) to calculate
the equations constants after doing several substitu-
tion and considering the minimum Root Mean Square
Error (RMSE); equation (4).
RMSE =
r
1
N
Σ
N
i=1
(d
i
− f
i
)
2
(4)
Where N is the number of sample points collected
during the last 12 hours. d
i
is the measured perfor-
mance value and f
i
is the regression equation value.
If the change in all the constants value became
greater than 10% of the last 12 hours cycle, the script
waits for more 12 hours and run again to continue in
Machine Learning Approach for Live Migration Cost Prediction in VMware Environments
459
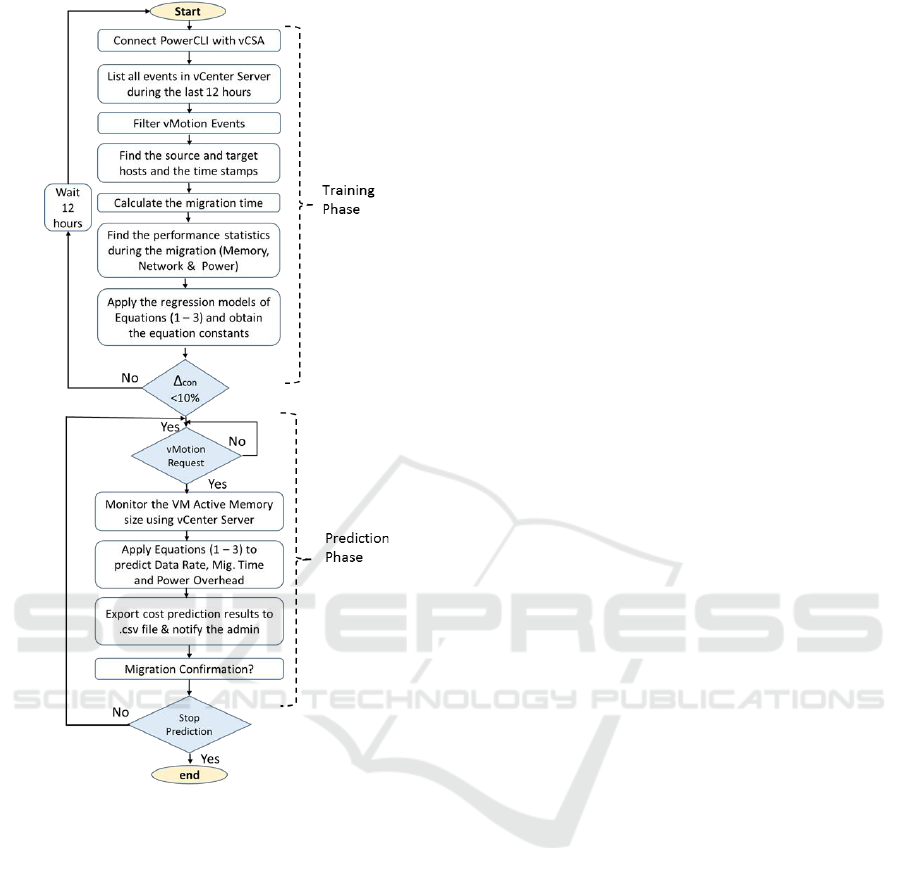
Figure 1: Proposed Prediction Framework.
the training phase. If these changes became less than
10% of the last 12 hours, so we consider the the train-
ing phase of this cluster is finished, and the script then
moves to the prediction phase. The time consumed
until reaching this 10% convergence depends on the
changes that happen in the VMs active memory size;
which depends on the running workload. This se-
quence of data collection and models training makes
the algorithm can fit at any vCenter Server cluster and
adapt its models based on the cluster configuration in
order to provide cost prediction.
In the prediction phase when a vMotion request
is sent by the cluster admin, the active memory size
is captured by the script before proceeding with live
migration. Once the active memory size is known,
equation (1) is used to predict the source host net-
work throughput. Then equation (2) is used to predict
the migration time, and finally equation (3) is used to
predict the peak power consumption. The prediction
data is exported to a .csv file that the cluster admin
can read, and decide to proceed with this migration or
not.
5 TESTING ENVIRONMENT
The testing environment is shown in Fig. 2; as shown
it has a similar infrastructure to enterprise datacen-
ters. It includes the following hardware setup; Three
Hosts (Hewlett Packard DL980 G7) with 8 x Intel
Xeon (Nehalem EX) X7560, 8GB RAM, 4 NICs, 2
HBA with 2 Fiber ports per card. The three hosts are
connected to a shared storage EMC VNX5800; 1TB
LUN via FC-SAN network.The Ethernet switch is
Cisco with 1Gbps ports. From software prospective,
VMware ESXi 6.5.0 Hypervisor is used with vCenter
Server that manages both hosts and the VMs live mi-
gration. VMware PowerCLI 6.5.1 build 5377412 is
connected to the vCenter Server to run the framework
algorithm script.
In this set up we have created four Linux Ubuntu
12.04 VMs with 4 vCPU, and different RAM sizes
(1GB, 2GB, 4GB and 8GB). The VMs have mainly 3
categories of workload:
• CPU and Memory intensive: This is considered
as the worst case scenario for a running work-
load. The CPU intensive benchmark that we used
is Linpack (Lin, ) and the memory stress is the
Linux Stress Package (Mem, ).
• Network Intensive: The network stress bench-
mark that we have used is Apache Bench (AB).
Apache Bench tool stresses the web servers with
lots of requests through the network to test the
servers response.
• Idle: VM is simply an idle Ubuntu OS VM; with
no running applications.
With this testing setup, we have run 12 testing sce-
narios; as a matrix of 3 workload categories and 4
different VM sizes. For each configuration, we have
run live migration at least 10 times.
6 RESULTS AND ANALYSIS
After testing the proposed approach in Fig. 1 on the
test-bed of Fig. 2, we present in this section the pre-
diction results for almost 144 readings. We start with
the training phase to show how the models are trained
until obtaining equations (1 - 3) constants with at least
90 percent accuracy.
CLOSER 2019 - 9th International Conference on Cloud Computing and Services Science
460
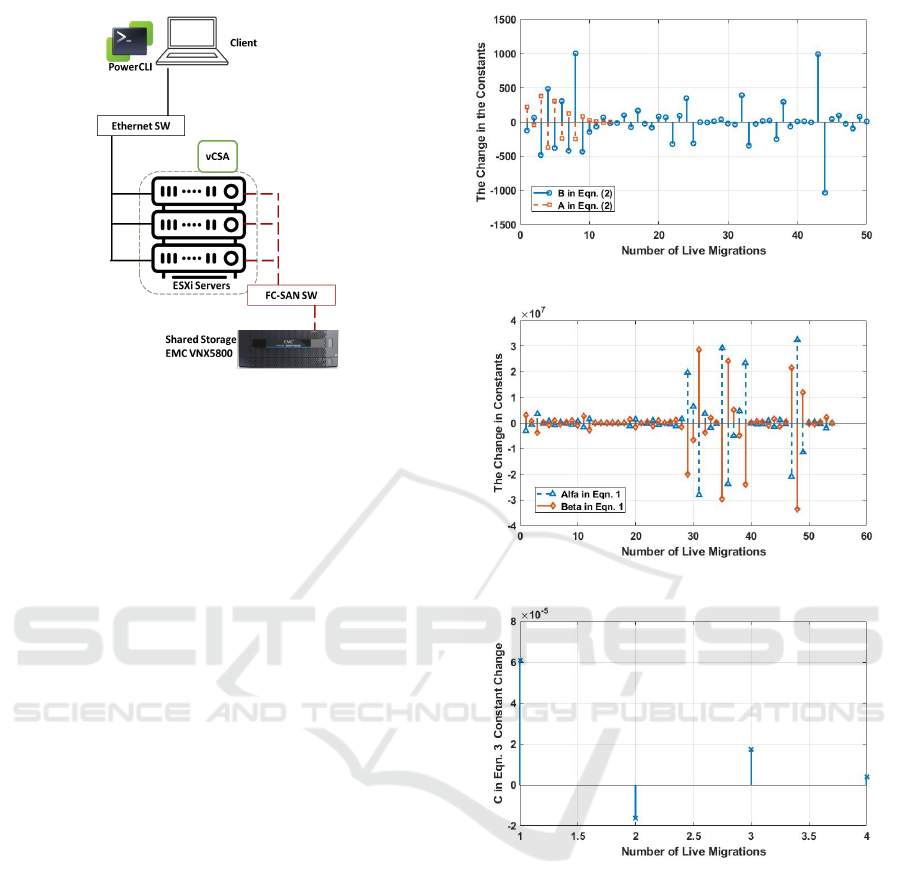
Figure 2: Testing Lab Layout.
6.1 Training Phase
In this phase, the script collects the last 12 hours
live migration events. Then the performance statistics
of these live migrations are gathered including their
time stamps. The migration time is calculated by the
script; given the start and end time of the live migra-
tion event. The other gathered statistics include the
active memory size, the source host transmission rate
and the peak power change. All these details are used
to train the models of equations (1 - 3) and to obtain
the constants of this cluster by solving several linear
equations. For example in order to calculate a and b of
equation (2), we use every two live migration events
statistics to generate two equations in two unknowns.
These unknowns are a and b in this example, because
the migration time, the active memory size and the
transmission rate are given. So, we gather every two
live migration events statistics to solve for the con-
stants of equation (2). The script keeps on solving for
the values of a and b until finding the changes in the
values of a and b are less than 10 percent compared to
the calculated values of last equations solution. Fig.
3 shows the changes of a and b constants versus the
number of live migration equations that were used
until reaching the 90 percent saturation. As shown
in Fig. 3; the difference in a is changing with the
number of live migrations which represents solving
more equations until the 90 percent saturation at dif-
ference equals 0.22 after 14 live migrations. At this
point a=9.04. For b constant, the script has run 50 live
migrations to reach the 90 percent saturation at differ-
ence equals 9.16. At this point b=21.04. This means
that modeling with equation (2) could be used after 50
live migration runs for this cluster. For equation (1),
we could also solve every two equations of live mi-
Figure 3: A and B Change until Saturation.
Figure 4: Alpha and Beta Change until Saturation.
Figure 5: C Change until Saturation.
grations data as linearly to obtain the values of α and
β. The is because the values of the active memory
size and the migration time are given, so we can sub-
stitute with them and then solve two equations in two
unknowns; α and β. Fig. 4 shows the differences hap-
pen in the values of α and β after each live migration
until reaching the 90 percent saturation. As shown;
the constant α could reach the saturation at difference
equals 1850 after 54 live migrations. At this point
α equals 2.02 ∗ 10
4
. The value of β reaches the 90
percent saturation at difference equals 2225 also after
54 live migrations. At this point, β equals 2.33 ∗ 10
4
.
This means that modeling with equation (1) can be
used after 54 live migration runs. Finally, equation
(3), which has just one unknown; c and so it can be
resolved given just one live migration statistics. So
Machine Learning Approach for Live Migration Cost Prediction in VMware Environments
461
for each live migration run in the past 12 hours, we
could read the transmission rate and the peak power
overhead and then calculate the constant c. Fig. 5
shows the changes happen with each live migration
calculation to the the constant c; as shown it 90 per-
cent saturates after just fours live migrations runs at
difference of c value equals 0.6 ∗ 10
−5
. At this point
c equals 16 ∗ 10
−5
. From the above analysis, we find
that it required 54 live migration runs to be able to
train the models provided in equation (1 - 3). In gen-
eral, the required number of live migrations runs to
finish the training phase depends on the error gap be-
tween the training data and the regression model.
6.2 Prediction Phase
In this subsection, we build on the training phase that
we have discussed above. Now, the regression mod-
els are trained for this cluster and ready to be used for
future live migration cost prediction. The testing re-
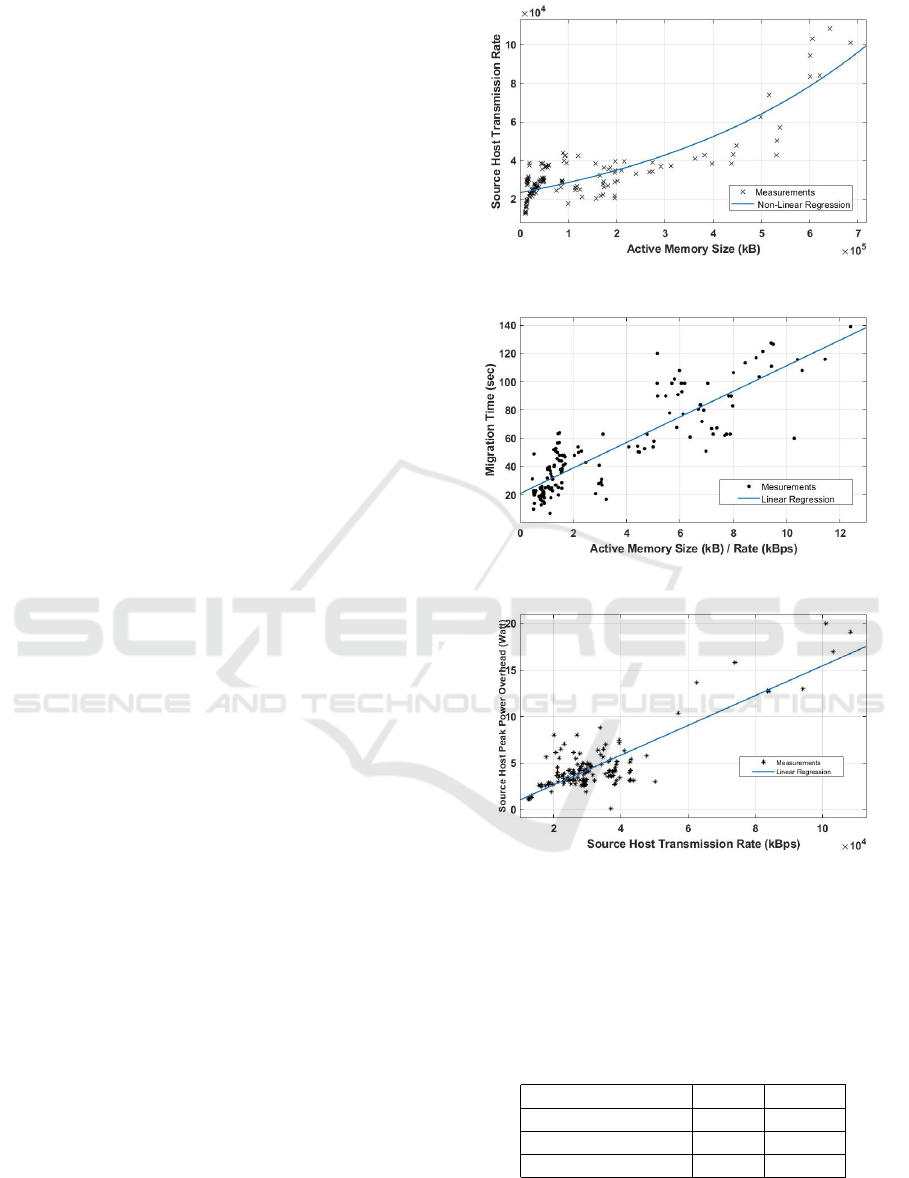
sults in Fig. 6 - 8, show the regression models that
are used and the actual measured data after migration.
The measurement points in Fig. 6, Fig. 7 and Fig.
8 are VMs live migrations with different configura-
tions including memory size of 1GB, 2GB, 4GB and
8GB VMs that utilize three different kinds of work-
loads. As discussed in section V, these workloads are
CPU and memory intensive, network intensive and
idle VMs. This results in 12 different VM configu-
rations. Each configuration is tested 12 times; which
represents the existing 144 measurement points in the
following figure. The prediction starts with Fig. 6;
so given the active memory size of the VM to be mi-
grated, the source host transmission rate can be pre-
dicted. The VM active memory size can be measured
before live migration. Fig. 6 shows the exponential
relation as a valid regression model between the active
memory size and the transmission rate. Table II shows
the RMSE of Fig. 6 in reference to equation (4). Af-
ter obtaining the transmission rate from Fig. 6, we
calculate now the active memory size over the trans-
mission rate; which is the horizontal axis of Fig. 7. So
the migration time can be predicted; using the linear
regression model of Fig. 7. The RMSE of the pre-
diction in Fig. 7 is also listed in Table II. Fig. 7 also
shows that the migration time can consume several
minutes in case of large memory and memory inten-
sive VMs. The last model is for the source host peak
power change; which is shown in Fig. 8. So given the
source host transmission rate, the peak power change
can be obtained.
All these predicted live migration cost parameters
are exported to a .csv file that can be accessed by the
cluster admin to check the estimated cost if he/she
Figure 6: Rate vs Active Memory Size.
Figure 7: Migration Time vs Active Memory Size/Rate.
Figure 8: Peak Power Overhead vs Transmission Rate.
decides to do live migration to a certain VM. This
help the admins to have better planning for live migra-
tions. This proposed framework script can adapt itself
by changing the models constants using the training
phase; which make it flexible with any VMware clus-
ter.
Table 2: RMSE of the Regression Models.
Model Fig. RMSE
Transmission Rate Fig. 6 8187
Migration Time Fig. 7 15.5
Peak Power Fig. 8 1.7
CLOSER 2019 - 9th International Conference on Cloud Computing and Services Science
462

7 CONCLUSION
Live migration cost can not be ignored and might lead
to resources bottlenecks, service availability degrada-
tion and live migration failures. Several related papers
have discussed this problem by applying mathemati-
cal and empirical studies, however to the best of our
knowledge there is no related paper that could pro-
vide a practical approach that can be used and inte-
grated with VMware clusters. In this paper, we pro-
posed a practical machine learning based approach
that helps the datacenter admins to predict the live
migration cost in VMware environments. The pro-
posed framework is implemented as VMware Power-
CLI script and can connect to any vSphere vCenter
Server. We considered simplicity in the proposed ap-
proach to minimize the CPU consumption overhead
due to running the proposed approach and so make
it agile enough to be implemented in enterprise dat-
acenters. In this paper, we predict the live migra-
tion time, network throughput and power consump-
tion overhead. Testing results show that the proposed
regression based models can be used for cost predic-
tion with acceptable error.
REFERENCES
https://people.seas.harvard.edu/ apw/stress/.
www.netlib.org/linpack/.
Akoush, S., Sohan, R., Rice, A., Moore, A. W., and Hop-
per, A. (2010). Predicting the performance of virtual
machine migration. In Proceedings of the 2010 IEEE
International Symposium on Modeling, Analysis and
Simulation of Computer and Telecommunication Sys-
tems, MASCOTS ’10, pages 37–46, Washington, DC,
USA. IEEE Computer Society.
Aldossary, M. and Djemame, K. (2018). Performance and
energy-based cost prediction of virtual machines live
migration in clouds. In Proceedings of the 8th Interna-
tional Conference on Cloud Computing and Services
Science, CLOSER 2018, Funchal, Madeira, Portugal,
March 19-21, 2018., pages 384–391.
Berral, J. L., Gavald
`
a, R., and Torres, J. (2013). Power-
aware multi-data center management using machine
learning. In Proceedings of the 2013 42Nd Interna-
tional Conference on Parallel Processing, ICPP ’13,
pages 858–867, Washington, DC, USA. IEEE Com-
puter Society.
Bezerra, P., Martins, G., Gomes, R., Cavalcante, F., and
Costa, A. (2017). Evaluating live virtual machine mi-
gration overhead on client’s application perspective.
In 2017 International Conference on Information Net-
working (ICOIN), pages 503–508.
Choudhary, A., Govil, M. C., Singh, G., Awasthi, L. K.,
Pilli, E. S., and Kapil, D. (2017). A critical survey of
live virtual machine migration techniques. J. Cloud
Comput., 6(1):92:1–92:41.
Elsaid, M. E. and Meinel, C. (2014). Live migration impact
on virtual datacenter performance: Vmware vmotion
based study. In 2014 International Conference on Fu-
ture Internet of Things and Cloud, pages 216–221.
Elsaid, M. E. and Meinel, C. (2016). Multiple virtual
machines live migration performance modelling –
vmware vmotion based study. In 2016 IEEE Inter-
national Conference on Cloud Engineering (IC2E),
pages 212–213.
Hu, W., Hicks, A., Zhang, L., Dow, E. M., Soni, V., Jiang,
H., Bull, R., and Matthews, J. N. (2013). A quan-
titative study of virtual machine live migration. In
Proceedings of the 2013 ACM Cloud and Autonomic
Computing Conference, CAC ’13, pages 11:1–11:10,
New York, NY, USA. ACM.
Huang, Q., Shuang, K., Xu, P., Liu, X., and Su, S. (2014).
Prediction-based dynamic resource scheduling for vir-
tualized cloud systems. JNW, 9:375–383.
Jo, C., Cho, Y., and Egger, B. (2017). A machine learning
approach to live migration modeling. In Proceedings
of the 2017 Symposium on Cloud Computing, SoCC
’17, pages 351–364, New York, NY, USA. ACM.
Melhem, S. B., Agarwal, A., Goel, N., and Zaman, M.
(2018). Markov prediction model for host load de-
tection and VM placement in live migration. IEEE
Access, 6:7190–7205.
Salfner, F., Tr oger, P., and Polze, A. (2011). Down-
time Analysis of Virtual Machine Live Migration. In
The Fourth International Conference on Dependabil-
ity, pages 100–105. IARIA, IARIA.
Salfner, F., Tr oger, P., and Richly, M. (2012). Dependable
Estimation of Downtime for Virtual Machine Live Mi-
gration. International Journal On Advances in Sys-
tems and Measurements, 5:70–88.
Strunk, A. (2012). Costs of virtual machine live migration:
A survey. In Proceedings of the 2012 IEEE Eighth
World Congress on Services, SERVICES ’12, pages
323–329, Washington, DC, USA. IEEE Computer So-
ciety.
Voorsluys, W., Broberg, J., Venugopal, S., and Buyya, R.
(2009). Cost of virtual machine live migration in
clouds: A performance evaluation. In Proceedings of
the 1st International Conference on Cloud Comput-
ing, CloudCom ’09, pages 254–265, Berlin, Heidel-
berg. Springer-Verlag.
Zhao, M. and Figueiredo, R. J. (2007). Experimental study
of virtual machine migration in support of reserva-
tion of cluster resources. In Proceedings of the 2Nd
International Workshop on Virtualization Technology
in Distributed Computing, VTDC ’07, pages 5:1–5:8,
New York, NY, USA. ACM.
Machine Learning Approach for Live Migration Cost Prediction in VMware Environments
463
