
BIpm: Combining BI and Process Mining
Mohammad Reza Harati Nik
1,2
, Wil M. P. van der Aalst
3
and Mohammadreza Fani Sani
3
1
Department of Industrial Management, Allameh Tabataba’i University, Tehran, Iran
2
PhD visitor at Process and Data Science (PADS) team at RWTH Aachen, Germany
3
Department of Computer Science, RWTH Aachen, Germany
Keywords: Process Mining, Business Intelligence, Microsoft Power Bi, Process Cubes, Business Analytics.
Abstract: In this paper, we introduce a custom visual for Microsoft Power BI that supports process mining and business
intelligence analysis simultaneously using a single platform. This tool is called BIpm, and it brings the simple,
agile, user-friendly, and affordable solution to study process models over multidimensional event logs. The
Power BI environment provides many self-service BI and OLAP features that can be exploited through our
custom visual aimed at the analysis of process data. The resulting toolset allows for accessing various input
data sources and generating online reports and dashboards. Rather than designing and working with reports
in the Power BI service on the web, it can be possible to view them in the Power BI mobile apps, and this
means BIpm provides a solution to have process mining visualizations on mobiles. Therefore, BIpm can
encourage many businesses and organizations to do process mining analysis with business intelligence
analytics. Consequently, it yields managers and decision makers to translate discovered insights
comprehensively to gain improved decisions and better performance more quickly.
1 INTRODUCTION
Nowadays, process mining is a new and emerging
interdisciplinary field between data science and
business process management. Generally, it bridges
the gap between business process management and
workflow management on the one hand and already
between data mining, business intelligence, and
machine learning on the other hand (van der Aalst,
2016). Process mining can be subdivided into process
discovery, conformance checking, and enhancement.
In process discovery, we aim to discover a process
model that describes the process captured within the
event data. In conformance checking, deviations
between event log and the predefined desirable
process model are discussed, and the enhancement
techniques focus on improving a process by
enhancing the model using the corresponding event
log, e.g., adding timestamps analysis to expose the
bottlenecks and service levels (van der Aalst,
Adriansyah and van Dongen, 2012).
Among these approaches, process discovery plays
a fundamental and significant role in understanding
what occurred in reality. In other words, it helps us to
understand how process instances were executed in
reality. In this branch of process mining, the event log
is used to distinguish “de facto models,” i.e., the
model aims to show real executive business processes
(van der Aalst et al., 2010). The real sequence of
executing activities as a process model is the valuable
output since this yields business owners and service
managers to interpreter desirable insights of hidden
knowledge of the stored event data from various
working information systems. Moreover, there are
different ways to show a process model. The most
widely used type of presentation is process graph that
simply provides interpretable process models
(Agrawal, 1998).
When there are multiple attributes in the given
dataset, and many classes of cases are available in the
event log, the ability to do process mining in a
multidimensional manner becomes more crucial. The
business analyst needs to investigate the multiple case
dimensions on the behaviors of the process.
Multidimensional process mining is related to use the
Online Analytical Processing (OLAP) infrastructure
in process mining (van der Aalst, 2013). Therefore, it
makes sense to integrate process mining into an
existing Business Intelligence (BI) tool that is
supporting OLAP technology. This integration allows
leveraging the scalability and data preprocessing
capabilities for real data science projects.
Harati Nik, M., van der Aalst, W. and Fani Sani, M.
BIpm: Combining BI and Process Mining.
DOI: 10.5220/0007741901230128
In Proceedings of the 8th International Conference on Data Science, Technology and Applications (DATA 2019), pages 123-128
ISBN: 978-989-758-377-3
Copyright
c
2019 by SCITEPRESS – Science and Technology Publications, Lda. All rights reserved
123

To address this issue, we implemented a process
mining tool building upon the Power BI
infrastructure. We named the tool Business
Intelligence and process mining (BIpm). BIpm can
discover process models from event logs and plot
them understandably and also showing compliance
diagnostics. Moreover, one of the advantages of
BIpm is getting the Power BI users and all BI experts
more familiar with process mining analysis. BIpm
lets BI developers and general data scientists
subsequently apply process mining analysis quickly,
user-friendly and easily in the platform that they are
used to it. According to the available license fees for
process mining commercial tools such as Disco and
Celonis, BIpm is more affordable. It is free custom
visual and only the probable fee might be charged for
using Power BI. Meanwhile, regarding to the current
license policy of Microsoft, using Power BI Desktop
is completely free (Microsoft, 2019).
The idea to relate process mining to OLAP
analysis was introduced firstly by van der Aalst (van
der Aalst, 2013) and it was realized by building the
so-called Process Cube paradigm (Bolt and van der
Aalst, 2015). Process cubes organize event data in the
form of an OLAP cube to allow for discovering,
comparing and analyzing the process models by
applying dice and slice filtering functions on the cube
(cross filtering). Here, we continue this line of
research by providing an integrated process mining
solution with many BI features analysis in a single
platform. This is achieved by our developed custom
visual for Microsoft Power BI. Power BI is the
powerful self-service BI platform for big data-centric
businesses with many interactive visualizations for
graphical figures, data mining tasks, statistical
analyses, and geographical maps and also it has useful
features such as supporting online dashboards,
customized reports and, online alerting (Ferrari and
Russo, 2016). There are many options for connecting
or importing different data sources into Power BI, as
long as the following constraints are satisfied 1) there
is a 1 GB limit for each dataset. 2) The maximum
number of rows when using DirectQuery is 1 million
rows and when not using DirectQuery is 2 billion
rows, 3) The maximum number of columns in a
dataset should not exceed more than 16,000 columns
(Microsoft, 2019). These constraints are not limiting
in most applications.
By using BIpm, business owners, business
analysts, and managers can understand the value of
process mining and come up with the improvement
plans for reengineering the previous and ongoing
processes or designing forerunner ones in the hope to
achieve the better performance and efficiency.
2 BIpm OVERVIEW
In this section, we give an overview of BIpm. Firstly,
we will describe how the input data fields should be
prepared and placed in the Fields pane of Power BI.
After that, we illustrate some functional capabilities
and available opportunities in the BIpm for better
understating of process mining analysis.
2.1 Input Fields
According to the expected attributes of standard event
logs for process mining, given data logs in Power BI
should have these attribute fields: CaseId (i.e., the
identifier for each case), Activity (i.e., activity name
associated to events), and Timestamp (i.e., the
execution time of one activity regarding to the
determined case). Moreover, Path threshold and
Activity threshold are optional fields. Other event and
process attributes such as Resource, Cost, lifecycle,
etc. can be used for multidimensional analysis and to
enrich analysis by adding further insights. An
example of an event log is mentioned in Table 1.
Table 1: Sample rows of an example event log.
Case Id Activity Timestamp Resource Customer
Type
1142 Register 11:25 System Gold
1142 Analyze Defect 12:50 Tester3 Gold
1142 Repair (Simple) 13:25 SolverS1 Gold
1145 Register 11:44 System Silver
1142 Test Repair 17:12 Tester1 Gold
1142 Restart Repair 18:15 System Gold
46 Test Repair 05:47
Tester6
Bronze
46 Inform User 06:00 System
Bronze
46 Archive Repair 06:02 System
Bronze
45 Register 19:36 System
Gold
45 Analyze Defect 19:36 Tester3
Gold
45 Repair (Simple) 20:01 SolverC2
Gold
To get the proper output process model, the following
practical points are recommended to be considered in
the Power BI report designing level:
1. The data type of “CaseId” field should be
numeric for performance reasons, but simple
conversions are available. The data type of
“Timestamp” field can be the time or series of
integers.
2. Generally, CaseId, Activity, and Timestamp
attributes should be set as "Don't summarize" to
be considered as the row based granularity in the
data input gateway for the custom visual. It can be
done in the drop-down menu of each field slot in
the Fields pane.
DATA 2019 - 8th International Conference on Data Science, Technology and Applications
124
3. The values for “Path threshold” and “Activity
threshold” have to be set in the range of 1-100.
This threshold is for determining the percentage
of path or activity based on the unique values of
case identifiers (i.e., distinct count of CaseId) that
should be participated in plotting the final output
graph. Initially, the default values of “Path
threshold” and “Activity threshold” are 80 and
100 respectively.
4. For the “Path threshold,” to avoid plotting
disconnected output graph, even in the lowest
value, main paths are kept in the result process
models.
5. Using "what if parameter" technique of Power
BI for “Path threshold” and “Activity threshold”
(ranged 1-100 and changed it to the single value)
provides the option for end users to change the
thresholds to identify their effects on the output
process model when they are working with
dashboards interactively. If these fields are left
empty, these settings can also be changed through
the Power BI desktop and designing mode of the
Power BI service by the “Thresholds” choice in
the "Format" pane which is located on the right
side of "Fields" pane, below the “Visualizations”
pane.
By dragging all mandatory fields into the visual
custom data field slots, BIpm creates the process
model in the format of the directed flow graph. The
provided output has many user-friendly features to
analyze interactively for better scrutinizing aspects of
processes in a multidimensional manner.
2.2 BIpm Capabilities
In addition to the general capabilities being available
within Power BI and in the produced process model
visualization, we would like to highlight some
important features of doing process mining with
BIpm. All these features are illustrated using a simple
event log containing information about repairs (the
Process Mining Group, Math&CS department, 2016).
For a better understanding of multidimensional
analyses, we added more two fields to the event log,
the first one is the random label of customer-cluster
(Gold, Silver, and Bronze) and the second one is the
random label for repair types (Normal and
Emergency) that both of them are case attributes.
2.2.1 Cross Filtering
Using BIpm provides the opportunity to do process
mining by applying many other visual objects which
are available in the default visualization pane of
Power BI and also at Microsoft AppSource.
Therefore, process mining analysis along with many
self-service BI features becomes ready to use.
Meanwhile, one of the useful capabilities is filtering
the data with many other visualization dice and slice
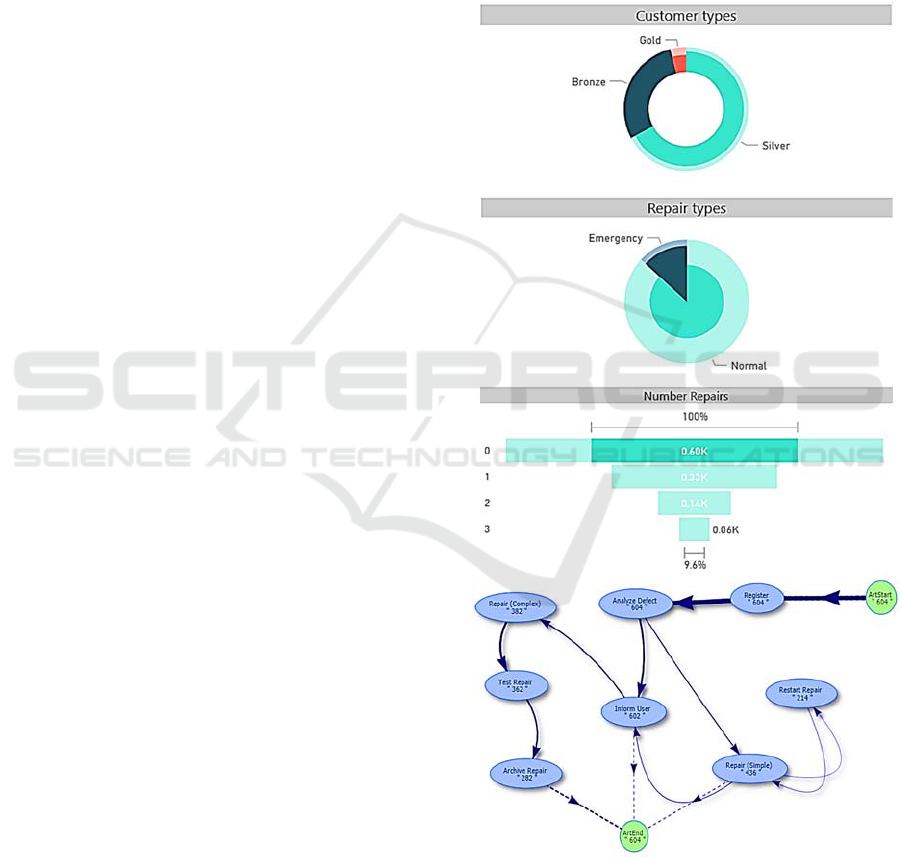
features. For example, Figure 1 shows the process
model in the downside, for three dices applied to
visual charts related to the input given log, Customer
types=”Silver,” Repair types=”Normal” and
NumberRepairs=0 (Figure 1).
Figure 1: The sample dashboard that is containing the
process model for the three dimension filtered data model
by just clicking on the related top visual charts.
Note that, BIpm not only let us apply process mining
on filtered data based on BI features, it allows to filter
BIpm: Combining BI and Process Mining
125
the given data based on process mining features. For
example, we could filter out process instances with
that two activities are executed directly after each
other in them.
2.2.2 Highlighting the Activity and Its
Related Nodes
If the process model is complicated with many
activities, the ability to analyze each activity with its
following connections can be useful due to the
complexity reduction of the process model.
Therefore, this is offered by BIpm in the way, i.e.,
shown on the left side of Figure 2. Besides, by
clicking on each node, it becomes highlighted in
yellow (Figure 2- the right side). This feature helps to
focus attention.
Figure 2: Left side: a sample of applying activity selection.
Right side: an example of the activity highlighting.
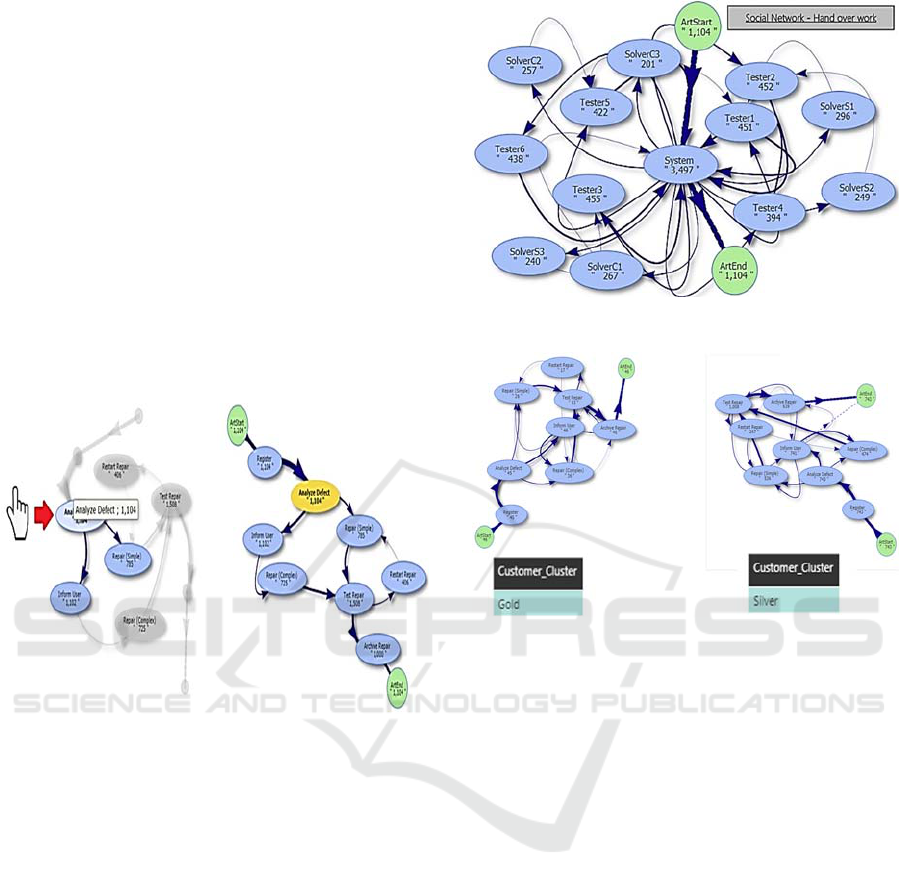
2.2.3 Plotting the Social Network of the
Handover of Work
It is possible to get the social networks of resources
when the original event log has the resource attribute.
When the resource field is chosen instead of the
activity field, the social network of the handover of
work is created and visualized (Figure 3).
2.2.4 Process Models Comparison
The option of “Visual level filters” provided for all
custom visuals in Power BI allows the user to
compare different process models used sliced or diced
data. For instance, it is possible to study the
differences between two process models of gold and
silver customers by setting the filter for the first BIpm
visual instance with the Gold item and another one
with the Silver item as it is shown in Figure 4.
Figure 3: An example of a social network.
Figure 4: Comparing two process models.
2.2.5 Online Process Monitoring
In many industries, for decision makers, it is crucial
to have on-line analysis instead of off-line results. For
example, the number of concurrent tasks of a human
resource could affect the performance of him/her. So
if the number of current works of each employee
could be monitored in a real-time situation could help
managers to distribute works.
The advantage of using Power BI, let business
owners connect their designed business dashboards to
online streams. This type of connections allows us to
monitor the ongoing process models of a business in
a real-time. Note that, this feature can process mining
more applicable.
2.2.6 Sharing Process Mining Analysis
After applying BIpm features, users can share the
corresponding designed dashboard with the fixed or
adjustable settings to others. There are also many
ways to export the process mining analysis. For
example, users can create a PDF file from the
discovered process model, when using Power BI
service, the dashboard can be published on the web
DATA 2019 - 8th International Conference on Data Science, Technology and Applications
126

and it can be put in other webpages as a web part, or
export the CSV file of an event log after applying
different filtering on it.
As it is possible to define different roles in Power
BI, we could apply various access levels for reports.
For example, even the source of data for all reports is
the same, the possible views of users in HR
department may be different from views in the
finance department.
Nowadays confidentiality issues are critical for
companies. As BIpm provides the service integrated
into MS Power BI, there is no need to pass data from
various tools.
3 COMPLEMENTARY
MATERIALS
BIpm was published on Microsoft AppSource under
“Power BI visuals” category and can be obtained via
the following link:
https://appsource.microsoft.com/product/power-bi-
visuals/WA104381928?tab=Overview.
During downloading any custom visual from
AppSource, there are some useful step-by-step
instructions about how to import the custom visuals
into Power BI. Moreover, we have prepared some
complementary guidelines and documents to
empower users to apply BIpm successfully:
1. There are some prerequisites to use BIpm such
as installing R packages and enabling R scripts
running in Power BI. These are described briefly
at http://processm.com/powerbi-custom-visuals/
bipm/installing-bipm/.
2. There are some necessary guidelines for how
to set input data fields which are mentioned at:
http://processm.com/powerbi-custom-visuals/
bipm/.
3. The power BI project sample (.pbix format)
based on repair log scenario is also prepared and
it can be downloaded from this link: https://
github.com/hnreza/ProcessM/blob/master/Proces
sM.pbix.
4. The online demo on the Power BI service is
available at: https://app.powerbi.com/
view?r=eyJrIjoiMzUyZDAyMmQtYjRjNC00YT
YwLWFiOGQtMzVmZmNmYWYyMWFkIiwi
dCI6ImM0ZDAyZmZlLTRlYTctNDViZC1iYTc
wLTg5OWM3NTVkOGNhYiIsImMiOjl9 .
4 CONCLUSION
In this paper, the capabilities and features of BIpm as
a custom visual for doing multidimensional process
mining in Microsoft Power BI are introduced. This
solution provides the opportunity to analyze
complicated event logs with many classes of cases to
distinguish hidden insights of processes in a
multidimensional manner. BIpm offers many
interactive capabilities that tightly integrate BI and
process mining functionalities.
Meanwhile, many significant features of BIpm
such as highlighting, cross-filtering, comparing, and
creating the social network along with some useful
capabilities of Power BI were explained briefly.
Generally, our proposed approach, on the one hand,
enriches BI dashboards with interactive and online
process mining and on the other hand, persuades BI
users to expand their toolset by inferring process
models using BIpm.
As future work, we aim to provide other process
mining analysis e.g., conformance checking and
bottleneck analysis in MS Power BI.
REFERENCES
van der Aalst, W.M.P., 2016. Process mining: data science
in action. Springer. Heidelberg, 2
nd
edition.
van der Aalst, W.M.P., 2013, Process cubes: Slicing,
dicing, rolling up and drilling down event data for
process mining. In Asia-Pacific Conference on
Business Process Management (pp. 1-22). Springer,
Cham.
van der Aalst W.M.P., Adriansyah A., van Dongen B.,
2012. Replaying history on process models for
conformance checking and performance analysis. Wiley
Interdisciplinary Reviews: Data Mining and
Knowledge Discovery, 2(2), pp.182-192.
van der Aalst, W.M.P., Van Hee K.M., Van der Werf J.M.,
Verdonk M., 2010. Auditing 2.0: Using process mining
to support tomorrow's auditor. Computer, 43(3).
Agrawal, Rakesh, Dimitrios Gunopulos, and Frank
Leymann. "Mining process models from workflow
logs." International Conference on Extending Database
Technology. Springer, Berlin, Heidelberg, 1998.
Bolt, A. and van der Aalst, W.M., 2015, Multidimensional
process mining using process cubes. In International
Conference on Enterprise, Business-Process and
Information Systems Modeling (pp. 102-116). Springer,
Cham.
Ferrari, A., Russo, M., 2016. Introducing Microsoft Power
BI. Microsoft Press.
Microsoft, 2019. Data sources for the Power BI service.
Microsoft documentation. [Online] Available at: url:
https://docs.microsoft.com/en-us/power-bi/service-get-
BIpm: Combining BI and Process Mining
127

data [Accessed 14 January 2019].
Microsoft, 2019. Go from data to insight to action with
Power BI Desktop. [Online] Available at: https://
powerbi.microsoft.com/en-us/desktop/ [Accessed 14
January 2019].
The Process Mining Group, Math&CS department,
Eindhoven University of Technology, 2016. Repair
Example. [Online] Available at: url: www.
processmining.org/_media/tutorial/repairexample.zip
[Accessed 14 January 2019].
DATA 2019 - 8th International Conference on Data Science, Technology and Applications
128
