
Real-world Test Drive Vehicle Data Management System for Validation
of Automated Driving Systems
Lars Klitzke
1
, Carsten Koch
1
, Andreas Haja
1
and Frank K
¨
oster
2
1
Hochschule Emden/Leer, University of Applied Sciences, Department of Electronics and Informatics, Emden, Germany
2
German Aerospace Center (DLR), Institute of Transportation Systems, Braunschweig, Germany
Keywords:
Scenario Mining, Automated Driving Functions, Validation, Large-scale Test Drives, Data Management
System.
Abstract:
For the validation of autonomous driving systems, a scenario-based assessment approach seems to be widely
accepted. However, to verify the functionality of driving functions using a scenario-based approach, all sce-
narios that may be relevant for the validation have to be identified. Real-world test drives are mandatory to
find relevant and critical scenarios. However, the identification of scenarios and the management of the cap-
tured data requires computational assistance to validate driving functions with reasonable effort. Therefore,
this work proposes a highly-modularised multi-layer Vehicle Data Management System to manage and sup-
port analysing large-scale test campaigns for the scenario-based validation of automated driving functions.
The system is capable of aggregating the vehicle sensor data to time-series of scenes by utilising temporal
discretisation. Those scenes will be enriched with information from various external sources, providing the
foundation for efficient scenario mining. The practical usefulness of the proposed system is demonstrated
using a real-world test drive sequence, by finding lane-change scenarios and evaluating an onboard system.
1 INTRODUCTION
In the last decades, the effort for developing new
Driver Assistance Systems (DAS) and improving
available ones has significantly increased, aiming at
an overall more comfortable driving experience. In
particular, the domain of DAS validation has gained
much attention in the last years. Due to the ever-
increasing complexity of designing and testing DAS
and the need to manage this complexity economi-
cally, recent and current research projects aim to pro-
vide methodologies, methods and tools (Haja et al.,
2017)(Winner et al., 2018) to reduce the effort for the
validation or, in particular, enable to approve auto-
mated driving functions w.r.t to functional safety stan-
dards such as the ISO26262.
Technical advances in the field of computer graph-
ics and computer simulation during the last decades
paved the way for new testing methods to master
the growing complexity of driver assistance systems.
With more sophisticated models of real-world compo-
nents becoming available, testing shifted from the real
world to the virtual world. This is due to the fact that
simulations allow to conduct risky manoeuvres with-
out jeopardising test engineers or other traffic partic-
ipants(Stellet et al., 2015) and enable to reach a high
test coverage economically (Schuldt, 2017).
Nevertheless, test drives with the system under
test (SUT) in the real world are currently indispens-
able due to the lack of other available certified meth-
ods for finally proving the functionality of the system
(Winner et al., 2018). Simulation-based testing can-
not be used for the functional approval process alone
since they are currently not able to sufficiently repre-
sent the extraordinary complexity of the real world.
Due to this, testing results ”need to be verified and
validated on test grounds and in field tests” (Winner
et al., 2018), and real-world test drives are mandatory
for finding relevant or critical scenarios which are the
basis for scenario-based validation approaches (Men-
zel et al., 2018)(Bach et al., 2016).
1.1 Motivation
Still, assessing DAS functionality in the real world us-
ing Field Operations Tests (FOT) or Naturalistic Driv-
ing Studies (NDS) is complex but tedious and thus
cost-intensive. That is at first due to the high amount
of kilometres that is required to prove that the SUT
works reliably (Kalra and Paddock, 2016).
Klitzke, L., Koch, C., Haja, A. and Köster, F.
Real-world Test Drive Vehicle Data Management System for Validation of Automated Driving Systems.
DOI: 10.5220/0007720501710180
In Proceedings of the 5th International Conference on Vehicle Technology and Intelligent Transport Systems (VEHITS 2019), pages 171-180
ISBN: 978-989-758-374-2
Copyright
c
2019 by SCITEPRESS – Science and Technology Publications, Lda. All rights reserved
171

Furthermore, engineers have to process that mas-
sive amount of data collected during such test cam-
paigns in order to examine and verify the response of
the system in specific scenarios for proving the sys-
tem’s functionality or fine-tuning the parameter of the
SUT. Engineers have to know where to find specific or
rather relevant scenarios in the data such as an over-
taking sequence on a wet two-lane motorway driving
towards sundown.
Discovering such scenarios may become an enor-
mous economic burden and tedious task if analysing
the data without computational assistance. That in-
cludes labelling the data with additional information
for the identification of scenarios, performance as-
sessment of a system or for providing a comprehen-
sive data basis for deep learning. Despite that, the
vast amount of data gathered during test campaigns
need to be managed somewhere accessible by multi-
ple project participants. Data Management Systems
(DMS) have shown to be the right choice for such
data management and analysing tasks due to their us-
age in various domains, e.g. medicine(Fraenkel et al.,
2003), ecology (Frehner and Br
¨
andli, 2006) or finance
(Shavit and Teichner, 1989).
The identification of scenarios in real-world test
drives, so-called scenario mining (Elrofai et al.,
2018), and analysing the influence of environmental
effects on the system performance is still an open re-
search question and the focus of the research project
FASva
1
. Besides that, the project aims at conduct-
ing and analysing real-world test drives and propose
tools and frameworks supporting scenario-based real-
world test drive data analysis. Therefore, test drives
of approx. 25,000 km were conducted on motorways,
cities and rural roads in mainly northern Germany
within the last two years. This data is the basis for ad-
dressing the following open research question within
the research project:
1. How to automatically identify scenarios in real-
world test drive data efficiently for setting up a
rich catalogue of general driving scenarios and for
enabling scenario search?
2. Which scenarios are relevant for the functional ap-
proval process of specific driving functions?
3. Which parameters are system-relevant in certain
scenarios?
4. How to evaluate the performance of conducted
real-world test drives to ensure conducting test
campaigns efficiently?
1
Intelligente Validierung von Fahrerassistanzsystemen
(engl.: intelligent validation of driver assistance systems)
of the Hochschule Emden/Leer.
1.2 Contribution of this Work
This work addresses the design of a system ar-
chitecture for a Vehicle Data Management System
(VDMS) that manages and analyses real-world test
drive campaigns helping engineers finding scenarios
of interest in the collected data. Hence, this pa-
per discusses a partial solution to the first research
question by proposing a system for efficient sce-
nario identification and search. Therefore, the work
discusses requirements for such a scenario mining
system from different perspectives or roles utilising
software-quality standard characteristics defined in
ISO/IEC 25010.
Based on the derived requirements, the work
proposes a highly-modularised multi-layer VDMS,
that is used within FASva, to manage and support
analysing large-scale test campaigns for the scenario-
based validation of automated driving functions that
is capable of aggregating the vehicle sensor data to
scenes and enriching these scenes with information
from various external sources. The latter is espe-
cially helpful if onboard sensors were missing but the
analysis demands specific information in detail, e.g.
about the weather or road. It also allows generating
new aggregated signals like the time-to-collision with
other traffic participants or integrating alternative al-
gorithms as a reference for system evaluation. These
functions or algorithms can be added to the VDMS
to add further knowledge–even after the campaign.
Hence, performing test drives with the missing sen-
sors again is not required which cuts down expenses.
1.3 Paper Structure
This work is structured as follows: An overview of
related work is given in Section 2. Afterwards, re-
quirements on a VDMS are determined in Section 3.
Therefore, relevant user-roles within such projects are
defined and based on these, role-specific requirements
are derived which are the base for the architecture
proposed in Section 5. In Section 4 the processing
chain for transforming the multivariate time-series of
sensor data to a time-series of enriched scenes is dis-
cussed. The proof-of-concept is demonstrated in Sec-
tion 6 with two use-cases: assessing the performance
of an onboard driver assistance system and finding
scenarios in real-world driving data. For the first,
the onboard Lane Keep Assist System (LKA) of the
research vehicle is selected and for the latter, lane
change scenarios on highways will be identified us-
ing the VDMS.
VEHITS 2019 - 5th International Conference on Vehicle Technology and Intelligent Transport Systems
172

2 RELATED WORK
Finding scenarios for the validation of automated
driving functions obtained much attention since the
last years. In particular, the focus is on the identifica-
tion of relevant situations (Damm et al., 2018) in, e.g.
databases of traffic accidents (P
¨
utz et al., 2017), field
operational tests (Benmimoun et al., 2011) or natural-
istic driving studies (Klauer et al., 2006) aiming at set-
ting up a database of relevant traffic scenarios for the
validation of automated driving functions(P
¨
utz et al.,
2017). However, for the identification of such rele-
vant scenarios, the data of the conducted test drives
need to be managed and analysed.
Schneider et al. utilise a probabilistic approach
using a Bayesian network and fuzzy features for
the classification of emergency braking situations
(Schneider et al., 2008). Weidl et al. optimise the
Bayesian networks to recognise driving manoeuvres
online (Weidl et al., 2014). In (Roesener et al., 2016)
scenario-specific classification algorithms are evalu-
ated for the identification of lane changes, vehicle fol-
lowings and cut-ins.
All of the approaches have in common that they
classify scenarios based on the vehicle sensor data.
Thus, one can argue that they perform multivariate
time-series analysis, as already pointed out by (Roe-
sener et al., 2016). Taking the vast amount of data
gathered during test-campaigns into account, reduc-
ing the data without high loss of information would,
in turn, reduce the required storage capacity, the clas-
sification time and thus validation effort. Further-
more, utilising the definition of the term scenario from
(Ulbrich et al., 2015) stating that a scenario describes
a particular time interval with environment and traffic
conditions, and including the description of the term
scene representing a certain point in time, the vehicle
sensor data has to be aggregated to a time-series of
scenes for describing scenarios.
Therefore, we propose a temporal data discretisa-
tion approach to aggregate the raw vehicle sensor data
to discrete scenes w.r.t to the time using equal width
discretization (Liu et al., 2002) and by applying type-
dependent data aggregation functions to reduce the
data size (Moskovitch and Shahar, 2015) while at the
same time establishing the foundation for scene-based
scenario mining.
3 REQUIREMENTS ON VDMS
Due to the high economic effort of conducting real-
world test drives, multiple parties usually plan and
perform test campaigns. In this work, however, we
focus on the roles, people have within such an DAS
project, working with the VDMS. A description of
these roles of interest is given in this section includ-
ing role-based functional requirements on the archi-
tecture which are the basis for deriving general re-
quirements utilizing software quality characteristics
defined in the ISO 25010.
1. The campaign manager is responsible for the
achievement of the project goals and acts as an
interface to the principal or project owner. Con-
sequently, they need up to date status information
about the project’s progress.
2. On behalf of the campaign manager, the drive
planner plans the conduction of the specific test
drives w.r.t to the general campaign goals and
the current test drive coverage. They, therefore,
require more detailed knowledge about the per-
formed test drives including, for instance, the
weather condition on specific trips or the road
type distribution.
3. Test drivers perform the actual test drives accord-
ing to the plans of the drive-planner. After each
drive, they have to verify the fulfilment of drive-
specific test requirements. The result may be
a report, used by the driver planner to organise
follow-up drives.
4. Test engineers perform the in-depth validation of
the SUT. Based on the defined specification of the
system, they verify the performance of the SUT.
Hence, they need access to the sensor data col-
lected by the test fleet in case of a system misbe-
haviour.
5. The last role of interest is the Algorithm engi-
neer. People with this role either optimize design
and develop new system functions or alternative
solutions. The former allows adding additional
knowledge to the database which may help in the
SUT validation whereas the latter allows evaluat-
ing a SUT against a reference system, i.e. evaluate
the performance of different traffic-sign-detection
systems.
Concluding this overview, it is evident that differ-
ent roles have various functional requirements on the
VDMS w.r.t the grad of information detail or how to
access the data or even extending the VDMS func-
tionality. Based on the defined role-specific require-
ments, general characteristics of the architecture are
now defined. Therefore, in order to ensure a software-
quality driven design approach, a subset of the soft-
ware quality characteristics defined in the ISO 25010,
the successor of the ISO 9126, is employed.
Real-world Test Drive Vehicle Data Management System for Validation of Automated Driving Systems
173

Scaleability. Test drive campaigns typically have a
specific duration spanning from several months up
to years. Furthermore, the fleet of test drive cam-
paigns typically consists of multiple vehicles and the
test drivers may change during the campaign. Thus,
the demand on a scalable framework exists in order to
gap-free document the progress of the campaign in-
cluding information about the drivers, e.g. sex, weight
and height which might be used for driver behaviour
or system acceptance analysis, or the configuration of
each vehicle used within the campaign, such as the
dimension of vehicles or sensor configurations.
Compatibility. Unfortunately, there is currently no
standard tool to measure the vehicle sensor data. Con-
clusively, this also applies to the data format used for
storing the vehicle sensor data. Thus, besides the file
format of ADTF
2
used within this project, the VDMS
should be able to support diverse data file formats.
Furthermore, it should be able to manage informa-
tion of external data sources, such as OpenStreetMap,
which are required for the system analysis.
Maintainable. In order to support multiple data file
formats or extend the functionality of the VDMS,
adding new modules to the VDMS is vital. Thus,
the architecture has to be highly modular – on dif-
ferent levels of the system. On the top level, where
drive-related tasks run, adding further modules is re-
quired to process drives that were uploaded by test
drivers, i.e. import the drive into the database, query
the weather database based on the route in the drive
or compress the files of the drive after the processing.
Whereas on the level, where the processing of the ve-
hicle sensor data takes places, adding new functions
is required to add new facts to the database using,
e.g. external data sources or developed algorithms,
as stated in the previous description of the Software
engineer role.
Reliability. In order to ensure that failures or non-
normative behaviour of functions or algorithms added
by engineers do not affect the whole system process,
each module should run in a dedicated context. In
case of an error of a module, the system should log
this information and appropriately indicate that error.
2
The Automotive Data and Time-triggered Framework
(ADTF) of Elektrobit is used for synchronous data measure-
ment and capturing.
4 VEHICLE DATA PROCESSING
CHAIN
For the scene-based identification of scenarios in the
real-world test-drive data, this work presents a three-
stage process. The data basis are the raw vehicle
sensor data that are transformed to series of scenes.
Those scenes will be enriched with additional infor-
mation from external data sources or algorithms as
shown in Figure 1. In this section, each stage is de-
scribed briefly.
4.1 Data Discretisation and Aggregation
The first step is the temporal data discretisation and
aggregation utilising equal width discretisation(Liu
et al., 2002) and applying type-depend aggregation
operations.
Discretisation. At first, the time series of the avail-
able sensors are discretisised to a time series of scenes
on a per-drive basis.
Therefore, let D = {t
b
, S,t
e
} represent a drive as
a set with three elements, whereas t
d
b
, t
d
e
∈ N giving
the beginning and end time of the drive d as mil-
liseconds since epoch and S =
{
s
1
, s
2
, .. . ,s
k
}
as the
discretisesed and aggregated vehicle sensor data as
a set of k scenes. Utilising the definition of mul-
tivariate time-series of (Baek and Kim, 2017), let
E = {e
1
, e
2
, .. . ,e
m
} be a set of m vehicle sensors,
each of which generates a finite series of n values
x
1
, x
2
, .. . ., x
n
. Since the vehicle sensors have dif-
ferent sample frequencies and thus the sensor se-
ries vary in length, the definition of (Baek and Kim,
2017) is adapted so that x
i
=
x
i
1
, x
i
2
, .. . ,x
i
n
i
repre-
sents the time series of the ith sensor with n
i
val-
ues. Furthermore the multivariate time series X is
defined as a set of vehicle sensor time series with
X = {x
1
, x
2
, .. . ,x
m
}.
For the discretisation of the multivariate time se-
ries X into a time series of scenes, equal width dis-
cretisation (EWD) is applied to each sensor series
(Liu et al., 2002). Hence, using the previous defini-
tion of x
i
, the time series of the ith sensor is split up
into a series of k scenes u
i1
, u
i2
, .. . ,u
ik
with equal du-
ration ∆t so that the jth scene time series of the ith
sensor is defined as
u
i j
= {x | x ∈ x
i
∧
t
j
s
≤ Φ(x) ≤ t
j
s
+ ∆t
} (1)
whereas Φ(x) giving the time of the sample x in
the time series and t
j
s
stating the beginning of the jth
scene s. Furthermore, the number of scenes k = |S| in
the drive d is given by
VEHITS 2019 - 5th International Conference on Vehicle Technology and Intelligent Transport Systems
174
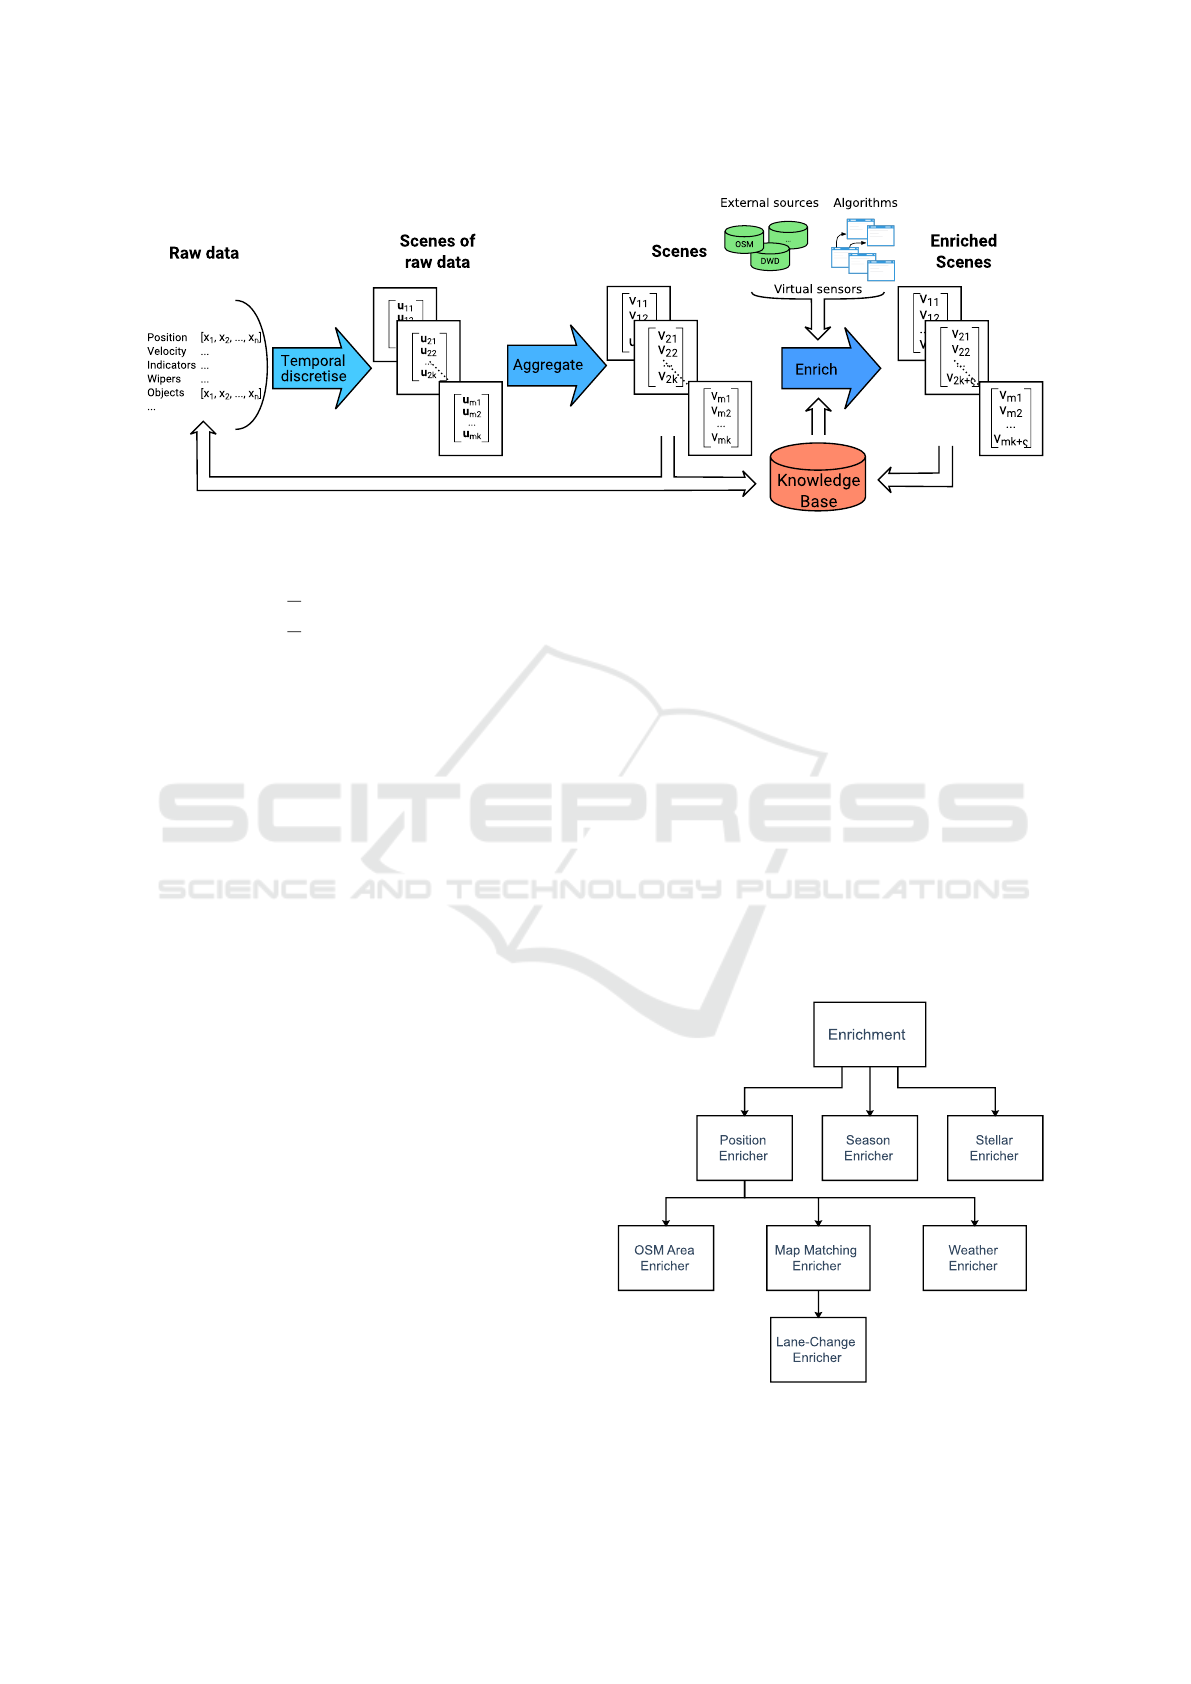
Figure 1: Three stage process for transforming the vehicle sensor data to a series of scenes enriched with additional informa-
tion from algorithms and external data sources as the foundation for scene-based scenario identification.
k =
(
e
d
∆t
+ 1 if
e
d mod ∆t > 0
e
d
∆t
if
e
d mod ∆t ≡ 0
(2)
with
e
d stating the duration of the drive d. Then,
utilizing the definition of (1) the series of scenes S of
a drive d is formally defined by the m × k matrix
S
d
=
u
11
u
12
. .. u
1k
u
21
.
.
.
.
.
.
.
.
.
.
.
.
.
.
.
.
.
.
.
.
.
u
m1
. .. . . . u
mk
. (3)
Aggregation. The next step is to aggregate the
sensor series of each scene. Therefore, let A =
{a
1
, a
2
, .. . ,a
m
} represent a set of m aggregation func-
tions for each sensor, mapping the scene time series
u
i j
of the ith sensor to an aggregated value v
i j
with
a ∈ A : u
i j
→ v
i j
. Then, using the Equation (3), the
series of scenes S of a drive d is formally represented
by the m × k matrix
S
d
=
a
1
(u
11
) a
1
(u
12
) . . . a
1
(u
1k
)
a
2
(u
21
)
.
.
.
.
.
.
.
.
.
.
.
.
.
.
.
.
.
.
.
.
.
a
m
(u
m1
) . . . . . . a
m
(u
mk
)
(4)
where the scene s
t
at time t is represented by the
column vector s
t
= [a
1
(u
1t
), a
2
(u
2t
), . . . , a
m
(u
mt
)]
T
or in short s
t
= [v
1
, v
2
, . . . , v
m
].
For the data aggregation, a data-type depen-
dent approach was chosen for selecting the ag-
gregation functions. The supported data types
are T = {boolean, integer,floating point, string} and
the set of default aggregation functions is A =
{or, median, mean, concatenate}. The following ap-
plies mapping a scene time series u
i j
to its aggregated
value v
i j
using the aggregation functions of A:
v
i j
=
mean(u
i j
) if ρ(u
i j
) ≡ floating point
median(u
i j
) if ρ (u
i j
) ≡ integer
or(u
i j
) if ρ(u
i j
) ≡ boolean
concate(u
i j
) if ρ (u
i j
) ≡ string
(5)
with x = ρ(u
i j
) giving the value type of u
i j
,
whereas x ∈ T . Besides the default aggregation func-
tions, custom ones can be defined for specific signals.
4.2 Data Enrichment
The last step in the processing chain is the enrichment
of the scenes with additional knowledge to further de-
Figure 2: The enrichment module uses an acyclic graph to
manage components and their dependencies for scene en-
richment visualized as a tree of components.
Real-world Test Drive Vehicle Data Management System for Validation of Automated Driving Systems
175
scribe the vehicle and its environment such as other
traffic participants, the weather or road as depicted at
right of Figure 1. Hence, the previously introduced
set E of vehicle sensors is extended with virtual scene
sensors.
Each virtual sensor is a component running as a
part of the enrichment module (cf. Section 5.2 about
modules). Since a virtual sensor may depend on infor-
mation generated by another sensor, i.e. a map match-
ing algorithm used to map the ego vehicle position
to a digital map depends on a accurate ego-position,
an acyclic directed graph is used to manage the vir-
tual sensors and the dependencies between them. An
overview of the available components is depicted in
Figure 2. Choosing an acyclic graph enables to build
up complex processing chains with components only
being run if their dependants finished processing a
particular drive. It also allows running independent
components concurrently to speed up the processing.
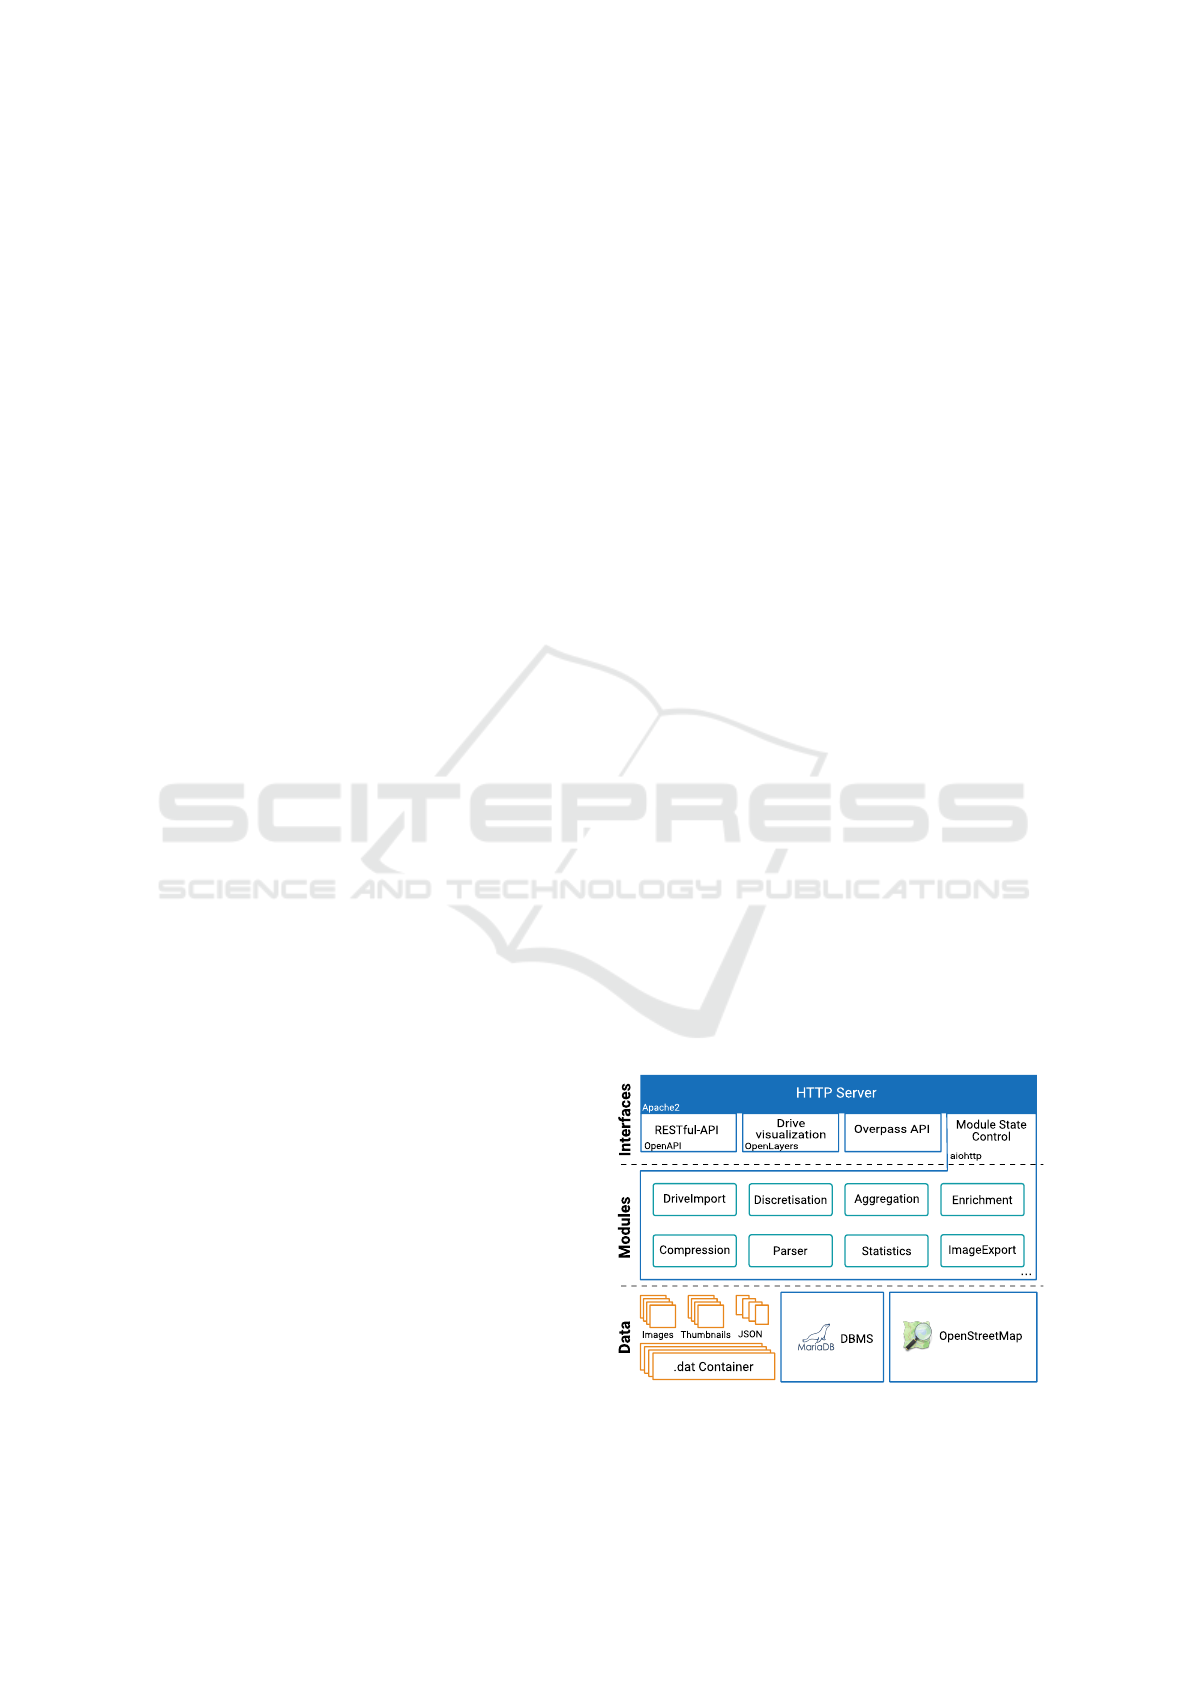
5 ARCHITECTURE
Due to the different roles defined in the Section 3 and
their participation in the project and based on the de-
fined general requirements, an event-driven three-tier
architecture was chosen for the VDMS with the layers
Data, Modules and Interfaces (see Figure 3).
5.1 Data Layer
The bottom layer Data describes every data rep-
resented as a file on the disc generated by either
the modules or external sources including data in
databases. These data files are, for instance, ADTF
container collected during test drives by the test
drivers. Furthermore, the layer includes files gener-
ated by components of the Modules layer, such as im-
ages which are extracted from the ADTF container,
thumbnails of the images or JSON files containing the
decoded CAN data of the ADTF containers.
The extraction of the CAN signal data from the
ADTF container to JSON files is due to the demand
to support other measurement tools such as ADTF as
well. Because by only supporting a single data for-
mat, the usability of the framework is quite limited
and thus the flexibility.
The basic properties of the JSON format provide
information about the vehicle, driver and the time in-
terval of the measurements. The latter is required be-
cause all timestamps of signal values are relative to
the defined start time which enables to change the ref-
erence system easily, i.e. to synchronize the record
times to an absolute reference system even after the
test drive. The special property measurements con-
tains the signal values. Each signal is defined by its
minimum and maximum value, its type (e.g. floating
point number or integer) and unit (e.g. kilometre per
hour). Besides that, it contains all timestamped val-
ues of that signal in the property value sorted by the
signal value timestamps.
5.2 Modules Layer
The second layer Modules entails all modules of the
system. Each module has a distinct functional pur-
pose and is highly independent of the other modules
ensuring a loosely-coupled design and thus facilitat-
ing a scalable and maintainable software system.
The loose coupling of modules is realized by an
event-driven file-system based information passing
method and by utilising the observer pattern for asyn-
chronously notify about module state changes. The
latter is used as the base for the Module State Control
component of the layer Interfaces to asynchronously
notify connected clients, e.g. test engineers, via Web-
Socket connections about the progress of modules.
Whereas the former is used to trigger modules and
thus, start the processing of a certain drive. There-
fore, all modules have the following three parameters,
source, indicate, destination.
The source parameter defines the directory where
the module watches for drives to process. If a module
successfully processed a drive, it creates a new sym-
bolic link in one or multiple directories, defined with
the parameter indicate, to inform all other modules
watching for the directory defined in indicate about
its progress. In the case of modules creating new files,
the parameter destination defines the location where
to put those files.
Having the compatibility in mind, the implemen-
Figure 3: The architecture of the proposed VDMS for man-
aging large-scale test campaigns consists of three layers:
Data, Modules and Interfaces.
VEHITS 2019 - 5th International Conference on Vehicle Technology and Intelligent Transport Systems
176
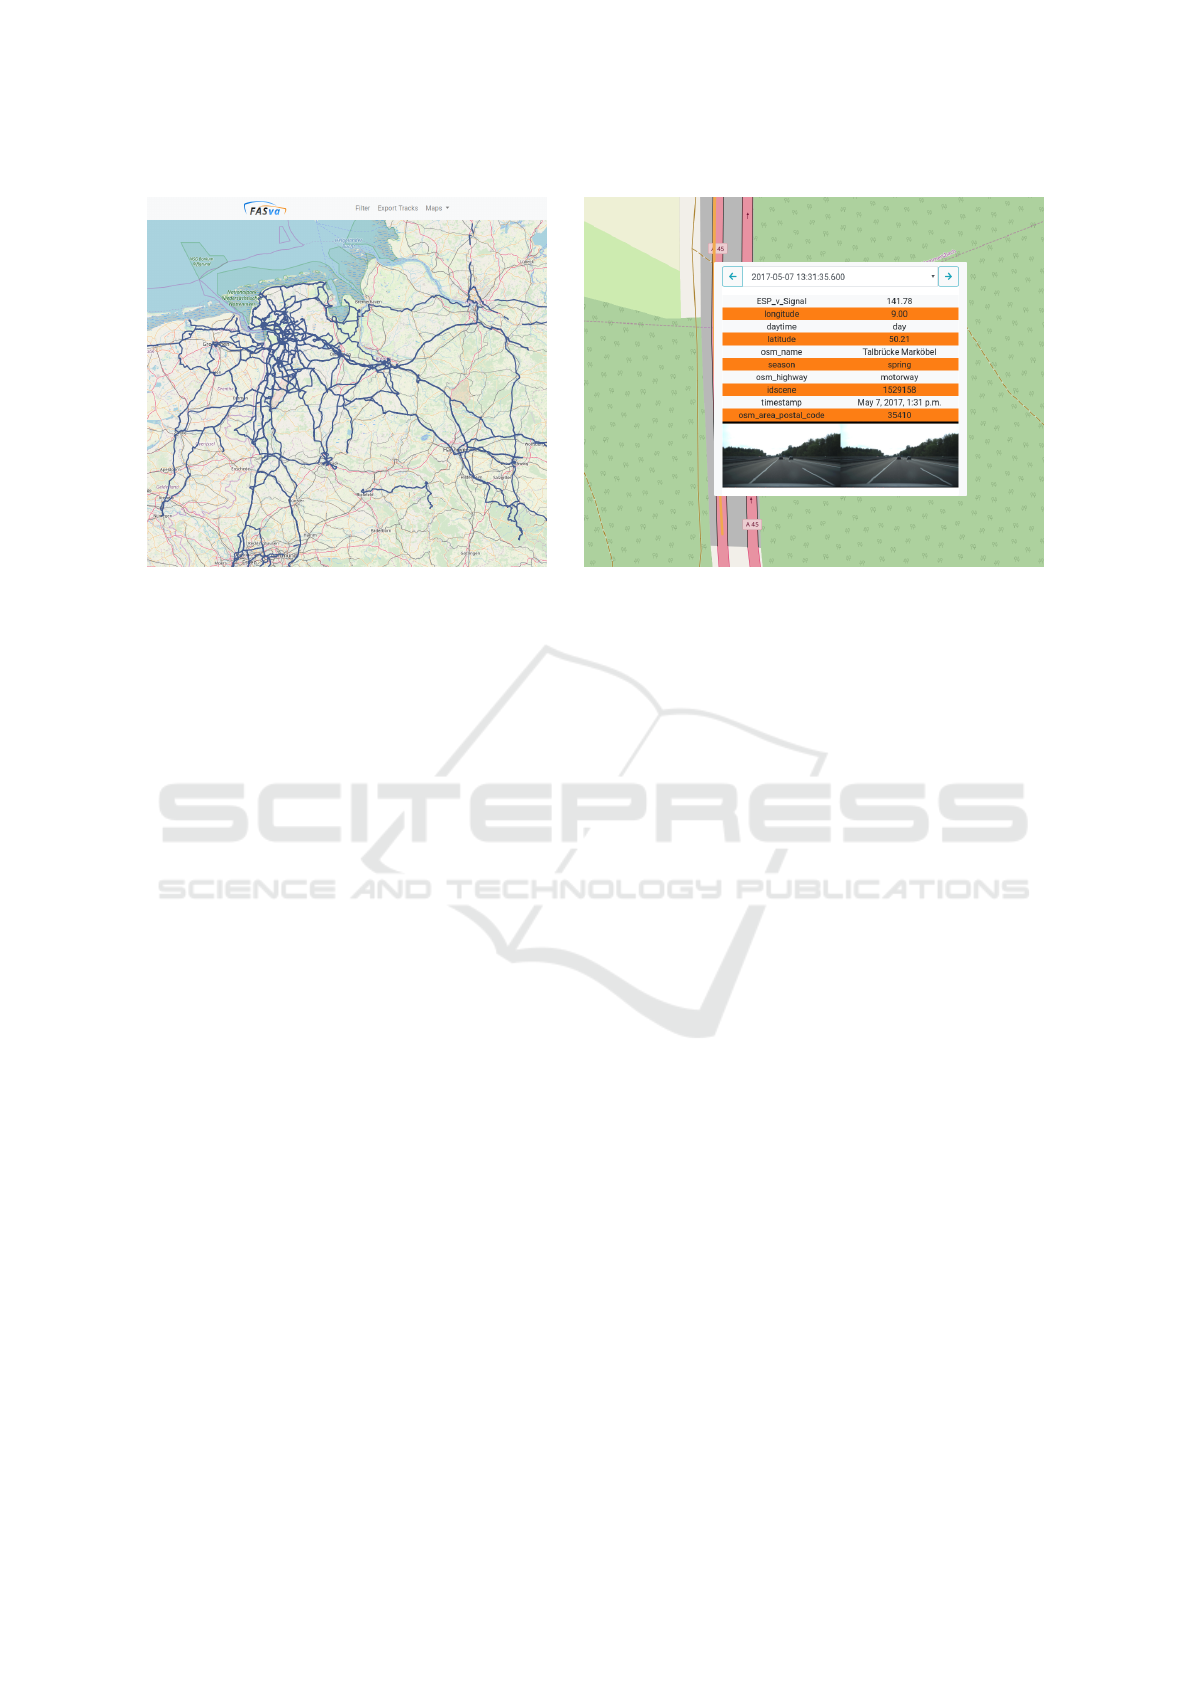
Figure 4: The drive visualisation service provides an interactive web-interface of the conducted test drives including filter
capabilities for efficient sequence identification and track selection for scene analysis. Left: A map of all conducted test
drives. Right: The same zoomed-in map showing information of a selected scene.
tation language of the module functionality is not re-
stricted to the implementation language of the archi-
tecture which currently is Python. Instead, the module
class merely works as a wrapper or adapter to the ac-
tual functionality for saving the state of the module’s
progress in the database and to guarantee the relia-
bility of the framework, i.e. robustify the framework
against misbehaviour or errors in the modules such as
memory leaks.
5.3 Interfaces Layer
The last layer Interfaces provides access to the VDMS
for different project roles with each component of the
layer working as a service interconnected by an HTTP
server.
The Drive visualisation service utilises Open-
StreetMap to show the conducted test drives via an
interactive web-based frontend. The left image in Fig-
ure 4 shows the conducted drives within FASva. The
purpose of this service is to help drive planner by
planning test drives since it gives a rough overview
about the test drive coverage w.r.t the geolocation and
engineers by finding sequences of interest. Therefore,
the web-interface provides filter and selection capa-
bilities. The former enables to search for sequences
with specific characteristics, e.g. test campaign, day-
time, region of interest or road type and the latter
gives access to specific situations or scenes of a drive.
That includes information about the vehicle and its
environment either from onboard sensors, e.g. veloc-
ity or location or any other external sources such as
weather, street type or daytime.
The RESTful-API service provides access to the
data of conducted test drives, e.g. sensor data or im-
ages of cameras and is used by test engineers and
algorithm developers. The OpenAPI specification
is used for the description of the API, allowing to
generate client applications for various programming
languages. The drive visualisation service, for in-
stance, uses the RESTful-API to retrieve the meta-
information and thumbnails of specific situations and
the geolocation of the conducted test drives.
The Module State Control service allows algo-
rithm engineers to interact with the modules of the
Modules layer, e.g. to start the processing of a par-
ticular drive or getting notified if a module finished
processing.
The Overpass API service grant access to the
OpenStreetMap (OSM) server for adding information
about the infrastructure. This enables test engineers
or algorithm developers to find sequences that took
place on specific road types, e.g. motorway or rural
roads. The Map Matching Enricher of the Enrich-
ment module, for instance, uses the OSM server to
retrieve information about the road the vehicle is on,
which is used by the Lane Change Enricher to de-
tect lane changes only on highways.
6 EVALUATION
For the evaluation of the-proof-of concept it is shown
that the proposed processing chain can be used for
finding scenarios of interest and for evaluating driving
functions.
Real-world Test Drive Vehicle Data Management System for Validation of Automated Driving Systems
177
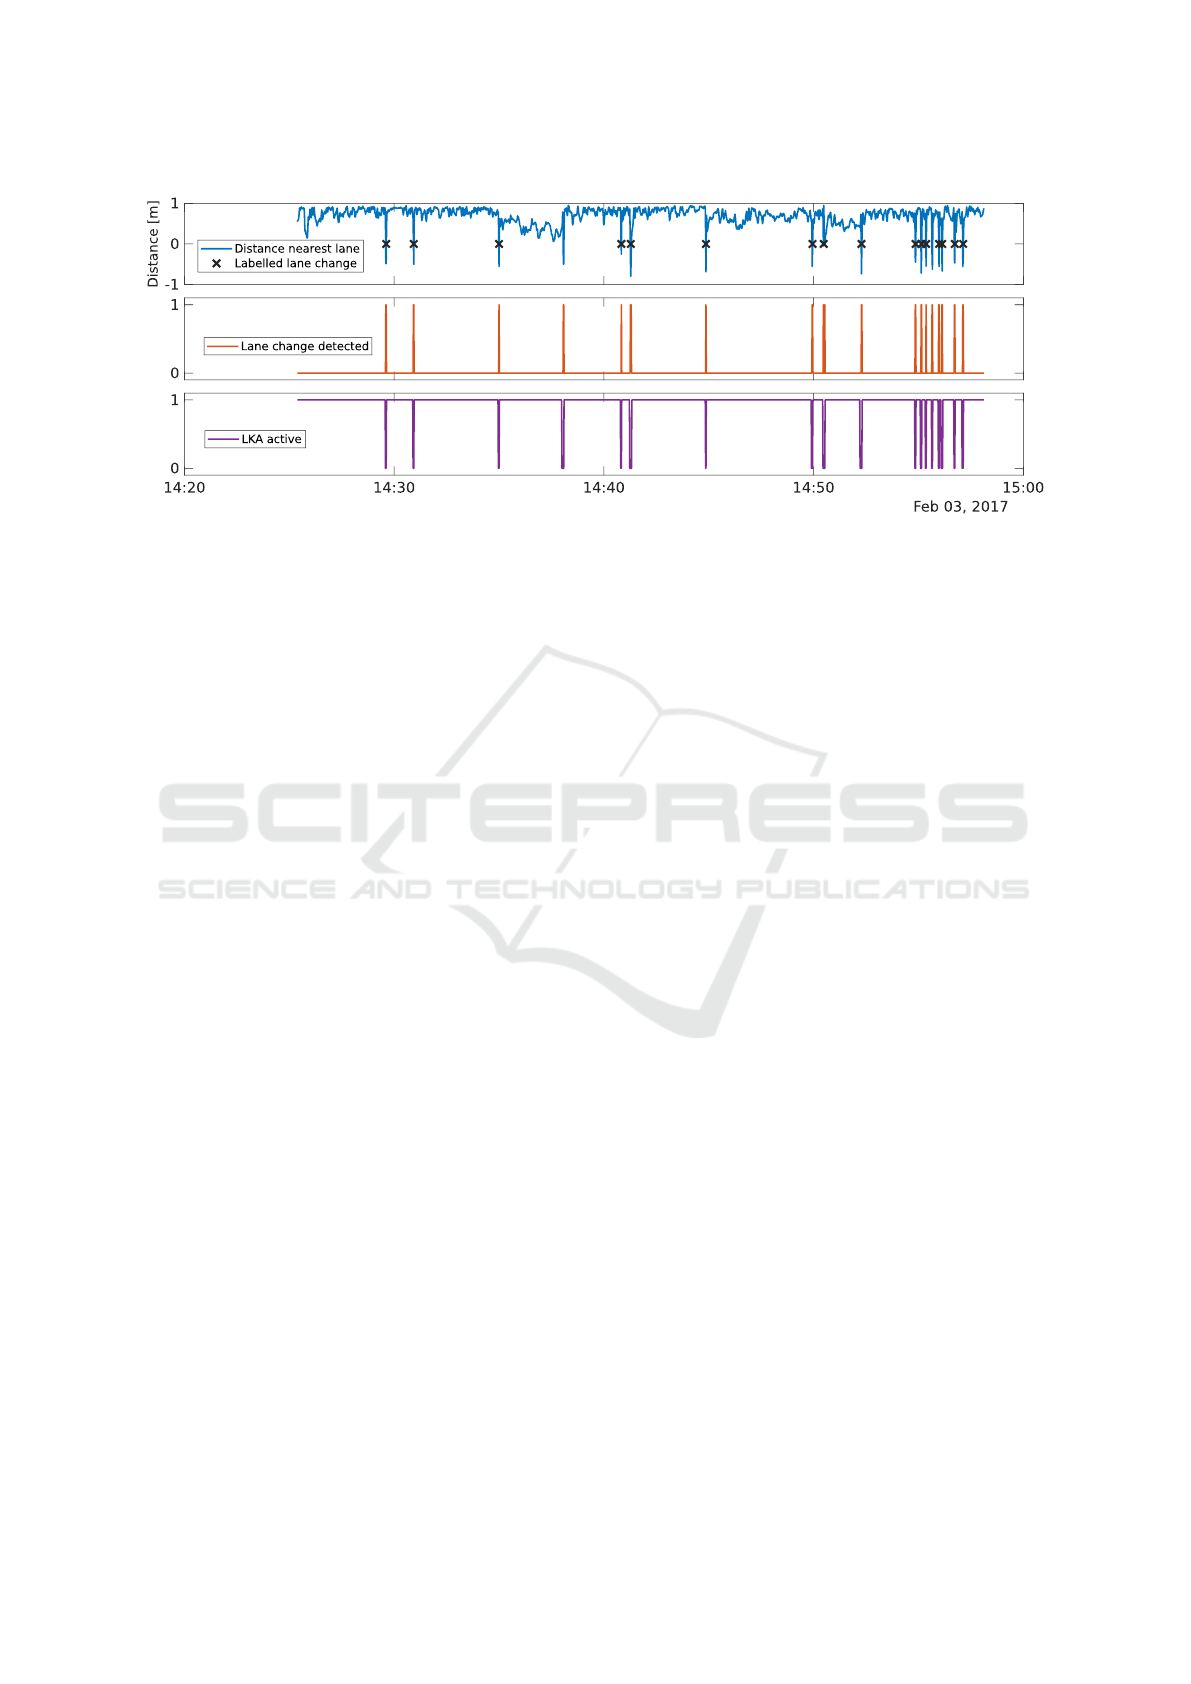
Figure 5: Sequence of a trip on a motorway with two to three lanes for demonstrating the proof-of-concept of the proposed
VDMS for scenario identification and system evaluation. Top: Distance to nearest line and the manually labelled lane changes.
Middle: The detected lane changes of the algorithm. Bottom: The signal of the onboard Lane Keep Assist System.
6.1 Dataset
The data basis is from a short sequence of approx. 100
km conducted with our research vehicle (see Fig-
ure 5). The sequence takes place on a motorway with
three lanes. During the trip, 16 lane changes occurred
which were manually labelled using the drive visual-
isation interface shown in Figure 4.
The sample rate of the vehicle sensors vary be-
tween 25 and 100 Hz. However, during the conver-
sion of the ADTF file format to the described JSON
format in Section 5.1, the sample frequency was lim-
ited to 25 Hz with equal time interval sampling.
For the aggregation of the multivariate time series
to a time-series of scenes as described in Section 4.1
and thus further reduction of the sample frequency, a
scene duration ∆t = 1 second was chosen. This is due
to the fact that, according to an analysis of real-world
drives by (Olsen et al., 2002), the mean duration of
lane changes on motorways is µ = 6.25 seconds with
a standard deviation of σ = 1.64. Thus, assuming a
Gaussian distribution with the parameter (µ, σ) and
ensuring the detection of a lane change using one sec-
ond scene intervals, the probability of a lane change
duration X being greater two seconds P(X > 2) is ap-
prox. 99.52% which is adequate for the analysis.
6.2 Results
For the demonstration on how to find scenarios of
interest–in this case lane change scenarios–a naive
lane change detection algorithm was implemented
and added to the VDMS which uses the distance to
the nearest line signal for finding lane change events.
The evaluation is performed in MATLAB by retriev-
ing the data of the sequence via the RESTful API.
In Figure 5, the orange line indicates the result of
the lane change detection algorithm whereas the black
crosses mark the manually labelled lane changes.
Since classification of lane changes is a binary clas-
sification problem, the F
1
-score is employed for as-
sessing the performance. The algorithm detects all
lane changes correctly but also has four false posi-
tives leading to a F
1
-score of 88.89%. This demon-
strates that even with a significant system-dependent
reduction of the sample size, a robust identification of
scenarios is possible.
Besides the identification of scenarios, the assess-
ment of a SUT is another typical use-case. A test en-
gineer might want to find those situations in which a
SUT such as a LKA does not operate. In Figure 5
the purple line represents the state of the LKA. If the
LKA actively assist the driver, the signal is one and
zero otherwise. Hence, the situations in which the sig-
nal is zero are of special interest. From the Figure 5 it
is evident that on this sequence, the LKA stops oper-
ating if the driver performs a lane change. Hence, this
system does not actively assist the driver during lane
changes. This demonstration shows that by support-
ing the addition of algorithms to the VDMS, reference
signals with a higher confidence or further knowledge
about the vehicle and its environment may help as-
sessing onboard DAS.
7 CONCLUSION
Test drives in the real world are a valuable data source
for finding relevant and critical scenarios which are
required for the validation of automated driving func-
tions (Damm et al., 2018). Since the analysis of
large-scale test campaigns requires computational as-
VEHITS 2019 - 5th International Conference on Vehicle Technology and Intelligent Transport Systems
178

sistance to identify scenarios efficiently, this work
proposes an highly modularized three-tier architec-
ture of a VDMS for the management and analysis of
real-world test drives for the scenario-based valida-
tion of automated driving functions.
Based on a formal definition of time-series of
scenes, a processing chain for transforming the raw
vehicle sensor data to a time series of scenes for sce-
nario mining is presented. That processing chain is
a central component of the proposed VDMS whereas
the design of the architecture follows a requirements-
driven approach by analysing the needs of particu-
lar project roles and deriving specific and general re-
quirements on the architecture.
The proof-of-concept is finally evaluated by us-
ing the RESTful API for identifying lane change sce-
narios based on real-world data. That demonstration
shows that even with a significant reduction of the
sample size, robust identification of scenarios is still
possible. Conclusively, the demonstrations show the
feasibility of the VDMS for identifying scenarios in
real-world test drives efficiently. However, in follow-
up work, an in-depth analysis of choosing the scene
duration ∆t on the performance of different scenario-
mining algorithm has to be conducted.
Focussing on the compilation of a sophisticated
set of scenarios for validating automated driving func-
tions (Damm et al., 2018), several topics need to be
addressed in follow-up work. At first, since the set of
relevant scenarios depends on the road type of the ve-
hicle, the current map matching algorithm needs to be
replaced with a more robust one. For the identification
of other scenarios such as overtaking or approaching,
information about the road and other traffic partici-
pants are required. Thus, in future work, image-based
lead vehicle and road detection will be integrated into
the VDMS.
Besides the enrichment of scene understanding,
follow-up work will address the open research ques-
tions defined in Section 1. At first, future work will
focus on the identification of scenarios in real-world
test drives using the proposed VDMS.
ACKNOWLEDGEMENTS
We thank LG Electronics, Vehicle Solution Company,
Republic of Korea, for supporting this project by co-
operating in capturing large-scale test drives and pro-
viding valuable measurement equipment.
REFERENCES
Bach, J., Otten, S., and Sax, E. (2016). Model based sce-
nario specification for development and test of auto-
mated driving functions. In 2016 IEEE Intelligent Ve-
hicles Symposium (IV), pages 1149–1155. IEEE.
Baek, S. and Kim, D. Y. (2017). Empirical sensitivity
analysis of discretization parameters for fault pattern
extraction from multivariate time series data. IEEE
Transactions on Cybernetics, 47(5):1198–1209.
Benmimoun, M., Fahrenkrog, F., Zlocki, A., and Eckstein,
L. (2011). Incident detection based on vehicle can-
data within the large scale field operational test “euro-
fot”. In 22nd Enhanced Safety of Vehicles Conference
(ESV 2011), Washington, DC/USA.
Damm, W., M
¨
ohlmann, E., Peikenkamp, T., and Rakow,
A. (2018). A Formal Semantics for Traffic Sequence
Charts, pages 182–205. Springer International Pub-
lishing, Cham.
Elrofai, H., Paardekooper, J., Gelder, E. d., Kalisvaart, S.,
and Op den Camp, O. (2018). Streetwise: scenario-
based safety validation of connected automated driv-
ing. Technical report, TNO.
Fraenkel, D. J., Cowie, M., and Daley, P. (2003). Quality
benefits of an intensive care clinical information sys-
tem. Critical Care Medicine, 31(1):120–125.
Frehner, M. and Br
¨
andli, M. (2006). Virtual database: Spa-
tial analysis in a web-based data management system
for distributed ecological data. Environmental Mod-
elling & Software, 21(11):1544–1554.
Haja, A., Koch, C., and Klitzke, L. (2017). The ADAS
SWOT Analysis - A Strategy for Reducing Costs and
Increasing Quality in ADAS Testing. In Proceedings
of the 3rd International Conference on Vehicle Tech-
nology and Intelligent Transport Systems (VEHITS
2017), pages 320–325.
Kalra, N. and Paddock, S. M. (2016). Driving to safety:
How many miles of driving would it take to demon-
strate autonomous vehicle reliability? Transportation
Research Part A: Policy and Practice, 94:182–193.
Klauer, S. G., Dingus, T. A., Neale, V. L., Sudweeks, J. D.,
Ramsey, D. J., et al. (2006). The impact of driver inat-
tention on near-crash/crash risk: An analysis using the
100-car naturalistic driving study data. Technical re-
port, National Highway Traffic Safety Administration.
Liu, H., Hussain, F., Tan, C. L., and Dash, M. (2002). Dis-
cretization: An enabling technique. Data mining and
knowledge discovery, 6(4):393–423.
Menzel, T., Bagschik, G., and a. M. Maurer (2018). Scenar-
ios for development, test and validation of automated
vehicles. In 2018 IEEE Intelligent Vehicles Sympo-
sium (IV), pages 1821–1827.
Moskovitch, R. and Shahar, Y. (2015). Classification-driven
temporal discretization of multivariate time series.
Data Mining and Knowledge Discovery, 29(4):871–
913.
Olsen, E. C. B., Lee, S. E., Wierwille, W. W., and Goodman,
M. J. (2002). Analysis of distribution, frequency, and
duration of naturalistic lane changes. Proceedings of
Real-world Test Drive Vehicle Data Management System for Validation of Automated Driving Systems
179

the Human Factors and Ergonomics Society Annual
Meeting, 46(22):1789–1793.
P
¨
utz, A., Zlocki, A., Bock, J., and Eckstein, L. (2017).
System validation of highly automated vehicles with
a database of relevant traffic scenarios. In 12th ITS
European Congress. ITS European Congress.
Roesener, C., Fahrenkrog, F., Uhlig, A., and Eckstein, L.
(2016). A scenario-based assessment approach for
automated driving by using time series classification
of human-driving behaviour. In 2016 IEEE 19th In-
ternational Conference on Intelligent Transportation
Systems (ITSC), pages 1360–1365.
Schneider, J., Wilde, A., and Naab, K. (2008). Probabilistic
approach for modeling and identifying driving situa-
tions. In 2008 IEEE Intelligent Vehicles Symposium,
pages 343–348.
Schuldt, F. (2017). Ein Beitrag f
¨
ur den methodischen
Test von automatisierten Fahrfunktionen mit Hilfe von
virtuellen Umgebungen. PhD thesis, Technische Uni-
versit
¨
at Carolo-Wilhelmina zu Braunschweig.
Shavit, E. and Teichner, L. (1989). Interactive market man-
agement system. US Patent 4,799,156.
Stellet, J. E., Zofka, M. R., Schumacher, J., Schamm, T.,
Niewels, F., and Z
¨
ollner, J. M. (2015). Testing of
advanced driver assistance towards automated driv-
ing: A survey and taxonomy on existing approaches
and open questions. In 18th IEEE International Con-
ference on Intelligent Transportation Systems, pages
1455–1462.
Ulbrich, S., Menzel, T., Reschka, A., Schuldt, F., and Mau-
rer, M. (2015). Defining and substantiating the terms
scene, situation, and scenario for automated driving.
In 2015 IEEE 18th International Conference on Intel-
ligent Transportation Systems, pages 982–988.
Weidl, G., Madsen, A. L., Kasper, D., and Breuel, G.
(2014). Optimizing bayesian networks for recogni-
tion of driving maneuvers to meet the automotive re-
quirements. In 2014 IEEE International Symposium
on Intelligent Control (ISIC), pages 1626–1631.
Winner, H., Lemmer, K., Form, T., and Mazzega, J.
(2018). PEGASUS—First Steps for the Safe Intro-
duction of Automated Driving, chapter Vehicle Sys-
tems and Technologies Development, pages 185–195.
Springer International Publishing, Switzerland.
VEHITS 2019 - 5th International Conference on Vehicle Technology and Intelligent Transport Systems
180
