
A Fuzzy Approach for Data Quality Assessment of Linked Datasets
Narciso Arruda
1 a
, J. Alc
ˆ
antara
1 b
, V. M. P. Vidal
1
, Angelo Brayner
1 c
,
M. A. Casanova
2 d
, V. M. Pequeno
3 e
and Wellington Franco
1 f
1
Departamento de Computac¸
˜
ao, Federal University of Cear
´
a, Fortaleza, Cear
´
a, Brazil
2
Department of Informatics, Pontifical Catholic University of Rio de Janeiro, Brazil
3
TechLab, Departamento de Ci
ˆ
encias e Tecnologias, Universidade Aut
´
onoma de Lisboa Lu
´
ıs de Cam
˜
oes, Portugal
Keywords:
Quality Assessment, Linked Data Mashup, Fuzzy Inference System, Data Quality, Logic Fuzzy.
Abstract:
For several applications, an integrated view of linked data, denoted linked data mashup, is a critical require-
ment. Nonetheless, the quality of linked data mashups highly depends on the quality of the data sources. In
this sense, it is essential to analyze data source quality and to make this information explicit to consumers of
such data. This paper introduces a fuzzy ontology to represent the quality of linked data source. Furthermore,
the paper shows the applicability of the fuzzy ontology in the process of evaluating data source quality used
to build linked data mashups.
1 INTRODUCTION
A special kind of web application, called Linked
Data Mashup (LDM), is responsible for combining,
aggregating and transforming data available on the
Web of Data (Schultz et al., 2011). Hence, Linked
Data Mashup applications are confronted with the
challenge of building an integrated view of different
linked data sources. That view is denoted Linked Data
Mashup view (LDM view).
Nonetheless Linked Data sources may present
data in different quality levels. For this reason, before
triggering the process of creating a given LDM view,
it is essential to ensure that data belonging to each
data source are in the quality level required by the data
consumer (user or application). Accordingly, in order
to define which data sources should be integrated two
criteria are critical: (i) data source relevance, and; (ii)
data quality.
Data quality evaluation is quite often done by ap-
plying a hierarchy of category, dimension and metric.
The highest hierarchy level, category, is composed
a
https://orcid.org/0000-0003-3873-8468
b
https://orcid.org/0000-0002-4297-2970
c
https://orcid.org/0000-0001-9820-9133
d
https://orcid.org/0000-0003-0765-9636
e
https://orcid.org/0000-0002-6424-0252
f
https://orcid.org/0000-0001-9093-0428
of Accessibility, Contextual, Intrinsic and Representa-
tional (Zaveri et al., 2016). The second level presents
several dimensions, such as Integrity, Accuracy, and
Conciseness. In turn, each dimension contains qual-
ity metrics (the lowest hierarchy level). One key goal
of quality assessment is to find heuristics which ex-
press data consumer’s requirements for data quality,
based on the aforementioned hierarchy.
Linked data quality evaluation has been subject
of recent researches (Zaveri et al., 2016), (Debattista
et al., 2014b). Thus, several quality indicators have
been proposed along with techniques for assessing
data quality based on the proposed indicators. Al-
though those techniques offer ways to assess data
quality, their outputs are presented through quantita-
tive data (an absolute numerical value) and/or statis-
tical function, e.g., maximum, minimum, or average.
In some approaches, quality is expressed by means of
values belonging to the interval [0, 1] (or an alternative
isomorphic scale), which can reinforce difficulties for
interpreting quality measures.
In this paper, we propose the use of fuzzy logic to
model the domain of data quality as a way to over-
come imprecision and subjectivity. The idea is to
allow users to express data quality requirements by
means of a set of linguistic expressions on quality in-
dicators. In order to achieve our goal, a fuzzy ontol-
ogy to represent data quality is presented. The pro-
posed ontology reuses terms of W3C Data Quality
Arruda, N., Alcântara, J., Vidal, V., Brayner, A., Casanova, M., Pequeno, V. and Franco, W.
A Fuzzy Approach for Data Quality Assessment of Linked Datasets.
DOI: 10.5220/0007718803990406
In Proceedings of the 21st International Conference on Enterprise Information Systems (ICEIS 2019), pages 399-406
ISBN: 978-989-758-372-8
Copyright
c
2019 by SCITEPRESS – Science and Technology Publications, Lda. All rights reserved
399

Vocabulary (Debattista et al., 2016b) (DQV). More-
over, it provides the necessary concepts and terms to
specify data quality of linked data sources by means
of fuzzy terms. To assess the potentials of the pro-
posed approach, simulations on real data of 128 dif-
ferent LOD datasets have been conducted. The ob-
tained results are presented and discussed.
The remainder of this paper is structured as fol-
lows. Section 2 discusses related works. Section
3 discusses how to represent fuzzy quality concepts.
Section 4 presents fuzzy data quality vocabulary and
our proposal for data quality assessment. Section 5
shows experiments to validate our proposal. Finally,
Section 6 contains the conclusions.
2 RELATED WORK
Data quality is commonly conceived as a multi-
dimensional construction with dimensions such as
timeliness, completeness, consistency, interoperabil-
ity, conciseness, representational conciseness and
availability (Wang and Strong, 1996). The quality
dimensions are composed of quality metrics, which
measure the quality of the data along the dimen-
sions (Bizer and Cyganiak, 2009). More specifically,
quality metrics are heuristics designed to fit a specific
assessment situation (Wang, 2005). Usually, quality
dimensions are grouped into categories. According
to (Zaveri et al., 2016), the dimensions can be classi-
fied into four categories, namely: accessibility, con-
textual, intrinsic and representational. Table 1 shows
examples of three quality categories with some qual-
ity dimensions and their quality metrics.
Data quality assessment can be computed
automatically (Gu
´
eret et al., 2012) or semi-
automatically (Mendes et al., 2012; Debattista
et al., 2014b). Due to the many quality indicators,
it is difficult for the user to judge whether a dataset
is fit for use, which is a problem for the automatic
approach. In the semiautomatic approach, the user
interacts with the tool to define the adequacy of
the data to the intended use. The Luzzu quality
assessment framework (Debattista et al., 2014b), for
example, implements part of the cataloged quality
metrics shown in (Zaveri et al., 2016) and generates
quality metadata from assessed datasets, which is
used for ranking datasets based on the quality aspects
prioritized by the user. For ranking, the authors
in (Debattista et al., 2014b) proposed a user-driven
ranking algorithm where users can define weights on
their preferred categories, dimensions or metrics. In
Luzzu (Debattista et al., 2014b) and Sieve (Mendes
et al., 2012), the quality required by the user is
informed through a configuration interface, using
a numerical approach. Thereby, the user chooses
quality indicators that are more appropriate for
their purposes, define weights, and define how this
indicator must be aggregated. The problem of using
a numerical approach to evaluate the quality of a
dataset is how this information can be reused in a
context where the same set of data will be used in
different scenarios.
In the process of creating the Linked Data Mashup
view, some approaches have been proposed, for
example, LDIF (Schultz et al., 2011) and OD-
CleanStore (Knap et al., 2012). Typically, these ap-
proaches use the data quality as part of the data fusion
process. Sieve (Mendes et al., 2012) is a module in-
cluded in Linked Data Integration Framework (LDIF)
that is dedicated to quality assessment and fusion
of Linked Data. Sieve uses metadata about named
graphs to assess data quality as defined by users. In
ODCleanStore (Knap et al., 2012) quality metadata
(containing data provenance and quality scores) can
be used in the data fusion process. Its quality as-
sessment component checks whether the dataset (con-
verted in a named graph) satisfies custom consistency
policies and them calculate the quality score of the
dataset (Knap et al., 2012). Therefore, the fuzzy qual-
ity metadata can be easily adapted and used in that
tool. The use of fuzzy quality assessment allows a
reasonable justification for the evaluation result.
In recent years, ontologies have been specified to
conceptualize the quality of Linked Data (Debattista
et al., 2014a), (Debattista et al., 2016b). In (F
¨
urber
and Hepp, 2011) the authors propose the DQM (Data
Quality Management) ontology with a vocabulary to
represent data quality requirements or rules. How-
ever, this ontology does not represent the results of the
data quality assessment, only the data quality require-
ments. The daQ ontology (Debattista et al., 2014a)
represents information about the quality of linked
datasets and meets generic measures of data quality.
Also, its vocabulary can be extended as needed. The
Data Quality Vocabulary (DQV) (Debattista et al.,
2016b) was designed to act as a model covering many
aspects of data quality and was inspired by the daQ
ontology. The DQV vocabulary goes one step fur-
ther, emphasizing feedback, annotation, agreements
and quality policies, all describing the quality of a set
of data. However, this vocabulary enables data pub-
lishers to compute the quality of the data so that data
consumers can find out if the data is suitable for the
intended use and not represent the quality of the data
expected by the consumer.
ICEIS 2019 - 21st International Conference on Enterprise Information Systems
400

Table 1: Examples of metrics, dimensions and categories.
Category Dimension Metric
Intrinsic Consistency M1 (Usage of incorrect domain or range data type)
M2 (Misuse owl:DatatypeProperty or owl:ObjectProperty)
M3 (Entities as members of disjoint classes)
Conciseness M4 (Provides a measure of the redundancy of the dataset)
Accessibility Availability M5 (desereferentiability of the URI)
M6 (SPARQL endpoint availability)
M7 (RDF dump availability)
Representa- Interopera- M8 (existing terms reuse)
tiol bility M9 (existing vocabulary reuse)
Concision M10 (short URIs)
3 FUZZY LOGIC BACKGROUND
3.1 Fuzzy Set
Fuzzy sets have been introduced by Zadeh in (Zadeh,
1965) to represent and manipulate non-precise data.
A fuzzy set is characterized by a membership function
defined on the universe of discourse. This function
maps elements of the universe of discourse to a range
covering the interval [0,1] and indicates its member-
ship degree concerning the fuzzy set (i.e., the degree
to which the elements of the universe of discourse is
a member of the fuzzy set). A membership function
value of 0 means the corresponding element is not an
element of the fuzzy set, the value of 1 means that
the element entirely belongs to the set, and the values
between 0 and 1 represent fuzzy members, which be-
long to the fuzzy set only partially. A fuzzy set A is
formally defined as a set of ordered pairs, such as
A = {(x, µ
A
(x)) | x ∈ X },
where X is the universe of discourse, µ
A
is the mem-
bership function that represents a fuzzy set A; and
µ
A
(x) is the membership degree of the element x in
the fuzzy set A (µ
A
(x) indicates how much x is com-
patible with the set A).
Especially in data quality, in most of the cases, it
is impossible to give exact definitions or descriptions
for quality concepts and relationships between these
concepts. To resolve this problem, we use fuzzy sets
to represent the quality of the data. For example, in
our case study, we defined three fuzzy sets to repre-
sent the quality levels: low, medium and high. The
triangular functions are more practical and more used
(Ivezi
´
c et al., 2008). Therefore, we use as our mem-
bership functions. A triangular function f is defined
on the scalar parameters a, b and c, as shown below:
f (x, a, b, c) =
0, x ≤ a
x−a
b−a
, a < x ≤ b
c−x
c−b
, b ≤ x < c
0, c ≤ x
3.2 Linguistic Variable and Fuzzy Rule
One of the fundamental concepts of fuzzy set theory
is the concept of linguistic variable (Ross, 2009). Its
values are declarations in natural language (linguistic
values), which are names of fuzzy sets defined in a
universe of discourse. A linguistic variable V is for-
mally defined as a triple
V = (N, T (N), X ),
where N is the name of the linguistic variable, T (N) is
the set of linguistic values of N defined in the universe
of discourse X .
One way to represent human knowledge is to form
natural language expressions of the “IF THEN” type.
This way of representing knowledge is entirely ap-
propriate in the linguistic context because it expresses
human empirical and heuristic knowledge in our com-
munication language (Ross, 2009).
In general, a fuzzy rule is an inference rule ex-
pressed as
IF (x
1
is A
1
) ⊗ · ·· ⊗ (x
n−1
is A
n−1
) THEN (x
n
is A
n
),
where ⊗ is the logical conjunction operator (AND) or
the logical disjunction operator (OR), x
1
, x
2
, . . ., x
n
are
linguistic variables, and A
1
, A
2
, . . . , A
n
are linguistic
values assumed by these variables, respectively. The
“IF” part of the rule is called antecedent, and in the
“THEN” part is called consequent.
Rules are used to infer the quality of dimensions,
categories, and datasets. We define three types of
rules: dimension rules, category rules, and quality
A Fuzzy Approach for Data Quality Assessment of Linked Datasets
401

rules. In the dimension rules, the antecedents are ex-
pressions about the quality of the metrics, and the fol-
lowing ones are expressions about the quality of the
dimensions. In the category rules, the antecedents are
expressions about the quality of the dimensions and
the following ones are expressions about the quality
of the categories. In the quality rules, the antecedents
are expressions about the quality of the metrics, di-
mensions or category and the following ones are ex-
pressions about the quality of the dataset.
3.3 Running Example
Consider that, for the quality metric M1, M2 and M4,
and consistency and conciseness dimensions, one has
defined:
• linguistic variable M1 = (M1, T (M1), X ),
where X = [0, 1], T (M1) = {low, medium, high}
and the membership functions are µ
low
(x) =
f (x, 0, 0, 0.5), µ
medium
(x) = f (x, 0, 0.5, 0.1) and
µ
high
(x) = f (x, 0.5, 1, 1);
• linguistic variable M2 = (M2, T (M2), X), where
X = [0, 1], T (M2) = {low, medium,high}
and the membership functions are µ
low
(x) =
f (x, 0, 0.9, 0.95), µ
medium
(x) = f (x, 0.9, 0.95, 1)
and µ
high
(x) = f (x, 0.95, 1, 1).
• linguistic variable M4 = (M4, T (M4), X), where
X = [0, 1], T (M4) = {low, medium,high}
and the membership functions are µ
low
(x) =
f (x, 0, 0, 0.5), µ
medium
(x) = f (x, 0, 0.5, 1) and
µ
high
(x) = f (x, 0.5, 1, 1).
• linguistic variable consistency =
(consistency, T (consistency), X), where
X = [0, 1], T(consistency) = {low, medium, high}
and the membership functions are µ
low
(x) =
f (x, 0, 0, 0.5), µ
medium
(x) = f (x, 0, 0.5, 1) and
µ
high
(x) = f (x, 0.5, 1, 1).
• linguistic variable conciseness =
(conciseness, T (conciseness), X), where
X = [0, 1], T(conciseness) = {low, medium, high}
and the membership functions are µ
low
(x) =
f (x, 0, 0, 0.5), µ
medium
(x) = f (x, 0, 0.5, 1) and
µ
high
(x) = f (x, 0.5, 1, 1).
Note that the indicators are defined by different
linguistic values. However, to simplify the nota-
tion, we denote the values with the same name (low,
medium, high).
The fuzzy quality of dimensions is inferred by the
rules of dimension. Thus, we use the metrics M1 and
M2 to infer the quality of the consistency dimension,
and the metrics M4 to infer the quality of the concise-
ness dimension. Table 2 shows the metric rules that
Table 2: Fuzzy Rules used to infer the quality of the consis-
tency dimension.
Rules
R1 IF M1 is high AND M2 is high
THEN consistency is high
R2 IF M1 is medium AND M2 is medium
THEN consistency is medium
R3 IF M1 is low OR M2 is low
THEN consistency is low
Table 3: Fuzzy Rules used to infer the quality of the con-
ciseness dimension.
Rules
R1 IF M4 is high THEN conciseness is high
R2 IF M4 is medium
THEN conciseness is medium
R3 IF M4 is low THEN conciseness is low
infer the quality of the consistency dimension, and Ta-
ble 3 shows the metric rules that infer the quality of
the conciseness dimension.
3.4 A Fuzzy Inference System
A Fuzzy Inference System (FIS) captures and offers a
way of the subjective human knowledge of real pro-
cesses manipulating practical knowledge with some
level of uncertainty. A fuzzy inference system may
be organized into the four components:
• Knowledge Base: Composed of a rule database,
containing a number of fuzzy rules, and a function
database which defines the membership functions
of the fuzzy sets used in the fuzzy rules.
• Fuzzification: Converts the crisp input in a lin-
guistic variable using the membership functions
stored in the database. The input is always a crisp
numerical value limited to the universe of dis-
course of the input variable.
• Inference: Determines the degree of validity of
the consequent of the rules and combines as out-
put the results in a linguistic variable. Meth-
ods of fuzzy inferences perform this process. A
well-known inference is described in Mamdani,
Sugeno and Tsukamoto (see (Ross, 2009) for
more details).
• Defuzzification: Derives a single crisp value that
best represents the inferred fuzzy values of the
output linguistic variable. There are several meth-
ods of defuzzification in the literature, the best
known methods are: Maximum value, Mean value
ICEIS 2019 - 21st International Conference on Enterprise Information Systems
402

of maximums, Bisector, Centroid or Center of
Gravity (see (Ross, 2009) for more details).
4 A FUZZY APPROACH TO DATA
QUALITY ASSESSMENT
4.1 Fuzzy Data Quality Vocabulary
The DQV vocabulary distinguishes between three
layers of abstraction (metric, dimensions and cate-
gory), based on a survey presented in (Zaveri et al.,
2016). Quality metrics (dqv:Metric) are grouped
into quality dimension (dqv:Dimension), by property
dqv:inDimension). Quality dimensions are grouped
into quality category (dqv:Category), by property
dqv:inCategory. dqv:QualityMeasurement repre-
sents a quality metric measure of a given resource
(rdfs:Resource), a resource can be a set of data, a
set of links, a graph or a set of triples in which quality
measurement is performed.
The proposed Fuzzy Quality Data Vocabulary
(FQV) extends DQV to represent fuzzy concepts. For
that, terms from Fuzz-Onto ontology (Yaguinuma
et al., 2012) (a meta-ontology for representing fuzzy
ontologies) are incorporated by the proposed ap-
proach. FQV presents the following elements:
• fuz:FuzzyConcept (concept): represents linguis-
tic values which are associated to linguistic vari-
ables. Fuzzy atomic concepts are defined in a
discrete domain. If an atomic concept in a do-
main ontology is a fuzzy concept, it should be
subsumed by fuz:FuzzyConcept to denote that its
individuals belong to the concept with a certain
membership degree in [0, 1]; fuz:FuzzyConcept
is defined by a parameterized membership func-
tion, by the fuz:hasMembershipFunction relation-
ship;
• fuz:hasMembershipDegree (attribute): defines the
membership degree, which is represented by a
real number in the interval [0, 1];
• fuz:hasFuzzyConcept (relationship): associates
an instance of fqv:QualityIndicator to a fuzzy
concept;
• fqv:QualityIndicator (concept): represents lin-
guistic variables, which can be characterized
by linguistic values represented by fuzzy sets.
These linguistics variables are metrics, di-
mensions, or categories, which involve fuzzi-
ness in their definition. Each instance of
fqv:QualityIndicator should be associated with
one or more linguistic terms (fuz:FuzzyConcept)
by the fuz:hasFuzzyConcept relationship;
• fuz:hasMembershipFunction (relationship): asso-
ciates a linguistic term to its corresponding mem-
bership function;
4.2 Fuzzy Linked Data Quality
Assessment Process
The Fuzzy Quality Assessment Process receives as
input quality metadata and computes the quality of
datasets based on fuzzy rules and linguistic variables,
using the metadata generated by Luzzu (Debattista
et al., 2016a). This process is composed of two phases
(see Figure 1), described in what follows.
Phase 1: Fuzzy Quality Metadata Computation.
Fuzzy quality metadata are quality metadata, in which
fuzzy concepts are inferred from quality metrics,
based on linguistic variables and fuzzy rules defined
by a specialist.
Step 1: Metric Fuzzification. Linguistic variables
are defined by data consumers for the relevant quality
metrics. For each linguistic variable, precise values
are specified. such values represent quality levels of
the metrics. For each measure of the relevant quality
metric in the quality metadata, the values are mapped
into fuzzy sets and determined the degree of member-
ship of each set through its member functions. The
fuzzy values of the metrics are generated as a DQV
vocabulary.
Step 2: Dimension Fuzzification. Linguistic vari-
ables are defined for quality dimensions associated
with relevant quality metrics (identified by a special-
ist). For each linguistic variable, the linguistic values
are defined, which are the levels of quality of the di-
mensions. Dimension Rules are created based on the
linguistic variables of the metrics and infer the fuzzy
values of the dimensions. For each dimension of the
relevant quality metric in the quality metadata, dimen-
sion rules infer the fuzzy values. The fuzzy values of
the dimensions are generated as the DQV vocabulary.
Step 3: Category Fuzzification. Linguistic variables
are now defined for quality categories associated with
relevant quality dimensions. For each linguistic vari-
able, the linguistic values are defined, which are the
levels of quality of the categories. Category Rules
are created based on the linguistic variables of the di-
mensions. For each categories of the relevant quality
dimension, category rules infer the fuzzy values. The
fuzzy values of the categories are generated as a DQV
vocabulary.
Phase 2: Dataset Quality Evaluation. Data quality
fuzzy computation is implemented by a fuzzy infer-
ence system (FIS), capable of inferring data quality
based on fuzzy rules, defined to express quality re-
quirements of data consumer. Thus, a linguistic vari-
A Fuzzy Approach for Data Quality Assessment of Linked Datasets
403
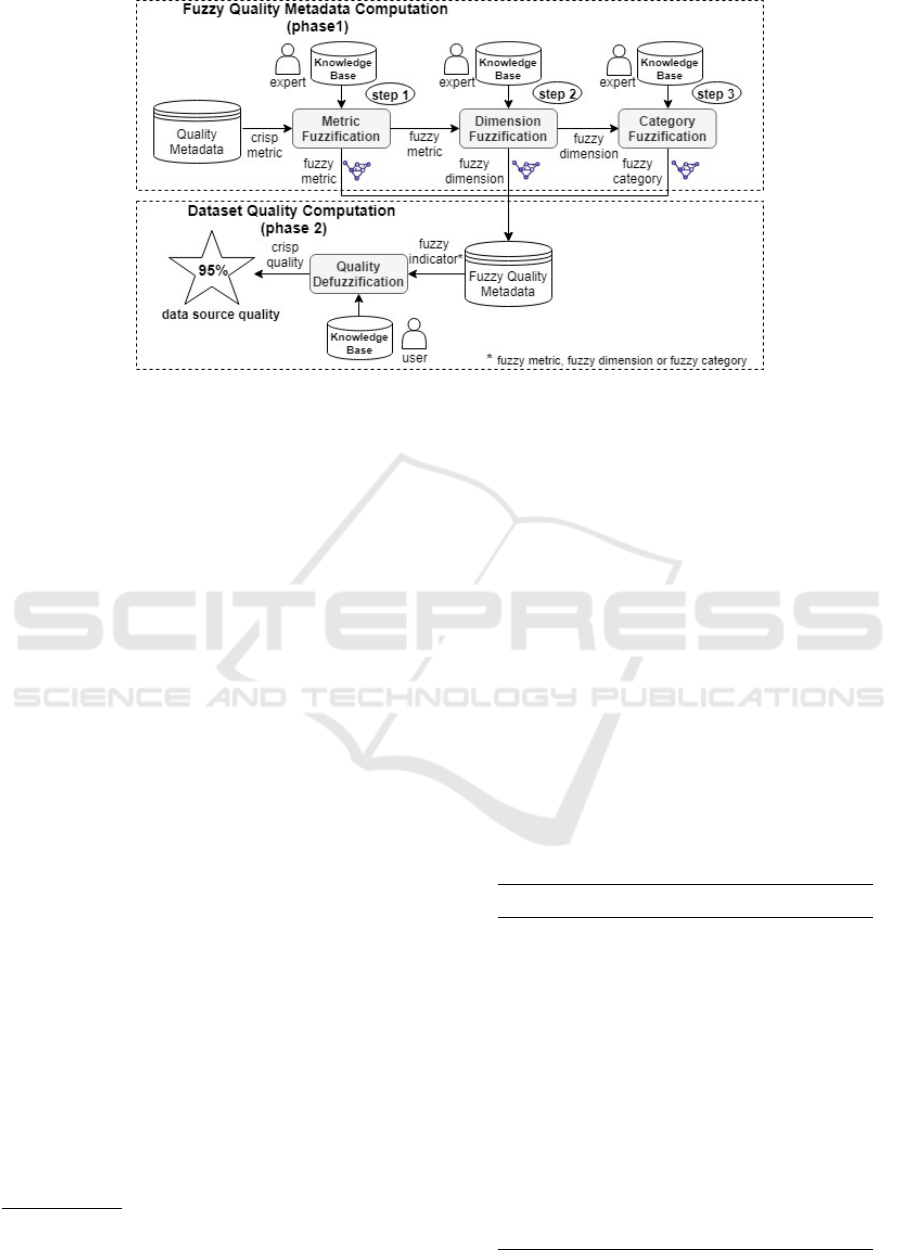
Figure 1: Fuzzy Quality Assessment Process.
able is specified for the quality of the dataset. The
linguistic values are defined according to the desired
level of quality. Quality Rules are created based on
the linguistic variables of the metrics, dimensions and
categories and should be able to infer fuzzy values for
quality.
5 EMPIRICAL EVALUATION
We have created knowledge bases with generated
fuzzy quality metadata for 128 LOD datasets
1
. The
quality evaluation published in (Debattista et al., ) has
been chosen as the baseline. In order to achieve our
goal, quality metadata of 33 quality metrics of those
dataset have been collected.
For the sake of clarity, but without loss of general-
ity, we have used dataset quality metrics belonging to
dimensions consistency and conciseness. The evalu-
ated metrics were: (i) M1, which evaluates the use of
incorrect domain or range data type; (ii) M2, which
estimates the misuse OWL data type or object prop-
erties, and; (iii) M4, which provides a measure of the
redundancy of the dataset (see Table 1). For each met-
ric and dimension, we have considered three levels of
fuzzy quality, namely, low, medium and high. Thus,
we define three linguistic values for each linguistic
variable.
The membership functions of the linguistic val-
ues for metrics M1, M2, M4, and consistency, con-
ciseness dimensions are the same defined in Section
3.3. To infer the fuzzy quality of consistency di-
mension the rules presented in Table 2 have been
1
The knowledge bases can be accessed at
http://tiny.cc/knowledgebases
deployed, and to infer the fuzzy quality of concise-
ness dimension the rules in Table 3 have been used.
The linguistic variable used in the experiments is
defined as quality = (quality, T (quality),X), where
X = [0, 1], T (quality) = {low, medium, high}. Con-
sider now that the following membership functions
have been defined: µ
low
(x) = f (x, 0, 0, 0.5), µ
medium
(x)
= f (x, 0, 0.5, 1) and µ
high
(x) = f (x, 0.5, 1, 1).
The experiments have been split into two parts. In
the first part, the experiments compared the proposed
quality evaluation approach with the baseline (tradi-
tional approach (Mendes et al., 2012)). In the second
part, the experiments measured dataset quality by
applying the proposed approach.
Part I - Dataset Quality Evaluation based on
Metrics
Table 4: Fuzzy Rules used in Experiments of Part I.
Rules
R1 IF M1 is high AND M2 is high
THEN Quality is high
R2 IF M1 is medium AND M2 is high
THEN Quality is high
R3 IF M1 is high AND M2 is medium
THEN Quality is high
R4 IF M1 is medium AND M2 is medium
THEN Quality is medium
R5 IF M1 is medium AND M2 is low
THEN Quality is low
R6 IF M1 is low AND M2 is medium
THEN Quality is low
R7 IF M1 is low AND M2 is low
THEN Quality is low
ICEIS 2019 - 21st International Conference on Enterprise Information Systems
404
hp://dbtune.org/bbc/peel/
0
0,1
0,2
0,3
0,4
0,5
0,6
0,7
0,8
0,9
1
0 20 40 60 80 100 120
incorrectDomainRange misuseDatatypeObject avg fuzzy
1
2
3
4
5
6
7
8
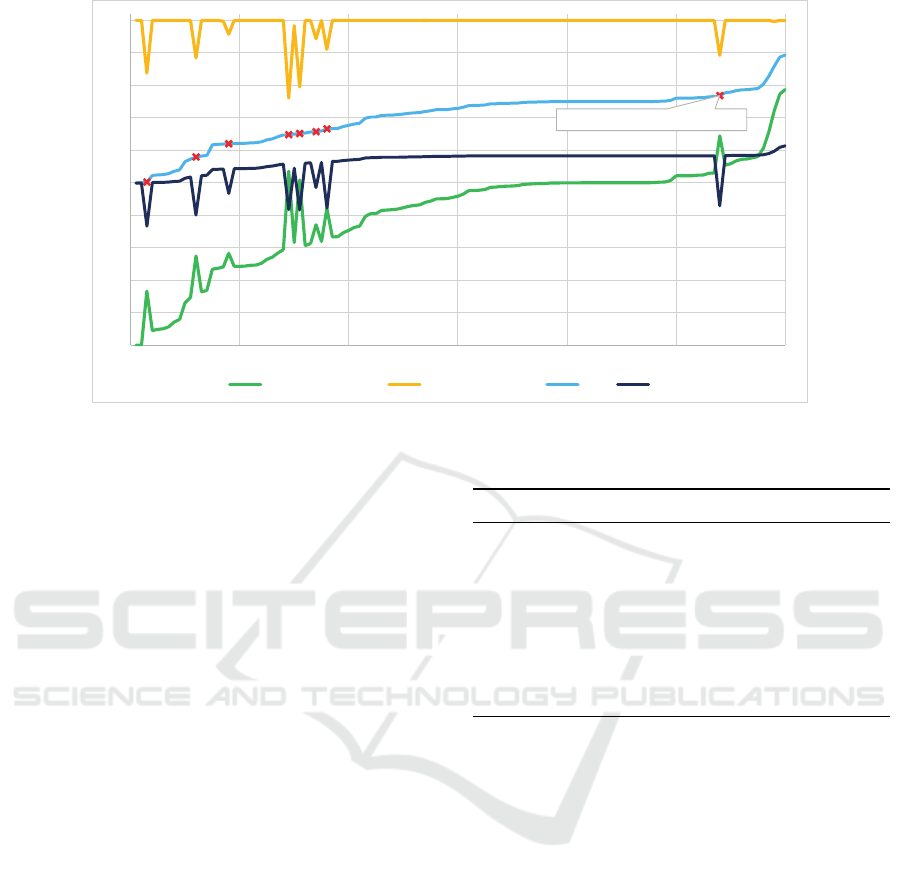
Figure 2: Results of the quality assessment of datasets based on metrics M1 and M2.
These experiments compared the proposed ap-
proach against the baseline (average aggregation
method). The quality values may be inferred by the
rules for metrics M1 and M2 (see Table 4), which are
metrics of the consistency dimension.
Figure 2 depicts fuzzy quality values and average
aggregation method (avg) values (baseline). As al-
ready mentioned, fuzzy quality values are computed
by a fuzzy inference system. The used rules are
shown in Table 4. The membership functions are the
same specified in Section 3.3. Finally, the Mamdani
inference method and the Center of Gravity defuzzi-
fication method have been used.
Points marked with x (1 to 8) on the avg curve
(Figure 2) highlight the difference between the
baseline and fuzzy assessment methods. Observe
that there exist peaks in values of metric M2 (value
decreasing) and metric M1 (value increasing). In the
baseline (average method), the computed average
values smooth those peaks, giving the idea of a false
positive concerning quality level. Furthermore, the
proposed approach delivers more precise informa-
tion, because a decrease in the value of the metric M2
induces a low quality level. The quality of the metric
M2 is high when the value is greater than 0.95 and,
for values smaller than 0.95, the quality of the metric
M2 is low. Therefore, the fuzzy inference system
has very different behavior, concerning the change of
value.
Part II - Dataset Quality Evaluation based on Di-
mensions
Table 6 shows the results of quality assessment of
some LOD datasets, based on the quality rules of Ta-
Table 5: Fuzzy Rules used in Experiments Part II.
Rules
R1 IF Consistency is high AND
Conciseness is high THEN Quality is high
R2 IF Consistency is high AND
Conciseness is medium
THEN Quality is high
R3 IF Consistency is medium
THEN Quality is medium
R4 IF Consistency is low THEN Quality is low
ble 5. The consistency and conciseness columns show
the degree of membership to the quality levels of the
datasets. The quality column shows the quality as-
sessment value.
The linguistic values of the fuzzy quality vari-
able divide the universe of discourse in a balanced
way. We consider 50% as the balance point of qual-
ity, where values less than 50% represent quality is
insufficient and more than 50% quality is sufficient.
In the Peel and DBLP (L3S) datasets, the qual-
ity is less than 50%. Note that, the conciseness of
the datasets is high (> 85%) and the conciseness is
medium. However, the consistency is not high and
the quality is high only when consistency is high and
the conciseness is high or medium (rules R1 and R2
of Table 5), and on the other hand, the quality is low
when consistency is low (rule R4 of Table 5). Thus,
these datasets do not reach enough quality.
The ELIONET dataset does not have high con-
ciseness, but it has average concision with member-
ship of 75%, and high membership consistency of
65%, the quality is over 50%. According to rule R2 of
A Fuzzy Approach for Data Quality Assessment of Linked Datasets
405
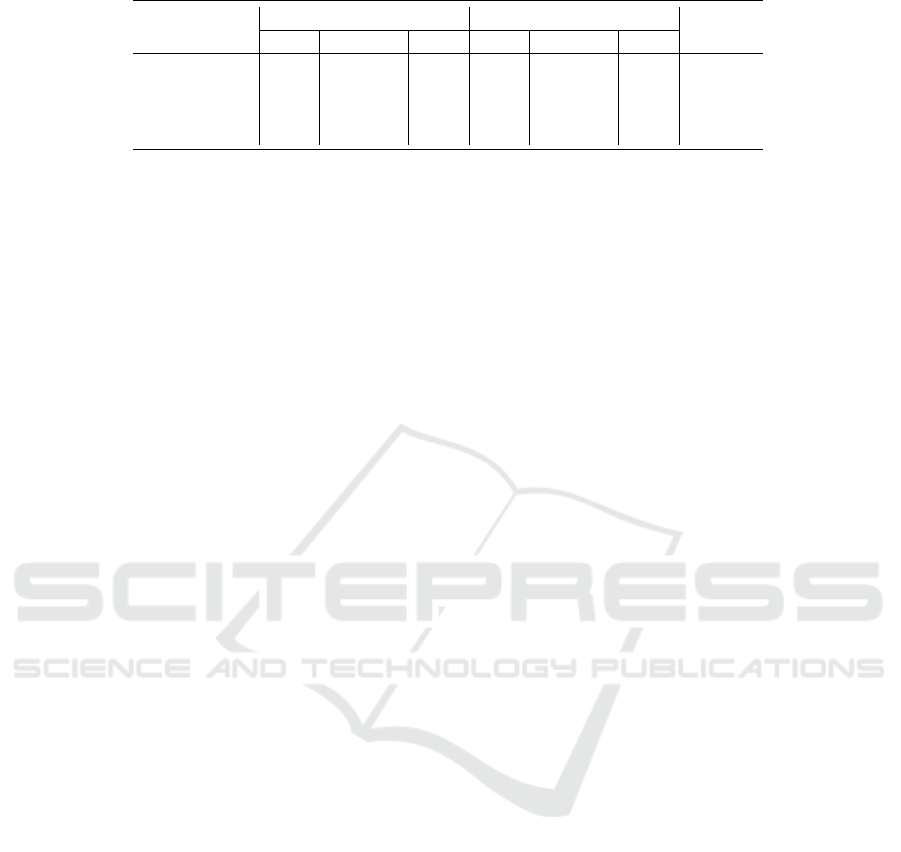
Table 6: Result of Quality Assessment based on Consistency and Conciseness Dimension.
Dataset
Consistency Conciseness
Quality
low medium high low medium high
Peel 58% 41% 0% 0% 11% 88% 41%
DBLP (L3S) 3% 96% 0% 0% 2% 97% 49%
DBpedia 0% 37% 62% 0% 3% 96% 59%
EIONET 0% 34% 65% 24% 75% 0% 60%
Table 5, the quality is high when greater than 50% and
the dataset has high quality since it meets this rule.
6 CONCLUSION
In this work, we proposed the use of fuzzy logic to
model the domain of data quality. We described a
fuzzy ontology to represent data quality. Additionally,
we described and analyzed an approach for evaluating
Linked Data quality based on fuzzy logic. In the pro-
posed approach, quality measurement is inferred by
fuzzy inference systems based on user-defined fuzzy
rules. Results of experiments on real datasets were
reported and discussed.
We emphasize that the proposed approach present
real benefits in the process of providing linked data
mashups with required level of quality. As future
work, we shall investigate the use of fuzzy logic in
computing mashup data quality.
ACKNOWLEDGEMENTS
This work was partly funded by CNPq under grants
303332/2013-1 and 442338/2014-7, by FAPERJ un-
der grant E-26/201.337/2014, and by FCT - Fundac¸
˜
ao
para a Ci
ˆ
encia e a Tecnologia, under the grant SFRH/-
BPD/76024/2011.
REFERENCES
Bizer, C. and Cyganiak, R. (2009). Quality-driven informa-
tion filtering using the WIQA policy framework. Web
Semant., 7(1):1–10.
Debattista, J., Auer, S., and Lange, C. (2016a). Luzzu—a
methodology and framework for linked data quality
assessment. Journal of Data and Information Quality
(JDIQ), 8(1):4.
Debattista, J., Dekkers, M., Gu
´
eret, C., Lee, D., Mihinduku-
lasooriya, N., and Zaveri, A. (2016b). Data on the web
best practices: Data quality vocabulary.
Debattista, J., Lange, C., and Auer, S. (2014a). daq, an on-
tology for dataset quality information. In Proc. Work-
shop on Linked Data on the Web co-located with the
23rd Int. World Wide Web Conference (WWW 2014).
Debattista, J., Lange, C., Auer, S., and Cortis, D. Evaluat-
ing the quality of the lod cloud: An empirical investi-
gation.
Debattista, J., Londo
˜
no, S., Lange, C., and Auer, S. (2014b).
LUZZU - A framework for linked data quality assess-
ment. CoRR, abs/1412.3750.
F
¨
urber, C. and Hepp, M. (2011). Towards a vocabulary
for data quality management in semantic web archi-
tectures. In Proc. 1st Int. Workshop on Linked Web
Data Management, LWDM ’11, NY, USA. ACM.
Gu
´
eret, C., Groth, P., Stadler, C., and Lehmann, J.
(2012). Assessing linked data mappings using net-
work measures. In Proc. 9th International Confer-
ence on The Semantic Web: Research and Applica-
tions, ESWC’12, pages 87–102. Berlin, Heidelberg.
Ivezi
´
c, D., Tanasijevi
´
c, M., and Ignjatovi
´
c, D. (2008).
Fuzzy approach to dependability performance evalu-
ation. Quality and Reliability Engineering Interna-
tional, 24(7):779–792.
Knap, T., Michelfeit, J., Daniel, J., Jerman, P., Rych-
novsk
`
y, D., Soukup, T., and Ne
ˇ
cask
`
y, M. (2012). Od-
cleanstore: a framework for managing and providing
integrated linked data on the web. In Int. Conf. Web
Information Systems Engineering, pages 815–816.
Mendes, P. N., M
¨
uhleisen, H., and Bizer, C. (2012). Sieve:
Linked data quality assessment and fusion. In Proc.
2012 Joint EDBT/ICDT Workshops, EDBT-ICDT ’12,
pages 116–123, NY, USA. ACM.
Ross, T. (2009). Fuzzy logic with engineering applications.
John Wiley & Sons, Inc.
Schultz, A., Matteini, A., Isele, R., Bizer, C., and Becker, C.
(2011). LDIF - linked data integration framework. In
Proc. Second Int. Conf. on Consuming Linked Data,
COLD’11, Aachen, Germany. CEUR-WS.org.
Wang, R. Y. (2005). Information Quality (Advances in Man-
agement Information Systems). M. E. Sharpe, Inc.,
Armonk, NY, USA.
Wang, R. Y. and Strong, D. M. (1996). Beyond accuracy:
What data quality means to data consumers. J. Man-
age. Inf. Syst., 12(4):5–33.
Yaguinuma, C., Santos, M. T. P., Camargo, H. A., Nico-
letti, M. C., and Nogueira, T. M. (2012). Fuzz-onto:
A meta-ontology for representing fuzzy elements and
supporting fuzzy classification rules. In Proc. 12th Int.
Conf. on Intelligent Systems Design and Applications.
Zadeh, L. (1965). Fuzzy sets. Information and Control,
8(3):338 – 353.
Zaveri, A., Rula, A., Maurino, A., Pietrobon, R., Lehmann,
J., and Auer, S. (2016). Quality assessment for linked
data: A survey. Semantic Web, 7(1):63–93.
ICEIS 2019 - 21st International Conference on Enterprise Information Systems
406
