
Safety-relevant V2X Beaconing in Realistic and Scalable Heterogeneous
Radio Propagation Fading Channels
Daniel Bischoff
1,2
, Harald Berninger
1
, Steffen Knapp
1
, Tobias Meuser
2
, Bj
¨
orn Richerzhagen
2
,
Lars H
¨
aring
3
and Andreas Czylwik
3
1
Active Safety Advanced Technology, Opel Automobile GmbH, R
¨
usselsheim, Germany
2
Multimedia Communication, Technische Universit
¨
at Darmstadt, Darmstadt, Germany
3
Telecommunication Systems, Universit
¨
at Duisburg-Essen, Duisburg, Germany
{tobias.meuser, bjoern.richerzhagen}@kom.tu-darmstadt.de, {haering, czylwik}@nts.uni-duisburg-essen.de
Keywords:
Heterogeneous Communication, V2X, 802.11p, LTE, Geocast, Channel Gain, Channel Load.
Abstract:
Performance evaluations for heterogeneous communication technologies in the area of V2X safety applica-
tions for either improvement, comparison or combination purposes are in general focusing on the realistic
representation of the upper communication stack layers, but therefore - often for the sake of simplicity - re-
ducing the radio propagation channel to a maximum range model. The impact and hence the importance to
model the environment dependent propagation effects in a representative manner has already been stressed in
the literature several times - but separately for ad-hoc or cellular systems and not under the consideration of
V2X safety-beaconing applications. By combining a realistic heterogeneous radio propagation channel model
with a state-of-the-art V2X communication stack, a representative performance comparison of safety-relevant
beaconing applications for 802.11p single-hop broadcast (SHB) and LTE Geocast can be conducted. Our
simulation results show that the effects caused by the radio propagation channel cannot be neglected as they
significantly impact key communication performance metrics such as channel gain, packet error ratio (PER)
and channel load, where we primarily focus on the latter one to give further research directions for an efficient
dissemination of safety-relevant V2X beacons.
1 INTRODUCTION
Safety-relevant V2X applications aim at improving
safety and efficiency on the road by exchanging in-
formation such as vehicle dynamic or traffic data be-
tween vehicles and the infrastructure. To enable ve-
hicular communications, IEEE 802.11p and 3GPP
LTE are the most promising communication technolo-
gies, which are recently in the focus of performance
evaluations (Araniti et al., 2013), where the former
is following an ad-hoc and the latter a cellular ap-
proach. To identify the performance of vehicular
communications and especially to compare the afore-
mentioned communication technologies, several met-
rics have been derived to address the individual needs
of V2X safety applications. Such metrics mainly fo-
cus on reliability, channel load, coverage and latency
(Xiao et al., 2019).
Radio propagation channels in vehicular commu-
nication systems are subject to severe fading caused
by the high mobility and rich scattering environ-
ment (Bernado et al., 2014). Shadowing by other
vehicles and the infrastructure (large-scale fading)
and multipath propagation causing delay and Doppler
spread (small-scale fading) impact the packet recep-
tion power and therefore the packet error ratio (PER)
at the receiver (Viriyasitavat et al., 2015) significantly.
Even though there are plenty of channel models
mentioned in the literature, almost all performance
evaluation studies currently use very simplified radio
propagation channel models for ad-hoc communica-
tion or assume an error-free communication for cel-
lular communication. These simplified channel mod-
els reduce the complexity of radio propagation effects
to a maximum transmission range model, similar to
(Guenther et al., 2016), to reduce the computational
complexity of the simulation. Although, especially in
motorway environments, it was shown that fading ef-
fects impact the reliability of the communication and
therefore have to be considered in the radio propaga-
tion channel model (Bernado et al., 2014).
In this paper, we propose a realistic and scal-
404
Bischoff, D., Berninger, H., Knapp, S., Meuser, T., Richerzhagen, B., Häring, L. and Czylwik, A.
Safety-relevant V2X Beaconing in Realistic and Scalable Heterogeneous Radio Propagation Fading Channels.
DOI: 10.5220/0007712904040411
In Proceedings of the 5th International Conference on Vehicle Technology and Intelligent Transport Systems (VEHITS 2019), pages 404-411
ISBN: 978-989-758-374-2
Copyright
c
2019 by SCITEPRESS – Science and Technology Publications, Lda. All rights reserved

able heterogeneous channel model, which foremost
follows a simplified geometry-based deterministic
(GBD) approach to consider path loss, large- and
small-scale fading effects for both radio technologies
using a heterogeneous channel model. This approach
differentiates us from existing V2X performance eval-
uation studies, where different and simplified or non-
scalable channel models are used for each radio com-
munication technology. By that, we improve the com-
parison between both technologies, where we also
consider the individual propagation characteristics,
such as multipath propagation for each technology.
As a result of the high mobility of vehicles, V2X
safety applications require a frequent and continu-
ous exchange of information (beaconing) to improve
the localization of other vehicles. We show that the
choice of the channel model can severely impact the
simulation results of the channel load for 802.11p.
To support long-range dissemination in V2X com-
munication systems, cellular systems such as LTE
are in the focus to support V2X safety-applications
(Araniti et al., 2013). Cellular systems are usually not
suited to support beaconing applications, especially if
a unicast transmission is considered in the downlink
(Vinel, 2012). In contrast to that, multicast transmis-
sion can significantly reduce the channel load in the
downlink but requires a multicast session setup prior
to the message dissemination, which can take up to
seconds (Araniti et al., 2013). We analyze the ability
of LTE Geocast using unicast transmission mode to
support V2X beaconing applications and compare the
channel utilization for both communication technolo-
gies using our heterogeneous channel model.
Therefore, our main contributions of this paper
are:
• Realistic and scalable heterogeneous V2X radio
propagation channel model
• Comparison of LTE and 802.11p channel gain and
PER with high vehicle density using a realistic
heterogeneous channel model
• Impact of channel models on the channel load
for 802.11p SHB V2X beaconing applications and
comparison with LTE Geocast dissemination
The rest of this paper is organized as follows: In Sec-
tion 2 we summarize the related work of V2X channel
models and performance evaluations. In Section 3 we
introduce our proposed heterogeneous channel model
and the message dissemination mechanisms for both
communication technologies. The simulation setup
is briefly summarized in Section 4. We evaluate our
channel model in Section 5 and compare the channel
load with both communication technologies. The pa-
per will be concluded in Section 6.
2 RELATED WORK
In this section, we briefly introduce the related work
for V2X channel models and V2X performance eval-
uations.
2.1 V2X Channel Model
Radio propagation effects can be grouped into two
main categories, that is, path loss propagation, large-
scale and small-scale fading. To model these effects,
we can use GBD, geometry-based stochastic (GBS)
or non-geometry based stochastic (NGS) approaches.
The following channel models obtain stochastic
parameters from measurement campaigns in different
environments and therefore fit in the area of NGS ap-
proaches: For V2V communications, free-space prop-
agation has been addressed in (Nilsson et al., 2017),
large-scale fading in (Boban et al., 2011) and small-
scale fading in (Acosta-Marum and Ingram, 2007)
and (Bernado et al., 2014) separately for different
environments such as urban and suburban areas as
well as motorways. A comprehensive survey on V2X
channel models has been conducted in (Viriyasitavat
et al., 2015). In (Maaz et al., 2015), a V2I path loss
measurement has been conducted for an urban envi-
ronment.
In GBS approaches, the representation of fading is
still achieved stochastically, but takes the environment
into account. In (Czink and Oestges, 2008), based on
the geometry of the environment, the authors define
three types of different clusters, group reflectors and
scatterers as clusters and parametrize them in accor-
dance to the number of reflectors and scatterers within
the respective cluster. Finally, small-scale fading is
stochastically modeled for each cluster. The Winner
channel model (Ky
¨
osti et al., 2008) also describes
small-scale fading with the help of clusters. These
stochastic models also rely on empiric data obtained
from measurement campaigns and are not available
for every frequency spectrum and scenario.
GBD models usually do not rely on measurement
campaign datasets to model propagation effects of
the communication channel. In (J. Maurer and T.
Fugen and T. Schafer and W. Wiesbeck, 2004) the
authors propose a ray-tracing approach to determine
large- and small-scale fading effects. The authors
showed that the accuracy is very high when com-
paring it to measurement campaigns within the same
scenario. Neglecting multipath propagation, the au-
thors in (Boban et al., 2011) modeled the large-scale
fading in a simplified deterministic manner. Here,
only the direct link between the transmitter and re-
ceiver is considered. Even though there are plenty of
Safety-relevant V2X Beaconing in Realistic and Scalable Heterogeneous Radio Propagation Fading Channels
405

channel models available, the related work currently
misses a realistic and scalable channel model, which
describes the radio propagation effects for different
communication technologies in a similar way. By do-
ing this, the comparisons of different communication
technologies is increased, and we can evaluate large-
scale scenarios.
2.2 V2X Performance Evaluation
To analyze the ability to support vehicular com-
munications for different radio technologies, several
performance comparisons have been conducted. In
(Hameed Mir and Filali, 2014), the authors compared
the throughput, End-to-End Latency, and Packet De-
livery Ratio (PDR) for LTE and 802.11p, using a Log-
Distance and Nakagami fading model. In (Moller
et al., 2014), the authors considered a very detailed
ray-tracing channel model to describe the radio prop-
agation effects in a deterministic manner. Neverthe-
less, the evaluation was limited to the PDR and Block
Error Ratio (BLER). The performance of the Decen-
tralized Congestion Control (DCC) for 802.11p and
its impact on the channel load was extensively studied
in (Guenther et al., 2016), where a maximum range
channel model was used. In (Cecchini et al., 2017),
the resource allocation for LTE-D2D was studied us-
ing a path loss channel mode. A comprehensive sur-
vey on the comparison of V2X communication tech-
nology can be found in (Masini et al., 2018).
To the best of our knowledge, simulations to ob-
tain the performance for V2X safety beaconing appli-
cations under realistic radio propagation channel con-
ditions for the aforementioned performance metrics in
a heterogeneous communication environment (cellu-
lar and ad-hoc) has not been conducted yet.
3 SYSTEM DESIGN
In this section, we derive our realistic and scalable
heterogeneous channel model. Furthermore, we ex-
plain the message dissemination strategy for LTE and
802.11p, that is, Geocast and SHB, respectively.
3.1 Design of the Heterogeneous
Channel Model
Figure 1 depicts the complete structure of the chan-
nel model, where we determine the communication
link, path loss, large-scale fading and small-scale fad-
ing separately. In summary, our channel model aims
at obtaining a realistic and scalable representation of
radio propagation effects for 802.11p and LTE in ve-
hicular communication systems.
The output is the time-invariant channel impulse
response h(t,τ). In the simulator h(t, τ) is calculated
at the receiver for each vehicle separately and the ab-
solute square of h(t,τ) is mapped with the transmis-
sion signal power. The level of the resulting reception
power is used to determine if the message can be de-
coded correctly.
Figure 1: Structure of the V2X channel model.
3.1.1 Communication Link
With the help of the geometry of objects in the sim-
ulation environment, antenna heights of both trans-
mitter and receiver and the first Fresnel Ellipsoid, the
condition of the communication link can be obtained,
that is, Line-Of-Sight (LOS) or Non-Line-Of-Sight
(NLOS). In (Boban et al., 2011) LOS is expected,
if 60 % of the first Fresnel Ellipsoid is free of ob-
stacles. We assume the same for our model. We
make use of the implementation in (Sommer et al.,
2015), where the authors implemented the shadowing
model described in (Boban et al., 2011). We extend
this approach to obtain the LTE link condition as well.
We use the link condition information to increase the
accuracy of path loss and large-scale fading, as re-
quested in (Nilsson et al., 2017) and (Boban et al.,
2011), respectively.
3.1.2 Path Loss
The free-space path loss is often modeled with the
Friis equation, which only holds under idealistic en-
vironment conditions. The benefit of this model is its
generality, that is, the variable use of different carrier
frequencies, thus making it easy to use different com-
munication technologies working in different spectra.
The Friis formula is given in Equation 1, where λ and
d denote the carrier wavelength and the distance be-
tween the transmitter and receiver, respectively. P
T
,
P
R
, G
T
and G
R
denote the transmission and reception
power as well as the transmitter and receiver antenna
gain, respectively.
P
R
P
T
=
λ
2πd
2
· G
R
· G
T
(1)
VEHITS 2019 - 5th International Conference on Vehicle Technology and Intelligent Transport Systems
406

Under the condition of LOS, the two-ray ground
reflection model (2-RGR) is used. The superposition
of the direct and reflected wave at the receiver cannot
be ignored, as detailed in (Nilsson et al., 2017). The
relationship between received and transmitted power
is given in Equation 2, where h
T
and h
R
denote the
antenna height at the transmitter and receiver, respec-
tively.
P
R
P
T
=
λ
2πd
2
·
2sin
2π
λ
·
h
T
h
R
d
2
· G
R
· G
T
(2)
3.1.3 Large-Scale Fading
Depending on the propagation path of the radio wave,
there is a probability that objects, such as buildings
or other vehicles, shadow the path of the propaga-
tion wave. The resulting attenuation can be described
with the single (in case of one object) or multiple-
knife edge model (in case of more than one object) as
detailed in (Boban et al., 2011).
Besides the calculation of large-scale fading at-
tenuation for 802.11p, we extend the implementation
in (Sommer et al., 2015) to obtain the attenuation
caused by large-scale fading effects for the LTE chan-
nel model in (Virdis et al., 2015). Our implementation
considers the carrier frequency and antenna heights of
the respective communication technology.
3.1.4 Small-Scale Fading
Fast amplitude fluctuation of the received signal is
caused by constructive and destructive superposition
of multiple waves (multi-path propagation) at the re-
ceiver antenna. The incoming waves are shifted in
time and frequency due to Doppler effect and time de-
lay of each wave. In (Virdis et al., 2015), a modified
Jakes model (Jakes, 1974) is used, which simplifies
the calculation of multi-path propagation. This ap-
proach differentiates between mobile nodes and base
stations and assumes a fixed amount of waves with a
random angle of arrival for the mobile nodes and the
same angle of arrival for the base stations. The propa-
gation delay of each fading path at the receiver is nor-
mally distributed with the root-mean-square (RMS)
delay spread as requested in (Jakes, 1974). The rel-
ative speed of vehicles is retrieved from the micro-
scopic traffic simulator SUMO (Krajzewicz et al.,
2002), to calculate the respective phase shift of each
wave (Doppler effect), obtain the total phase shift
(Doppler and Delay spread) and hence determine the
channel impulse response h(t,τ).
3.1.5 Scalability
The calculation of path loss and small-scale fading in
our proposed channel model do not depend on other
objects. Hence, the computational complexity per
V2X-enabled vehicle is mainly affected by the de-
termination of the communication link. As only the
direct path between receiver and transmitter is con-
sidered, the computational complexity per node is
O(V + I), where V and I depict the number of vehi-
cles and the number of other interfering objects such
as buildings and infrastructures, respectively. In con-
trast to that, ray-tracing approaches, as described in
(J. Maurer and T. Fugen and T. Schafer and W. Wies-
beck, 2004), tend to have a computational complexity
greater than O((V + I)
2
) (Viriyasitavat et al., 2015)
per node and therefore cannot be considered for large-
scale simulations.
3.2 Message Dissemination
For 802.11p, we consider a simple SHB dissemina-
tion as beacons are usually addressed to the immedi-
ate surrounding of the vehicle.
For LTE, we use unicast transmission mode in
both up- and downlink directions in order to obtain
results for a worst-case scenario in terms of chan-
nel load. This also avoids time-expensive session se-
tups for multicast transmission. We implement the
Geocast mechanism described in (Intelligent Trans-
port Systems, 2012). The simulation area is divided in
cells, where each cell will be encoded into a Geohash
(Niemeyer, 2008). When a vehicle leaves its current
cell, it will send a location update to the GeoServer.
The GeoServer calculates the new Geohash and sends
the boundaries of the next cell back to the respective
vehicle. Hence, the GeoServer is able to forward bea-
cons to all vehicles within the same cell (Geohash) of
the transmitter.
4 SIMULATION SETUP
In this section, we describe our simulation setup.
4.1 Simulator
The representation of the map scenario and traffic
flow is realized using SUMO 0.32 (Krajzewicz et al.,
2002), which is connected by the TraCI interface
to the communication simulator Veins 4.7 (Sommer
et al., 2011), representing the 802.11p stack. Veins
builds on OMNeT++ 5.3 (Varga and Hornig, 2008).
The LTE stack is implemented in SimuLTE, which
Safety-relevant V2X Beaconing in Realistic and Scalable Heterogeneous Radio Propagation Fading Channels
407
was modified in (Virdis et al., 2015) to work in V2X
network simulations. The simulation parameters are
listed in Table 1. The RMS delay spreads for 802.11p
and LTE microscopic simulations were taken from
(Bernado et al., 2014) and (Virdis et al., 2015), re-
spectively.
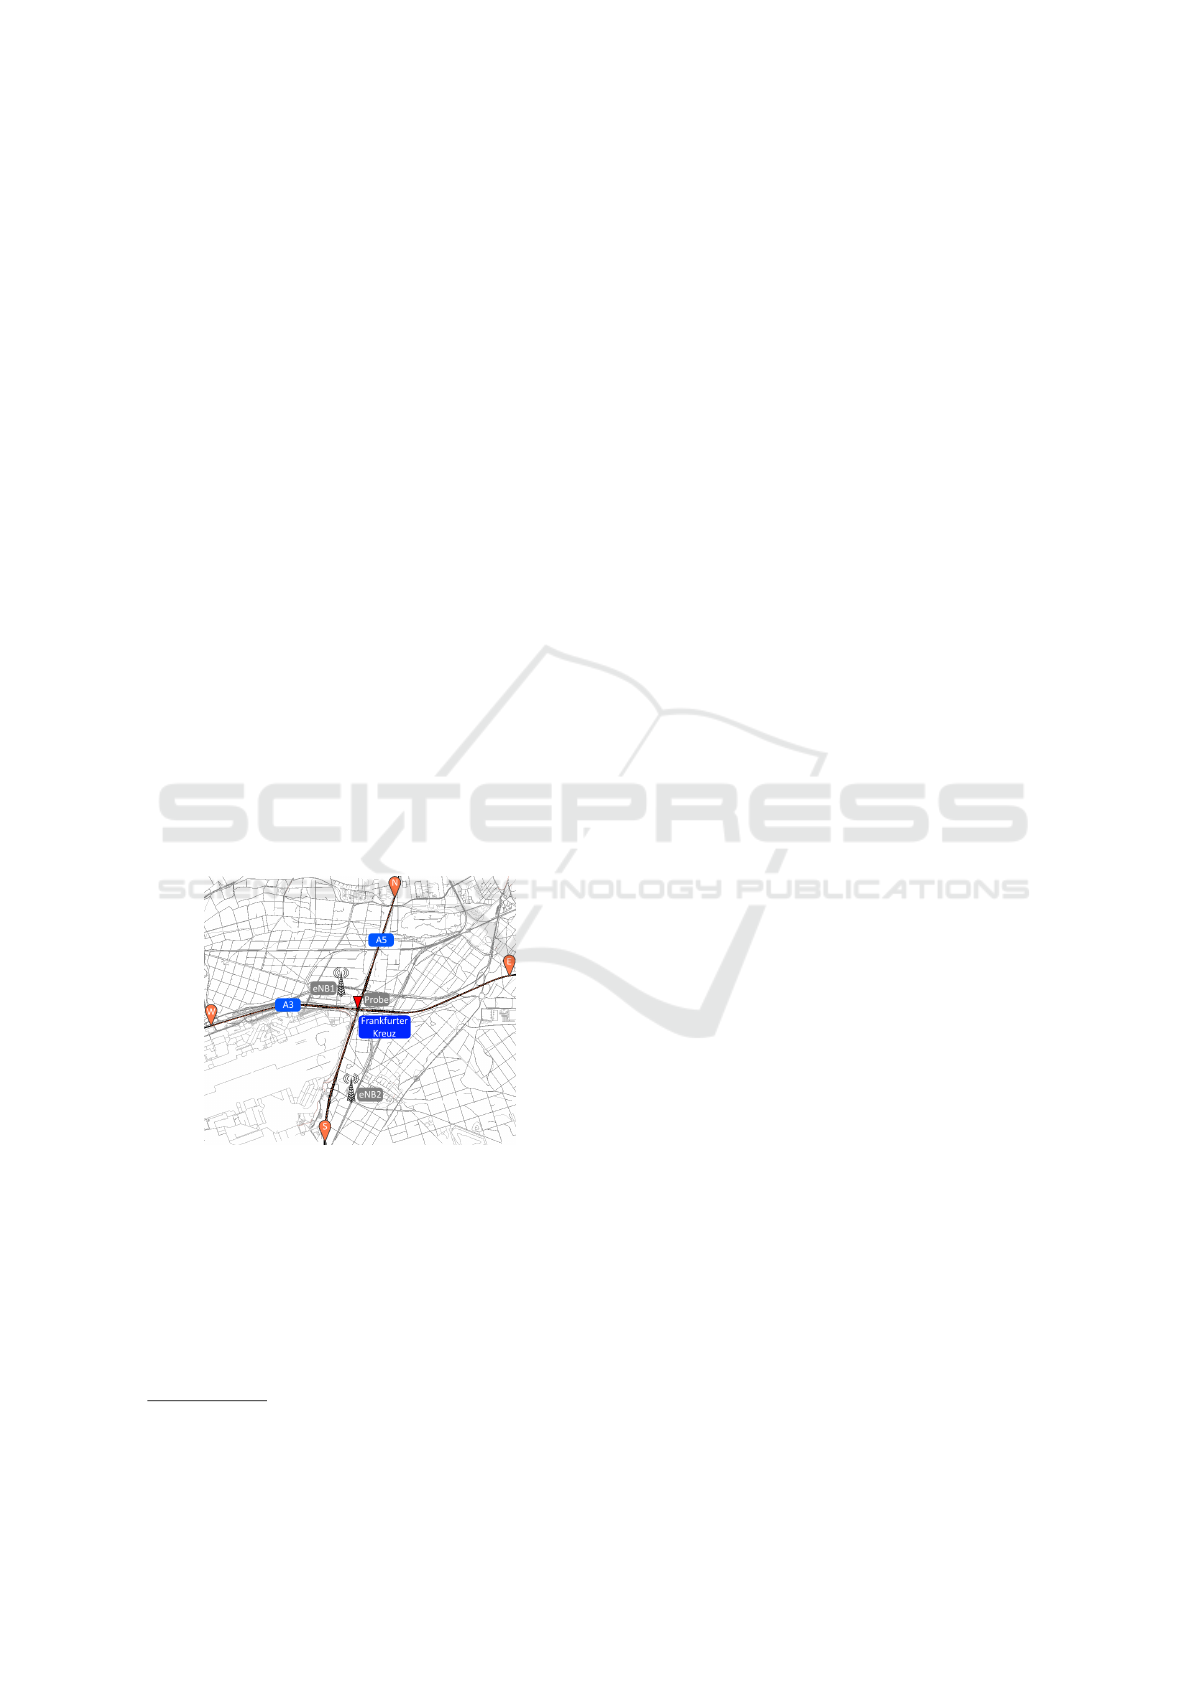
4.2 Scenario Design
For the simulation scenario, a motorway intersection
at the Frankfurter Kreuz in Germany was chosen,
where the selected section was extracted from Open-
StreetMap (FOSSGIS e.V., 2018) and converted to a
SUMO compatible format. The resulting map file is
depicted in Figure 2. For the evaluation of the channel
load for 802.11p, a network probe (Probe) is installed
in the center of the Frankfurter Kreuz. The maximum
interference range is set to 1500 m, as this distance is
in the order of the maximum theoretical transmission
range following Equation 1 under the assumption of
the transmission power, antenna gain and sensitivity
from Table 1. For cellular LTE communications, two
base stations, one at the Frankfurter Kreuz (eNB1)
and another one to the south of the A5 (eNB2), are
assumed and connected via a X2 connection to en-
able handovers. The locations and antenna heights of
both base stations were taken from (Bundesnetzagen-
tur, 2016). The size of the map area covers the com-
munication range for two base stations. The scenario
Figure 2: Motorway scenario: Frankfurter Kreuz in SUMO
(Krajzewicz et al., 2002).
is characterized by its high traffic density and high
relative velocities. The former is taken from the BASt
database in 2016
1
(Kraftfahrt Bundesamt, 2016), such
that the motorway is populated as follows:
• A3: 4692 vehicles and 985 trucks driving from the
west (W) to the east (E) side and 4950 vehicles
and 860 trucks in the opposite direction per hour
1
The maximum traffic density within the whole year was
taken
• A5: 7933 vehicles and 776 trucks from the north
(N) to the south side (S) and 5988 vehicles and
796 trucks in the opposite direction per hour and
driving direction
During the simulation run, vehicles and trucks were
driving with a mean velocity of 126 km/h and
96 km/h, where the maximum allowed velocity was
set to 180 km/h and 100 km/h, respectively.
5 EVALUATION
In order to show the characteristics of the heteroge-
neous channel model, we evaluate the channel gain
and PER for both radio technologies. As the main
contribution of this paper, we also evaluate the chan-
nel load for both radio technologies under the con-
sideration of a realistic heterogeneous channel model,
using a safety-relevant V2X beaconing application.
We briefly summarize our performance metrics,
which will be later used in the evaluation. The Chan-
nel Gain describes the environment dependent atten-
uation of the signal in dB, when traveling from the
transmitter to the receiver. The antenna gains on both
sides are not considered, as we are interested in the
radio propagation channel effects. Packet Error Ra-
tio is the number of packets which cannot be decoded
correctly at the receiver side, denoted by N
p,err
, di-
vided by the number of all received packets, denoted
by N
p,suc
. Hence, the PER is N
p,err
/N
p,suc
. For our
evaluation, we obtain the PER in distance bins with a
length of 10 m and 50 m for 802.11p and LTE, respec-
tively. We determine the median as well as the lower
and upper quartile for distance bins of length 100 m
and 500 m for 802.11p and LTE, respectively, derived
from the smaller distance bins described before. The
Channel Load describes the ratio of the capacity used
to the theoretical maximum capacity. The available
channel bandwidth physically limits the channel ca-
pacity. For 802.11p, we use the Channel Busy Ra-
tio (CBR) as the performance metric for the channel
load, which was also used in (Guenther et al., 2016).
For LTE, we obtain the cell block utilization for both
bands in the up- and downlink, which is supported by
the LTE scheduler in (Virdis et al., 2015).
5.1 Channel Gain
5.1.1 802.11p
The measurement results are obtained from all vehi-
cles within the simulation time and are depicted in
Figure 3. The channel gain measurements depicted
in blue and black indicate the condition of LOS and
VEHITS 2019 - 5th International Conference on Vehicle Technology and Intelligent Transport Systems
408
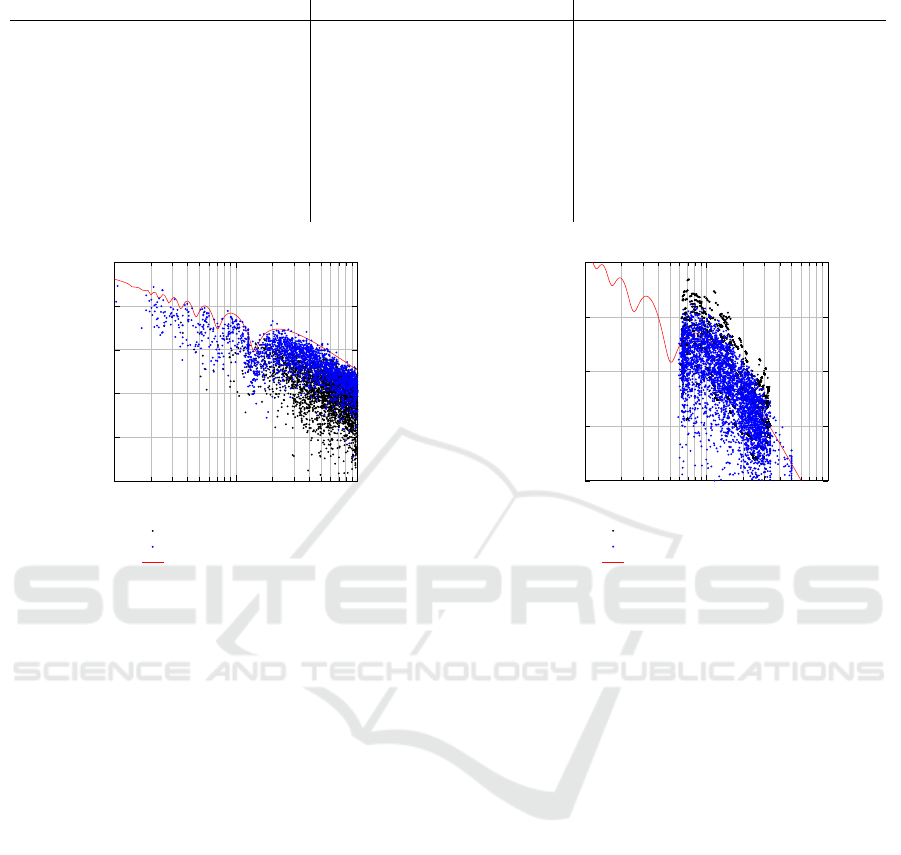
Table 1: Overview of the simulation parameters.
General 802.11p LTE
Simulation time 100..120 s Carrier frequency 5.89 GHz Carrier frequency 2 GHz
Map Area 33.8 km
2
Channel bandwidth 10 MHz Channel bandwidth 10 MHz
Beacon size 300 B Bit rate 6 Mb/s Coding rate AMC
Beacon Interval 10 Hz Transmit Power 21 dBm Transmit Power (eNB) 46 dBm
Thermal noise -104.5 dBm Sensitivity -89.5 dBm Number of Bands (up/down) 2
Fading paths 6 Antenna Gain 3 dB Antenna Gain (Vehicle) 3 dB
Antenna height cars 1.5 m Interference range 1500 m Antenna Gain (eNB) 16 dB
Antenna height trucks 2.4 m Transmit Mode SHB Transmit Mode Unicast
Antenna height (eNB1) 27 m
Delay spread RMS 0.644 µs Delay spread RMS 0.363 µs
Antenna height (eNB2) 25.4 m Geohash length 7
10
1
10
2
10
3
−160
−140
−120
−100
−80
−60
Distance between Rx and Tx (m)
Channel gain (dB)
Channel gain 802.11p (NLOS)
Channel gain 802.11p (LOS)
Two-ray ground-reflection gain
Figure 3: Channel Gain over distance for 802.11p.
NLOS, respectively. The upper limit of the channel
gain (LOS, blue) is bounded by the 2-RGR, where the
ideal 2-RGR is depicted in red, following the attenua-
tion term of Equation 2. The lower limit of the chan-
nel gain is unbounded due to fading (NLOS, black).
The channel gain fluctuation is increased at larger dis-
tances as the probability of an obstruction in the prop-
agation path is increased. We validated our proposed
model with measurement results obtained in a motor-
way scenario from (Nilsson et al., 2017). Within the
distance bins of 10 m, 100 m and 1000 m, the chan-
nel gain differs in the order of 3 dB, 5 dB and 2 dB,
respectively.
5.1.2 LTE
The channel gain for LTE in the downlink (blue) and
uplink (black) channel from eNodeB1 (eNB1) is de-
picted in Figure 4. The channel gain follows the 2-
RGR model. As the antenna at the base station is at
the height of 27 m, the LOS link is dominant, even
though we consider mixed traffic in our simulation
environment. The fluctuation of the channel gain is
caused by the Jakes fading model, where constructive
and destructive interference appears. The represen-
tation of the channel gain is different in the up- and
10
2
10
3
10
4
−120
−110
−100
−90
−80
Distance between Rx and Tx (m)
Channel gain (dB)
Channel gain LTE Uplink eNB1
Channel gain LTE Downlink eNB1
Two-ray ground-reflection model
Figure 4: Channel Gain over distance for LTE.
downlink channel, that is, the Jakes fading model dif-
ferentiates between both communication directions.
The recent literature currently lacks real-world
measurements for V2X LTE channel gain in different
environments and frequency spectra. In (Maaz et al.,
2015), the path loss in the downlink was measured
at 2.1 GHz in an urban environment and differentiates
between LOS and NLOS condition. Unfortunately,
there are no measurement results available for LOS
condition between a distance of 500 m and 3000 m. In
comparison with our channel model, the lower limit
of the channel gain for NLOS is roughly 20 dB higher
compared to our results. This is justified by the high
attenuation due to shadowing in urban scenarios.
5.2 Packet Error Ratio
For both radio technologies, the PERs are depicted in
Figure 5. For 802.11p the PER increases with dis-
tance and at 1000 m almost no packet can be decoded
correctly. The PER for LTE in the up- and downlink
is significantly lower. The median PER is below 0.05
and 0.03 in the up- and downlink, respectively. In
contrast to 802.11p, where the code and hence the bit
rate is not adapting to the condition of the radio prop-
agation channel, LTE can leverage from the feedback
Safety-relevant V2X Beaconing in Realistic and Scalable Heterogeneous Radio Propagation Fading Channels
409
0 200 400
600
800 1,000
0
0.1
0.2
0.3
0.4
0.5
0.6
0.7
0.8
0.9
1
Distance between Rx and Tx (m)
Packet Error Ratio
PER 802.11p
0 1,000 2,000 3,000
0
1 · 10
−2
2 · 10
−2
3 · 10
−2
4 · 10
−2
5 · 10
−2
6 · 10
−2
7 · 10
−2
8 · 10
−2
9 · 10
−2
0.1
Distance between Rx and Tx (m)
PER LTE Uplink
PER LTE Downlink
Figure 5: PER for 802.11p and LTE (Up- and Downlink).
channel. We compared our results with real-world
measurements in a suburban scenario from (Liu et al.,
2016). The PER for LTE up to a distance of 500 m
is almost 0 %, which is in accordance with our mea-
sured PER (below 1 % at 500 m distance). The PER
for 802.11p is at 30 % and 45 % at a distance of 300 m
and 500 m, respectively. This is also in accordance
with our results, where we obtained a PER of 25 %
and 45 % for the aforementioned distance bins.
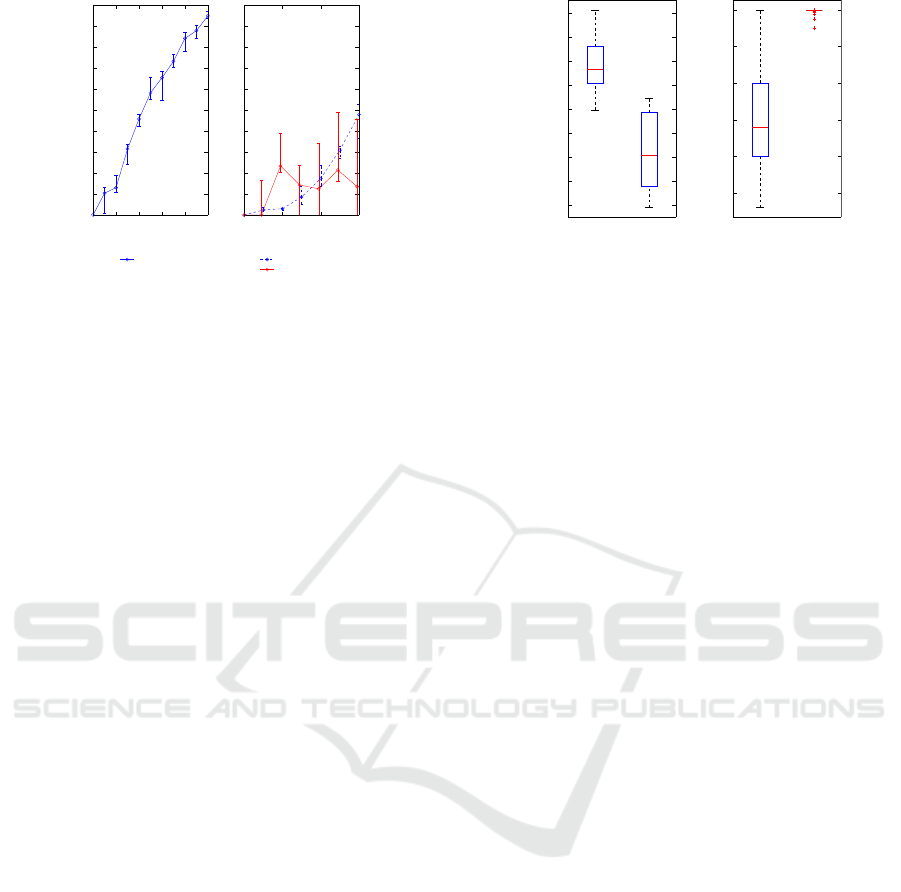
5.3 Channel Load
Finally, we analyse the impact of beacons on the
channel load for ad-hoc and cellular communication
using our realistic radio propagation channel model.
In Figure 6, the channel load is represented as CBR
for 802.11p and cell block utilization for LTE.
The box plot to the left depicts the CBR for the re-
alistic channel model (Realistic) proposed in Section
2.1 and the maximum range channel model (Range)
for 802.11p, where the maximum transmission range
is set to 300 m. The median of the CBR for the realis-
tic channel model is roughly 0.17 compared to 0.1 for
the maximum range channel model. Maximum range
channel models neglect all packets above the maxi-
mum transmission range. This assumption reduces
the local CBR for each vehicle, as only packets within
a radius of 300 m are received. In contrast to that, the
realistic channel model still receives a certain amount
of packets up to a distance of 1000 m as depicted in
Figure 5, which increases the total number of locally
received packets for each vehicle. We showed, that ra-
dio propagation channel models significantly impact
the representation of the channel load for microscopic
simulations.
On the right side of Figure 6, the cell block uti-
lization for LTE enB1 in the up- and downlink is de-
picted. The downlink channel is completely saturated
as depicted in Figure 6. As we use unicast transmis-
sion mode in the downlink channel, each beacon has
to be forwarded to each member of the same cell sep-
6 · 10
−2
8 · 10
−2
0.1
0.12
0.14
0.16
0.18
0.2
0.22
Realistic
Range
802.11p
Channel Busy Ratio
0.5
0.6
0.7
0.8
0.9
1
Uplink
Downlink
LTE enB1
Cell Block Utilization
Figure 6: Channel load for 802.11p (realistic and range
channel model) and LTE (Up- and Downlink).
arately, which increases the cell load. The cell block
utilization is lower in the uplink, where the median is
around 0.68. This also indicates that the uplink chan-
nel is saturated by more than 2/3 of the total band-
width (10 MHz) used in the simulation, even without
considering channel usage by other devices such as
mobile phones.
6 CONCLUSION
Performance evaluations in the context of micro-
scopic V2X heterogeneous communication systems
are often dramatically simplifying the radio propaga-
tion channel to a maximum transmission range model.
In this paper, we investigated a realistic heteroge-
neous radio propagation channel model for large-
scale simulations with respect to the computational
complexity. We presented first measurement results
for ad-hoc and cellular communication using a bea-
coning application in a highly populated motorway
scenario to obtain results for channel gain, PER and
channel load.
In our evaluation, we showed that the channel
model significantly impacts the CBR for 802.11p. We
compared our results with a maximum range trans-
mission model, which was frequently used in the lit-
erature.
Furthermore, we shed light on the channel load for
LTE Geocast. Even though we choose the cell size
to be small, the channel load was high in the uplink
and saturated in the downlink. We also showed that
the channel load for V2X beaconing applications was
lower for 802.11p compared to LTE.
In our future work, we plan to investigate ad-
vanced dissemination strategies and filter rules to ex-
tend the LTE Geocast approach. Furthermore, we use
heterogeneous communication systems to improve
the dissemination of safety-relevant V2X messages.
VEHITS 2019 - 5th International Conference on Vehicle Technology and Intelligent Transport Systems
410

REFERENCES
Acosta-Marum, G. and Ingram, M. A. (2007). Six time-
and frequency- selective empirical channel models for
vehicular wireless LANs. IEEE Vehicular Technology
Magazine, 2(4):4–11.
Araniti, G., Campolo, C., Condoluci, M., Iera, A., and
Molinaro, A. (2013). LTE for vehicular networking: a
survey. IEEE Communications Magazine, 51(5).
Bernado, L., Zemen, T., Tufvesson, F., Molisch, A. F., and
Mecklenbr
¨
auker, C. F. (2014). Delay and Doppler
Spreads of Nonstationary Vehicular Channels for
Safety-Relevant Scenarios. IEEE Transactions on Ve-
hicular Technology, 63(1):82–93.
Boban, M., Vinhoza, T. T. V., Ferreira, M., Barros, J., and
Tonguz, O. K. (2011). Impact of Vehicles as Obsta-
cles in Vehicular Ad Hoc Networks. IEEE Journal on
Selected Areas in Communications, 29(1):15–28.
Bundesnetzagentur (2016). EMF-Datenbank. https://emf3.
bundesnetzagentur.de/karte/. Last checked on Dec 14,
2018.
Cecchini, G., Bazzi, A., Masini, B. M., and Zanella, A.
(2017). LTEV2Vsim: An LTE-V2V simulator for
the investigation of resource allocation for coopera-
tive awareness. In 2017 5th IEEE International Con-
ference on Models and Technologies for Intelligent
Transportation Systems (MT-ITS), pages 80–85.
Czink, N. and Oestges, C. (2008). The COST 273 MIMO
Channel Model: Three Kinds of Clusters. In 2008
IEEE 10th International Symposium on Spread Spec-
trum Techniques and Applications, pages 282–286.
FOSSGIS e.V. (2018). OpenStreetMap - Deutschland.
https://www.openstreetmap.de/. Last checked on
Dec 14, 2018.
Guenther, H. J., Riebl, R., Wolf, L., and Facchi, C. (2016).
Collective perception and decentralized congestion
control in vehicular ad-hoc networks. In 2016 IEEE
Vehicular Networking Conference (VNC), pages 1–8.
Hameed Mir, Z. and Filali, F. (2014). LTE and IEEE
802.11p for vehicular networking: a performance
evaluation. EURASIP Journal on Wireless Commu-
nications and Networking, 2014(1):89.
Intelligent Transport Systems (2012). Framework for Public
Mobile Networks in Cooperative ITS (C-ITS). Tech-
nical report, ETSI.
J. Maurer and T. Fugen and T. Schafer and W. Wiesbeck
(2004). A new inter-vehicle communications (IVC)
channel model. In IEEE 60th Vehicular Technology
Conference, 2004. VTC2004-Fall. 2004, volume 1.
Jakes, W. C. (1974). Microwave Mobile Communications.
John Wiley & Sons.
Kraftfahrt Bundesamt (2016). Fahrzeugbestand im Ue-
berblick. https://www.kba.de/DE/Statistik/. Last
checked on Apr 14, 2018.
Krajzewicz, D., Hertkorn, G., Roessel, C., and Wagner, P.
(2002). SUMO (Simulation of Urban MObility); An
open-source traffic simulation. 4th Middle east sym-
posium on simulation and modelling (MESM 2002).
Ky
¨
osti, P., Meinil
¨
a, J., and Hentil
¨
a, L. (2008). Winner II
Channel Models ver. 1.2. Technical Report D1.1.2,
Winner II Project.
Liu, Z., Liu, Z., Meng, Z., Yang, X., Pu, L., and Zhang,
L. (2016). Implementation and performance measure-
ment of a V2X communication system for vehicle and
pedestrian safety. International Journal of Distributed
Sensor Networks, 12(9):1550147716671267.
Maaz, I., Conrat, J., and Cousin, J. (2015). Channel Model
Validation for the Relay-Mobile Link in Microcell En-
vironment. In 2015 IEEE 82nd Vehicular Technology
Conference (VTC2015-Fall), pages 1–5.
Masini, B., Bazzi, A., and Zanella, A. (2018). A survey on
the roadmap to mandate on board connectivity and en-
able V2V-based vehicular sensor networks. Sensors,
18(7):2207.
Moller, A., Nuckelt, J., Rose, D. M., and Kurner, T. (2014).
Physical Layer Performance Comparison of LTE and
IEEE 802.11p for Vehicular Communication in an Ur-
ban NLOS Scenario. In 2014 IEEE 80th Vehicular
Technology Conference (VTC2014-Fall), pages 1–5.
Niemeyer, G. (2008). Geohash. https://en.wikipedia.org/
wiki/Geohash. Last checked on Dec 14, 2018.
Nilsson, M. G., Gustafson, C., Abbas, T., and Tufvesson,
F. (2017). A Measurement-Based Multilink Shadow-
ing Model for V2V Network Simulations of Highway
Scenarios. IEEE Transactions on Vehicular Technol-
ogy, 66(10):8632–8643.
Sommer, C., German, R., and Dressler, F. (2011). Bidirec-
tionally Coupled Network and Road Traffic Simula-
tion for Improved IVC Analysis. IEEE Transactions
on Mobile Computing, 10(1):3–15.
Sommer, C., Joerer, S., Segata, M., Tonguz, O. K.,
Lo Cigno, R., and Dressler, F. (2015). How Shad-
owing Hurts Vehicular Communications and How Dy-
namic Beaconing Can Help. IEEE Transactions on
Mobile Computing, 14(7):1411–1421.
Varga, A. and Hornig, R. (2008). An Overview of the OM-
NeT++ Simulation Environment. In Proceedings of
the 1st International Conference on Simulation Tools
and Techniques for Communications, Networks and
Systems & Workshops.
Vinel, A. (2012). 3GPP LTE Versus IEEE 802.11p/WAVE:
Which Technology is Able to Support Cooperative
Vehicular Safety Applications? IEEE Wireless Com-
munications Letters, 1(2):125–128.
Virdis, A., Stea, G., and Nardini, G. (2015). Simulat-
ing LTE/LTE-Advanced Networks with SimuLTE. In
Simulation and Modeling Methodologies, Technolo-
gies and Applications.
Viriyasitavat, W., Boban, M., Tsai, H., and Vasilakos, A.
(2015). Vehicular Communications: Survey and Chal-
lenges of Channel and Propagation Models. IEEE Ve-
hicular Technology Magazine, 10(2):55–66.
Xiao, L., Zhuang, W., Zhou, S., and Chen, C. (2019). Intel-
ligent Network Access System for Vehicular Real-Time
Service Provisioning, chapter Intelligent Network Ac-
cess System for Vehicular Real-Time Service Provi-
sioning, pages 79–104. Springer International Pub-
lishing, Cham.
Safety-relevant V2X Beaconing in Realistic and Scalable Heterogeneous Radio Propagation Fading Channels
411
